Augmented Central Pain Processing Occurs after Osteoporotic Vertebral Compression Fractures and Is Associated with Residual Back Pain after Percutaneous Vertebroplasty
Article information
Abstract
Study Design
A retrospective analysis.
Purpose
To investigate the occurrence of central sensitization (CS) in patients with osteoporotic vertebral compression fractures (OVCFs) and identify the association between CS and residual back pain (RBP).
Overview of Literature
RBP is a vexing complication that affects 6.3%–17.0% of patients with OVCFs who underwent percutaneous vertebroplasty (PVP). Given the negative effect of RBP on patients’ psychological and physiological statuses, efforts to preoperatively select patients who are at risk for RBP development have a high priority to offer additional treatment and minimize this complication.
Methods
Preoperatively, all 160 patients with OVCFs underwent pressure-pain threshold (PPT), temporal summation (TS), conditioned pain modulation (CPM), and imaging assessments. Pain intensity and pain-related disability were evaluated before and after PVP.
Results
Preoperatively, patients with OVCFs had lower PPTs in both local pain and pain-free areas and lower CPM and higher TS in pain-free areas than healthy participants (p<0.05). Unlike patients with acute fractures, patients with subacute/chronic OVCFs showed higher TS with or without lower CPM in the pain-free area compared with healthy participants (p<0.05). Postoperatively, RBP occurred in 17 of 160 patients (10.6%). All preoperative covariates with significant differences between the RBP and non-RBP groups were subjected to multivariate logistic regression, showing that intravertebral vacuum cleft, posterior fascia edema, numeric rating pain scale scores for low back pain at rest, and TS were independently associated with RBP (p<0.05).
Conclusions
Augmented central pain processing may occur in patients with OVCFs, even in the subacute stage, and this preexisting CS may be associated with RBP. Preoperative assessment of TS in pain-free areas may provide additional information for identifying patients who may be at risk of RBP development, which may be beneficial for preventing this complication.
Introduction
As the proportion of aging adults increases globally, the incidence of osteoporotic vertebral compression fractures (OVCFs) also increases [1,2]. OVCFs, one of the most common complications of osteoporosis, often occur because of low-energy trauma and are prevalent in older people. OVCFs mainly cause persistent back pain and progressive spinal deformities, thereby reducing quality of life [2-4]. Percutaneous vertebroplasty (PVP) is a minimally invasive surgical method that has been widely used in treating symptomatic OVCFs to provide instant pain relief, stabilize the fractured vertebral body, and improve physical function [5,6]. Increasing evidence demonstrates that this vertebral augmentation procedure usually has excellent clinical outcomes [5,6]. However, some serious complications may occur in patients who undergo vertebral augmentation procedures [3,5-10]. Among these, residual back pain (RBP) is a vexing complication that affects approximately 6.3%–17.0% of patients [8-10]. Given the negative effect of RBP on patients’ psychological and physiological statuses, minimizing the risk of this complication is a high priority.
Although previous studies have demonstrated that RBP is related to different factors [8-10], the exact pathogenic factors of RBP remain unclear. In clinical practice, some OVCF symptoms, including diffuse pain distribution and resting pain, are also common in other pain-related diseases (e.g., fibromyalgia, chronic low back pain [LBP], and failed back surgery syndrome) [11-13], suggesting the potential of augmented central pain processing. Thus, central sensitization (CS) may occur in patients with OVCFs. Importantly, many studies have indicated that preexisting CS is closely associated with postoperative pain [14-16]. Therefore, the possible existence of altered central pain modulation in patients with OVCFs may be involved in the pathogenesis of RBP.
Previous studies have revealed the mechanisms of CS mainly involve pain facilitation and inhibition, which can be quantified by temporal summation (TS) and conditioned pain modulation (CPM) [17,18]. Both TS and CPM are dynamic quantitative sensory testing (QST) methods that can assess the function of central facilitation and inhibition modulation of incoming nociceptive signals [19,20]. The reliability of these dynamic QST measurements has been confirmed in many previous studies [11-13,21].
Therefore, this study aimed to investigate the existence of CS in patients with OVCFs and analyze the association between augmented central pain processing and RBP after PVP.
Materials and Methods
All methods used in this retrospective study were performed in accordance with the Declaration of Helsinki, and the study protocol was approved by the Ethics Committee of Huashan Hospital (Fudan University, China; KY2023-1086). The participants provided written informed consent.
Participants
Between January 2019 and May 2022, 218 patients were diagnosed with OVCFs and underwent PVP in our institution. Of these 218 patients, 58 who did not meet the inclusion criteria or met any of the exclusion criteria were excluded. In total, 160 patients were ultimately included (Fig. 1).
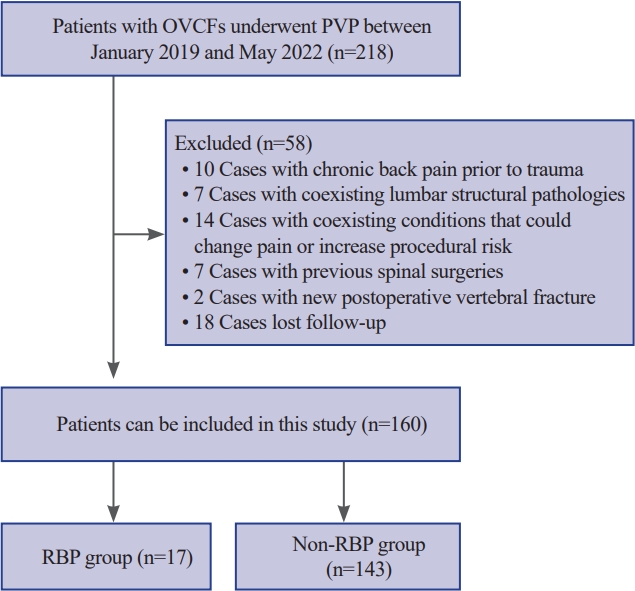
Design of both patient selection and grouping. OVCFs, osteoporotic vertebral compression fractures; PVP, percutaneous vertebroplasty; RBP, residual back pain.
The inclusion criteria were as follows: (1) age >60 years, (2) presence of LBP (Numeric Rating Pain Scale [NRS; 0=no pain, 10=maximum tolerable pain] of pain of ≥4 at rest or during movement) with limited physical activity with or without history of trauma; (3) vertebral compression fractures identified by both spine radiograph (vertebral height loss) and magnetic resonance imaging (MRI) (bone marrow edema of the affected vertebra); (4) focal tenderness at the fracture level identified by physical examination; (5) bone attenuation T-scores of <–2.5 at the spine/hip; and (6) 6-month follow-up after PVP.
The exclusion criteria were as follows: (1) fractures caused by pathological changes (e.g., tumor and infection), (2) chronic back pain before trauma, (3) previous spinal surgeries, (4) spinal structural pathologies (e.g., infections, tumor, osteomyelitis, or spondylodiscitis), (5) spinal cord/nerve root compressive symptoms caused by bony fragments or bone cement leakage, (6) a new postoperative vertebral fracture, and (7) coexisting conditions that could increase procedural risk, worsen/change pain, or affect communication (e.g., severe hypertension or cardiac disease, cognitive disorders, or neurological disease).
PVP procedures and postoperative treatment
Patients were lying prone on the operating table and received local anesthesia. Puncture needles were inserted into the fractured vertebral body via bilateral pedicles under C-arm guidance, and the tip of the needles was confirmed in the anterior middle third of the vertebral body. Under C-arm monitoring, polymethylmethacrylate (PMMA) was slowly injected into the fractured vertebral body; however, the injection was stopped if the PMMA reached the cortical edge of the vertebral body or leaked into extraosseous structures/veins. After the injection, the patients remained in the prone position for 10–15 minutes. All patients were encouraged to ambulate with support on the first day after PVP.
All patients were administered orally with calcium (600 mg/day) and calcitriol (0.25 μg/day) postoperatively. Furthermore, analgesic drugs (e.g., acetaminophen, nonsteroidal antiinflammatory drugs, or nonopioid analgesic drugs) were not usually administered to patients after PVP unless pain was not adequately relieved or postoperative pain still affected their daily life.
Testing methods
All measurements were performed by different clinicians who were blinded to patients with or without RBP before surgery.
1) Dynamic quantitative sensory testing
Dynamic QST was performed on all patients 1 day before PVP using a pressure algometer (FDN 100; Wagner Instruments, Greenwich, CT, USA), and the same tests were repeated in 72 of these 160 patients approximately 6 months after surgery.
The pressure-pain threshold (PPT) was recorded from two different regions in each participant: (1) surface localization of the fractured vertebral body (local pain area) and (2) the dominant hand (approximately in the middle of the proximal transverse arch) for all participants (remote pain-free area). The PPT was assessed 3 times in each region with an interstimulus interval of at least 60 seconds, and the average of three assessments was recorded as the PPT for this region [13,21]. After the PPT was recorded, both TS and CPM were performed at the remote pain-free area.
During the TS assessments, 10 sequential mechanical pressure stimulations were applied at the PPT level (at 1-second intervals with the assistance of a metronome) in the remote pain-free area [13,21]. The participants were asked to score their pain with the 1st and 10th pulses using the NRS, and the TS result was determined based on the difference between these two NRS scores.
During CPM assessments, an intense conditioning stimulus was applied to the nondominant upper arm with an 11-cm wide tourniquet to temporarily induce ischemic pain [13,21]. The pressure cuff was placed just proximal to the cubital fossa and inflated to approximately 260 mm Hg, and the participants were asked to lift a dumbbell (1 kg for women and 2 kg for men) by stretching their wrists until they completed 45 wrist lifts or when the pain intensity of the upper arm reached ≥7 on the NRS. During the painful conditioning stimulus, the parallel pain threshold (test stimulus) was repeatedly applied in remote pain-free areas, and the differences between the PPT with and without the conditioning stimulation were recorded as CPM.
2) Pain-related assessments
All patients were asked to rate the intensity of LBP at rest and during movement before and 1 day, 14 days, 1 month, and 6 months after surgery using the NRS. Referring to previous studies [8,9], if the average intensity of LBP during movement at 1 day, 14 days, and 1 month after surgery was ≥4 on the NRS, the patient was defined as having RBP after PVP. Furthermore, the Oswestry Disability Index (ODI) score was obtained before and 6 months after surgery.
3) Imaging assessments
Before surgery, X-ray imaging, computed tomography (CT), and MRI were performed in all patients, and all patients underwent an additional X-ray examination 1 day after PVP. During preoperative assessments, the anterior vertebral body compression percentage (the percentage of anterior vertebral body height relative to the average anterior vertebral body height of the upper and lower adjacent levels) was calculated, the local kyphotic angle (the angle between the superior and inferior endplates of the fractured level) was assessed, and the presence or absence of an intravertebral vacuum cleft or posterior fascia injury was determined (Fig. 2). At the postoperative 1-day assessments, vertebral body height restoration (the difference in the anterior vertebral body compression percentage before and after PVP), cement leakage, and separated cement distribution (bilateral cement masses were isolated and rarely connected) were assessed (Fig. 2).
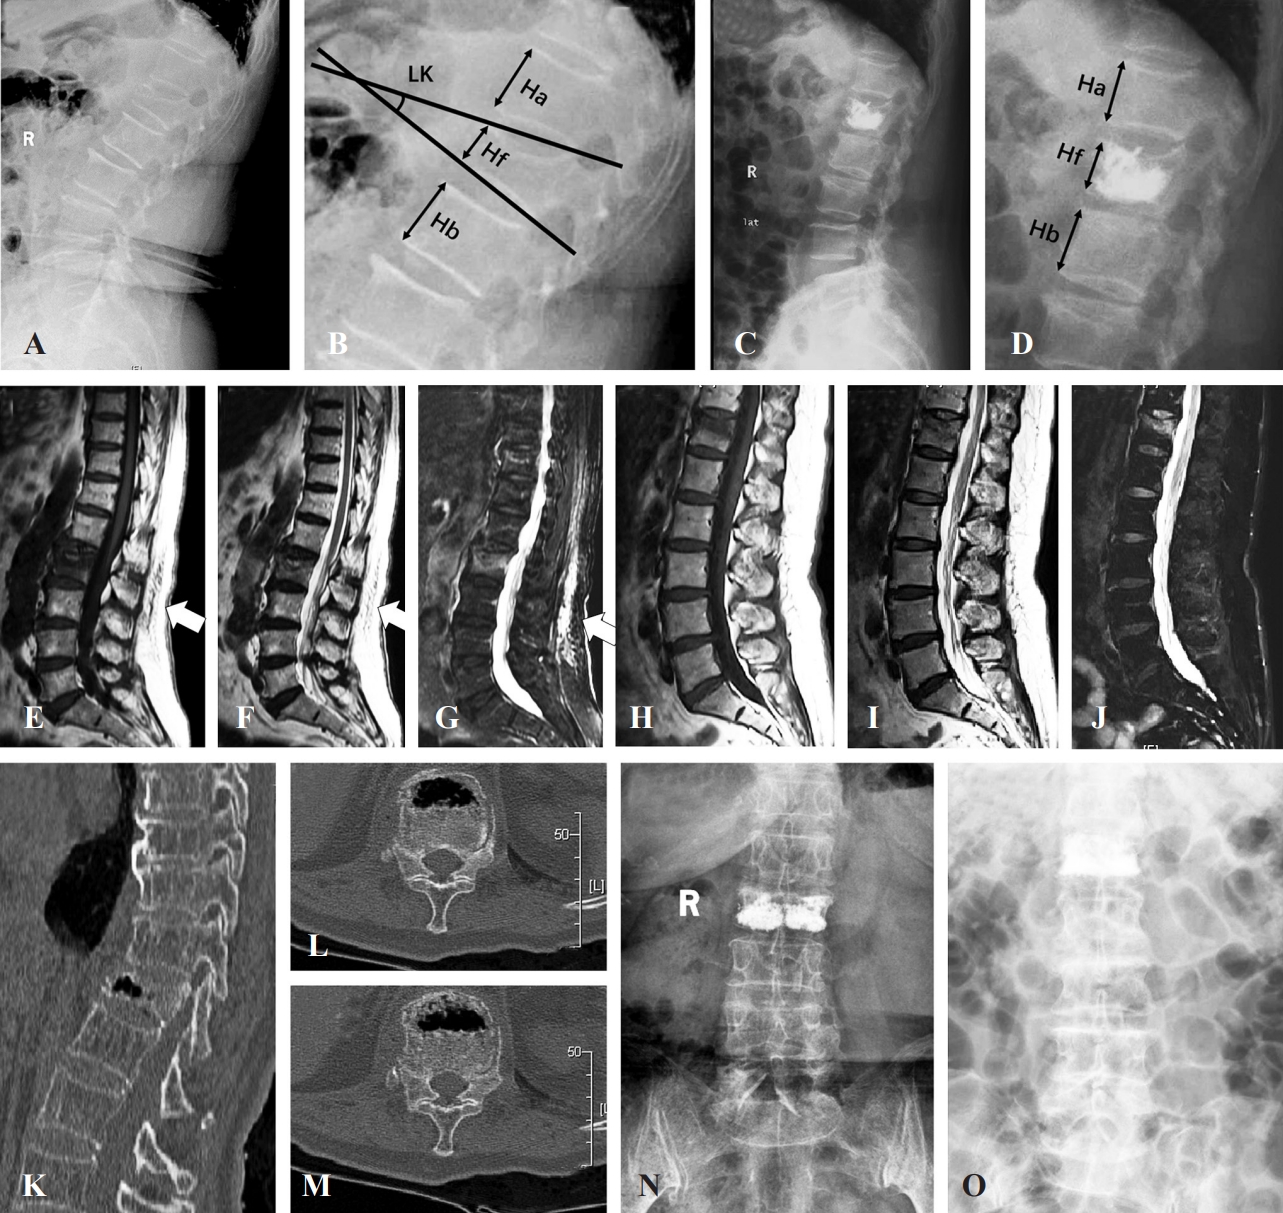
Perioperative imaging assessments of patients with osteoporotic vertebral compression fractures (OVCFs) undergoing percutaneous vertebroplasty (PVP). (A, B) Schematic diagram of measuring both the local kyphotic angle and anterior vertebral body compression percentage before PVP. (C, D) Schematic diagram of measuring the anterior vertebral body compression percentage after PVP. (E–G) Vertebral compression fracture with posterior fascia injury on magnetic resonance imaging (MRI) (white arrows). (H– J) Vertebral compression fracture without posterior fascia injury in MRI. (K–M) Vertebral compression fracture with intravertebral vacuum cleft. (N) X-ray shows separated cement masses in the fractured vertebral body. (O) X-ray shows confluent cement masses in the fractured vertebral body.
Statistical methods
All data were analyzed using IBM SPSS Statistics ver. 20.0 (IBM Corp., Armonk, NY, USA), and the Kolmogorov-Smirnov test was used to confirm a normal distribution. The measurements between the two different groups were compared by the independent t-test or the Mann-Whitney test, and the measurements among three different groups were analyzed using the least significant difference or Kruskal-Wallis H test. The frequencies of the measurements between the different patient groups were evaluated using chi-square tests. Preoperative and postoperative measurements were compared using the paired t-test or the Wilcoxon signed-rank test. Pearson or Spearman correlation analysis was used to evaluate the relationship between disease duration and preoperative QST measurements. Statistically significant preoperative covariates based on univariate analyses between patients with and without RBP were subjected to multivariate logistic regression analysis, and the cutoff values (CV) and area under the curve of the results of the multivariate logistic regression were identified by a receiver operating characteristic (ROC) curve. A p-value <0.05 was considered statistically significant.
Results
This study included 160 patients with OVCFs, and the demographic and medical measurements of these patients are listed in Table 1.
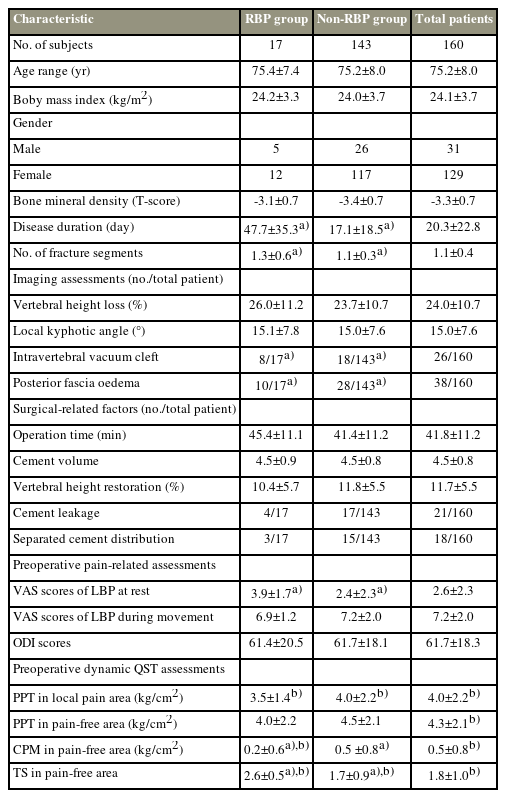
Demographic and medical measurements of patients with osteoporotic vertebral compression fractures undergoing percutaneous vertebroplasty
Assessment of pain sensitization in patients with OVCFs
Preoperatively, all patients with OVCFs presented with varying degrees of LBP during movement, and 99 of these 160 patients reported LBP at rest. Compared with the QST measurements of healthy participants from our previous study [13], patients with OVCFs in the present study had an obviously lower preoperative PPT in both local pain and pain-free areas, and compared with the healthy participants, patients with OVCFs had lower CPM and higher TS preoperatively in the pain-free areas (Table 1) [13].
According to the different preoperative disease durations, 73 patients had acute vertebral fractures (within 2 weeks), 73 had subacute vertebral fractures (2–8 weeks), and 14 had chronic vertebral fractures (>8 weeks) (Table 2). The NRS scores for LBP during movement and the ODI scores were higher in patients with acute fractures than in those with subacute and chronic fractures (Table 2). Although the NRS scores of LBP at rest were comparable among the three fracture groups, the number of patients with chronic fractures presented with LBP at rest was greater than those with acute fractures (Table 2). In the QST assessments, the PPT in the local pain area was significantly lower in the acute fracture group than in the subacute or chronic fracture group (Table 2), and the subacute or chronic fracture group showed higher TS in the pain-free area with or without lower CPM than the acute fracture group (Table 2). Furthermore, a weak correlation was found between the preoperative disease duration and both CPM and TS (Fig. 2).
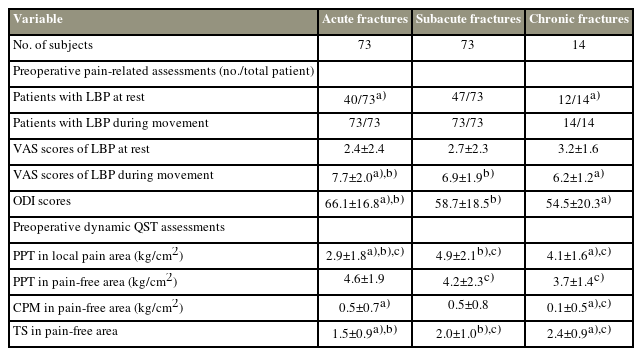
Pain-related and dynamic QST measurements among different fracture groups
Comparison between the RBP and non-RBP groups
In this study,17 of 160 patients (10.6%) presented with RBP after PVP, and the average NRS score of LBP during movement at multiple postoperative follow-ups within 1 month for these patients was 4.7±0.6. The 6-month postoperative follow-up demonstrated that postoperative chronic moderate-severe LBP (persistent LBP [NRS score ≥4] for >6 months after PVP) developed in 6 of these 17 patients.
Although the postoperative NRS and ODI scores were significantly lower in both the RBP and non-RBP groups than before PVP, obvious differences in all the postoperative follow-up NRS and ODI scores were found between the RBP and non-RBP groups (Table 3). In this study, dynamic QST detection was repeated in 72 patients (RBP 17 versus non-RBP 55) 6 months after PVP, and the results demonstrated that the nonRBP group showed reduced TS and increased CPM, as well as increased PPT in both tested areas, compared with the preoperative QST assessments (Supplement 1). In contrast, only PPT in the local pain area increased in the RBP group at the 6-month postoperative assessment, whereas all other QST measurements were similar before and after PVP (Supplement 2).
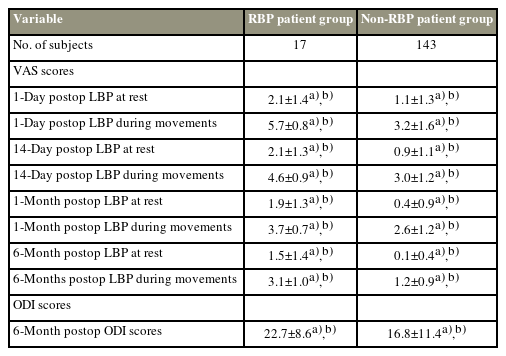
Pain-related assessments between patients with and without RBP after PVP
The comparison indicated that the following factors were significantly different between the RBP and non-RBP groups: preoperative disease duration, number of fracture segments, presence or absence of an intravertebral vacuum cleft, presence or absence of posterior fascia edema, NRS scores of LBP at rest, preoperative CPM, and preoperative TS (Table 1). All these statistically significant preoperative measurements (p<0.05) between the RBP and non-RBP groups were subjected to multivariate logistic regression analysis, and the results revealed that having an intravertebral vacuum cleft or posterior fascia edema, significant LBP at rest, and a high TS were independently associated with RBP (Table 4). Furthermore, the ROC curve analysis revealed the CV of LBP intensity at rest (CV of 1.0) and TS (CV of 2.5) for predicting RBP (Fig. 3).
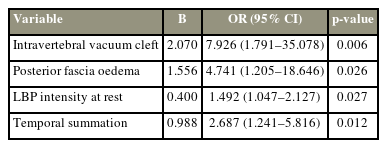
Multivariate regression analysis of significant risk factors of RBP
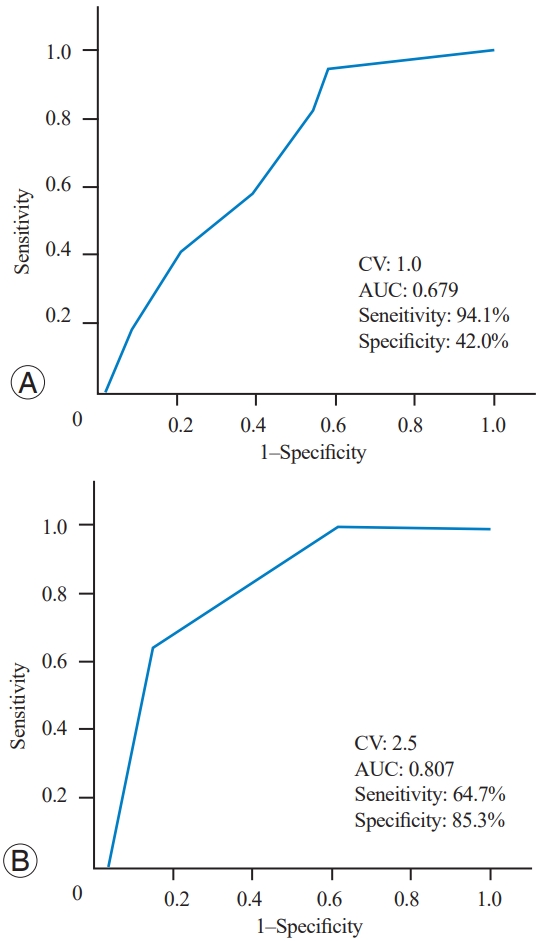
Receiver operating characteristic (ROC) curve analysis revealed the cutoff value of low back pain intensity at rest (A) and temporal summation (B) for predicting residual back pain after percutaneous vertebroplasty. CV, cutoff value; AUC, area under the ROC curve.
Discussion
Consistent with the observations of several pain-related diseases [11-13], significantly increased pressure-pain sensitivity was observed in both local and remote pain-free areas in patients with OVCFs, supporting the existence of diffuse hyperalgesia, which is the key feature of CS. Moreover, these patients with OVCFs had reduced CPM and increased TS. Noxious stimuli can reduce the activity of dorsal horn nociceptive neurons, which increases the pain threshold and thus decreases pain [19,20]. Depending on this pain-inhibiting-pain mechanism, CPM is considered a feasible method for evaluating the function of the descending inhibition pathway [19,20]. Furthermore, previous studies have generally demonstrated that sensitized neurons can amplify subthreshold synaptic inputs from injury sites and/or expand their receptive field, generating an augmented action potential output and resulting in hyperalgesia and increased pain [19,20]. Therefore, similar to wind-up, TS reflects the central facilitating properties of pain modulation [19,20]. These findings support the existence of CS in patients with OVCFs, and this central hypersensitivity may be caused by dysfunction of endogenous pain facilitatory and inhibitory modulation.
As shown in Table 2, differences in local-area PPT were observed among the fracture groups, indicating the possible involvement of peripheral nociceptor sensitization in increased local pressure-pain sensitivity in patients with OVCFs. Increasing evidence demonstrates that local tissue trauma may cause the local accumulation of inflammatory mediators and then an increase in noxious stimuli of peripheral terminals of primary sensory neurons, thereby increasing local soft tissue sensitivity to pressure pain [17,18]. Once the active source of inflammatory mediators is reduced with healing, peripheral sensitization gradually disappears [17,18]. Therefore, the gradual improvement of local soft tissue and fracture trauma over time may cause a gradual increase in local-area PPT, which also explains the difference in LBP intensity and LBP-related disability among the fracture groups.
Unlike the local-area PPT, both TS and CPM gradually worsened as the disease progressed in patients with OVCFs before surgery, and similar conditions were also reported in a previous study [16]. According to previous studies, CS is a form of synaptic plasticity in the central nervous system, and this plasticity is always produced by repeated or sufficiently intense stimulation [17,18]. In contrast, in the absence of ongoing tissue injury, this state of heightened sensitivity returns to the normal baseline over time [17]. Therefore, persistent nociceptive input may be a key factor in CS development, and early intervention to reduce painful noxious stimuli may be beneficial for reducing the risk of CS development in patients with OVCFs.
In addition, preoperative-assessed TS in remote painfree areas was associated with RBP, suggesting that preoperative preexisting CS caused by abnormal endogenous pain regulation may be a possible risk factor for RBP after PVP. This possibility was further supported by the association between preoperative LBP at rest and RBP. In contrast to pain during movement, pain at rest was widely demonstrated to be linked to central hypersensitivity in previous studies [21,22]. Importantly, the significant incidence of RBP indicates that approximately one in 10 patients undergoing PVP will have RBP. Furthermore, a chronic moderate-severe LBP will develop in nearly one-third of these patients with RBP, and a significant difference in pain-related disability at the last postoperative follow-up was observed between the RBP and non-RBP groups. Therefore, the preoperative evaluation of CS by detecting both TS in remote pain-free areas and LBP at rest may have important clinical significance for doctors when they consider using PVP to treat patients with OVCFs.
Although both TS and CPM are feasible methods to evaluate CS, CPM was not associated with RBP, and different pathways of central pain modulation reflected by these two dynamic QST measurements may be one of the possible reasons. Furthermore, Irvine et al. demonstrated that nociceptive pain sensitization may mainly consist of two stages [23,24]. During the early stage of nociceptive stimulation, it is mainly manifested in the enhancement of pro-nociceptive serotonergic signaling, resulting in an imbalance of endogenous pain modulation that favors increasing pain facilitation, and descending pain inhibition may play a role in the late stage of nociceptive stimulation [23,24]. According to the definition of RBP in the present and previous studies [8,9], RBP may be more prone to postoperative acute or subacute pain than postoperative chronic pain. Recent studies have demonstrated that pain experienced during the postoperative acute stage increases the incidence of chronic pain [14,22], and acute pain has been demonstrated to be a better target for pharmacological intervention than chronic pain [14]. Therefore, effective relief of RBP may have important clinical significance in reducing the incidence of chronic pain after PVP.
These findings should be interpreted with caution because the mechanism leading to RBP remains unclear. Although this study indicated that CS caused by dysfunction of endogenous pain modulation systems may be related to RBP after PVP, both intravertebral vacuum cleft and posterior fascia edema were also demonstrated to be meaningful variables in predicting RBP, and previous studies reported similar results [8,9]. Therefore, inevitably other mechanisms related to RBP are present. Furthermore, a positive correlation was found between CS formation and disease duration in patients with OVCFs, and postoperative follow-up assessments demonstrated that CS reflected by abnormal dynamic QST measurements persisted in those with RBP at 6 months but resolved in those without RBP. These findings suggested that early PVP may be beneficial for improving the dysfunction of endogenous pain modulation in patients with symptomatic OVCFs, avoiding or reversing CS and preventing RBP. However, the optimal cutoff time to perform PVP was not identified in this study, which may be ascribed to the small sample size, particularly for patients with chronic OVCFs. Therefore, future studies with more cases may provide more significant results.
Conclusions
The findings of this study support the existence of CS in patients with OVCFs, and this augmented central pain processing may be caused by endogenous central pain facilitatory and inhibitory dysfunction. Moreover, preexisting CS in patients with OVCFs may be involved in the pathophysiological process of RBP after PVP. Preoperative assessments of dynamic QST, particularly TS, in remote pain-free areas may provide additional information for identifying patients who may be at risk for RBP development, which may be beneficial for the preoperative stratification of patients and identification of appropriate treatment to prevent this complication.
Notes
Conflict of Interest
No potential conflict of interest relevant to this article was reported.
Funding
Financial support from the Shanghai “Science and Technology Innovation Action Plan” Project (22s31900600) is gratefully acknowledged.
Author Contributions
Conceptualization: ZCJ, JJY. Data curation: CKW. Methodology: GT. Project administration: ZY. Writing–original draff: CKW, GT. Writing–review & editing: ZY, LFZ. Final approval of the manuscript: all authors.
Supplementary Materials
Supplementary materials can be available from https://doi.org/10.31616/asj.2023.0429.
Supplement 1.
The correlation between the preoperative disease duration and the measurements of quantitative sensory testing assessments in patients with osteoporotic vertebral compression fractures.
Supplement 2.
Comparison of the measurements of quantitative sensory testing assessments before and 6 months after operation in both residual back pain (RBP) and non-RBP patient groups.