

Introduction
Joints between vertebrae are reinforced and supported by numerous ligaments; one of them is the ligamentum flavum (LF). Ligamenta flava are attached to the front of the upper lamina above and to the back of the lower lamina below [1]. As they are connective tissue, they affect the intrinsic stability of the spine, control intervertebral movement, and maintain a smooth surface of the posterior dural sac [2]. Degeneration of the lumbar LF can cause lumbar spinal stenosis and root pain [3]. The LF thickening is considered an important cause of radiculopathy in lumbar degenerative disease [4]. Low back pain resulting from degenerative disease of the lumbosacral spine is a major cause of morbidity, disability, and lost productivity. With the increasing longevity of our population and the resulting increasing proportion of middle-aged and elderly persons, the problem of lumbosacral pain is becoming a significant health care issue. Due to the slow progression of the disease, the diagnosis may be significantly delayed. Given the potentially devastating effects of this condition, rapid diagnosis and treatment are essential for positive outcomesl [5].
An increase in the size of the ligament, a posterior protrusion of the disc, or a combination of the two, serves to compress the nerve root. Enlargement of the ligament may be generalized, although sometimes it is unilateral, and it probably results from two factors; injury and scar tissue. Normal ligaments are composed entirely of yellow elastic fibers and grossly have considerable elasticity. It seems likely that at the time of the injury, whether minor or severe, rupture of some of the elastic fibers of the ligamenta flava occurs, allowing them some degree of expansion. Subsequently, as repair takes place, scar tissue is formed with further enlargement of the ligaments, resulting in compression of the nerve roots [6].
Considering this fact, we studied the LF on each side at each spinal level. It is presumed that the ligaments may undergo unilateral hyperplastic changes and become so thick that they encroach on the spinal canal, thereby compressing the spinal cord. This hyperplasia presumably is possible at any level, but previous studies [2,7,8,9,10,11,12,13] show the lesion is mainly limited to the ligaments connecting the lower lumbar vertebrae. Although anatomic and radiologic literature on this topic is available, measurements of thickness of LF and its detailed comparison on either side is still not well studied. This study is aimed to provide details of LF thickness on either side at spinal levels of L3-L4, L4-L5, and L5-S1 and its correlation with age. This study is an attempt to determine the correlation between LF thickening and increasing age.
Materials and Methods
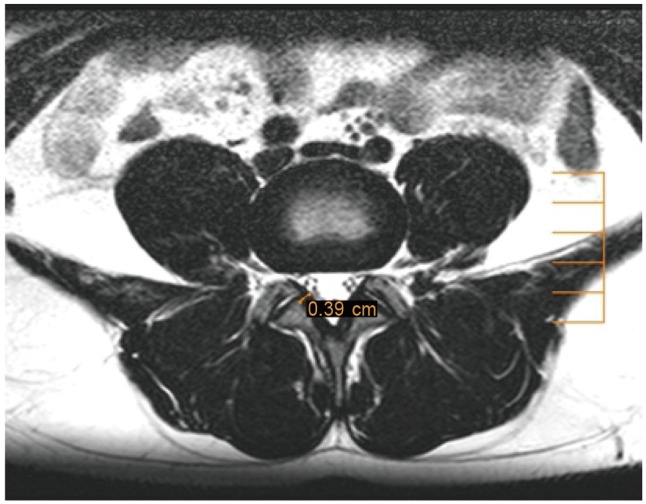
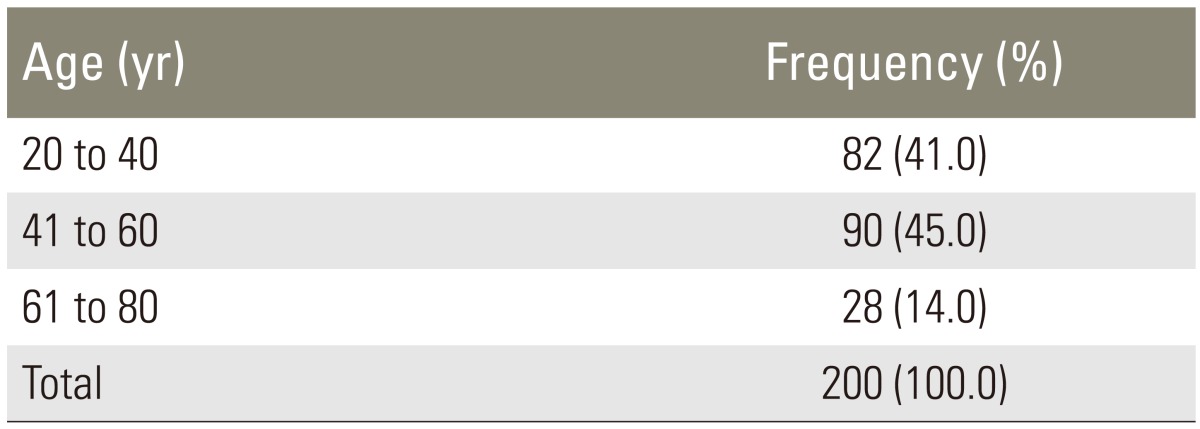
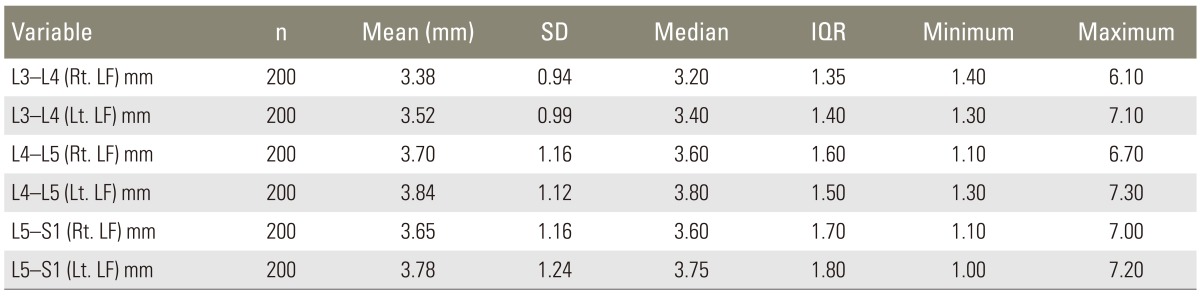
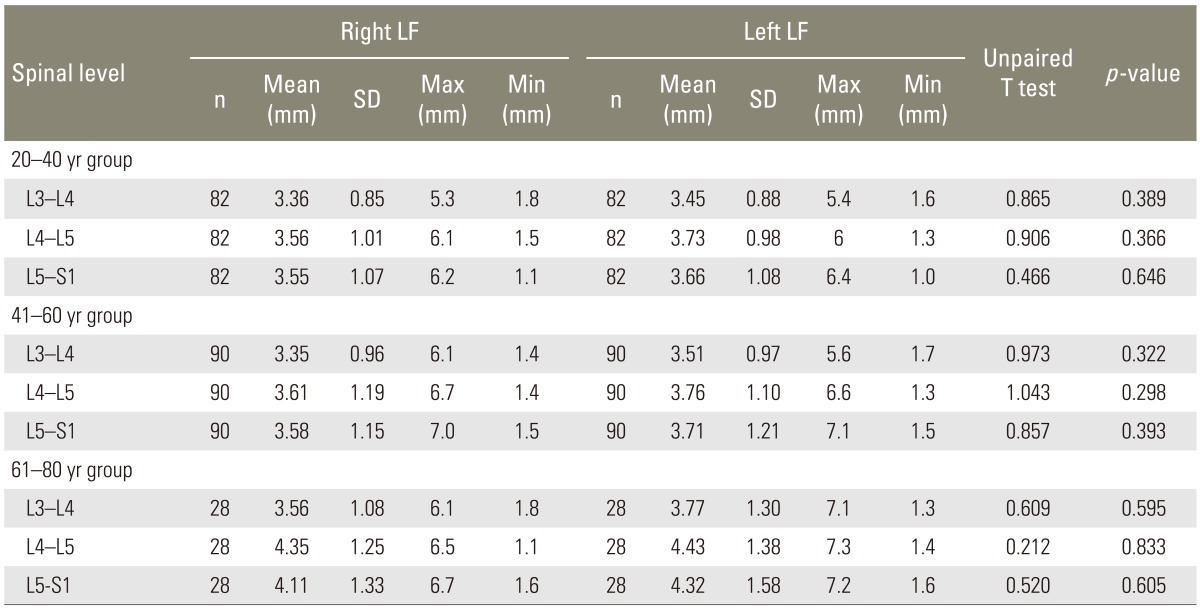
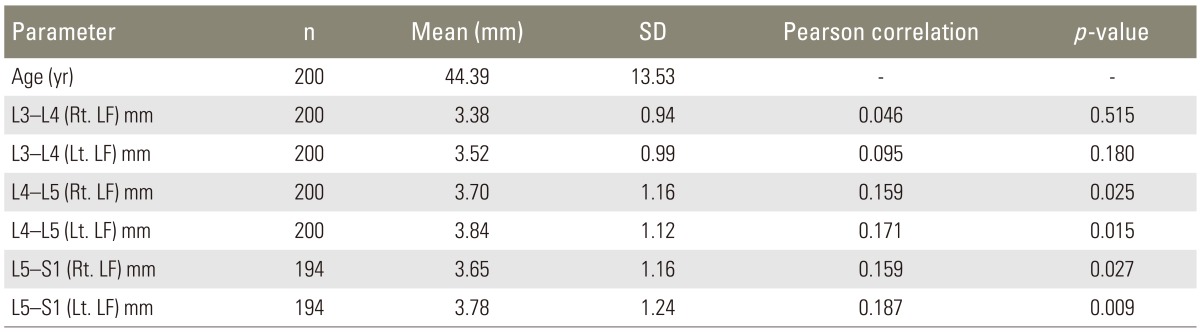
Institutional Review Board approval was granted prior to the start of the study. It was a 12-month, retrospective study, anyalyzing the spinal magnetic resonance imaging (MRIs) of 200 adult individuals with low back pain from 20-80 years old (Table 1). Data was divided into three groups according to the patients' ages: 20-40, 41-60, and 61-80 years. Individuals younger than 20 years or older than 80 years of age, patients with a history of previous lumbar surgery or radiotherapy, patients with congenital anomalies, scoliosis, spondylolisthesis and patients with cardiac pacemakers, aneurysms, clips and metallic implants and joint replacements were excluded. MRIs of the whole spine of the included patients were performed on a PHILIPS MR ACHIEVA (1.5T). In each patient, the MRI was performed in the sagittal and axial plane. The mobi view was used to count the number of vertebrae. Cases with lumbarization or sacralization were marked separately. T2-weighted sagittal images were used to locate the spinal level of intervertebral spaces and after confirmation, measurements of the LF thickness were made on the T2-weighted axial images at the L3-L4, L4-L5, and L5-S1 spinal levels. The measurements were done with the help of Dicom works software installed on the computer (Fig. 1). The maximum thickness of the LF was measured on both the right and left sides at spinal levels L3-L4, L4-L5, and L5-S1 (Table 2). To minimize error, the average of three readings was taken. All the measurements were confirmed by a radiologist. A comparison of the right and left LF between different age groups was performed with an unpaired t test and chi-square test as per the normality test (Table 3). The Pearson correlation was used to determine the correlation between thickened LF and age (Table 4). A p-value of less than 0.05 was considered to indicate a statistically significant difference.
Discussion
The findings of the present study are in concordance with previous studies that suggested the LF thickness is an age-dependent phenomenon (Tables 5,6,7,8). Significant changes in LF thickness were witnessed at the L4-L5 and L5-S1 spinal levels as age increased.
Okuda et al. [4] and Altinkaya et al. [13] found that increasing patient age had a correlation with LF thickness at the L4-L5 level. Twomey and Taylor [14] also determined that the LF showed a 50% increase in thickness with aging.
However, Safak et al. [2] and Fukuyama et al. [15] found no association with age. Safak et al. [2] suggested that mechanical stress and degeneration seemed to be more important factors in LF hypertrophy than age and gender.
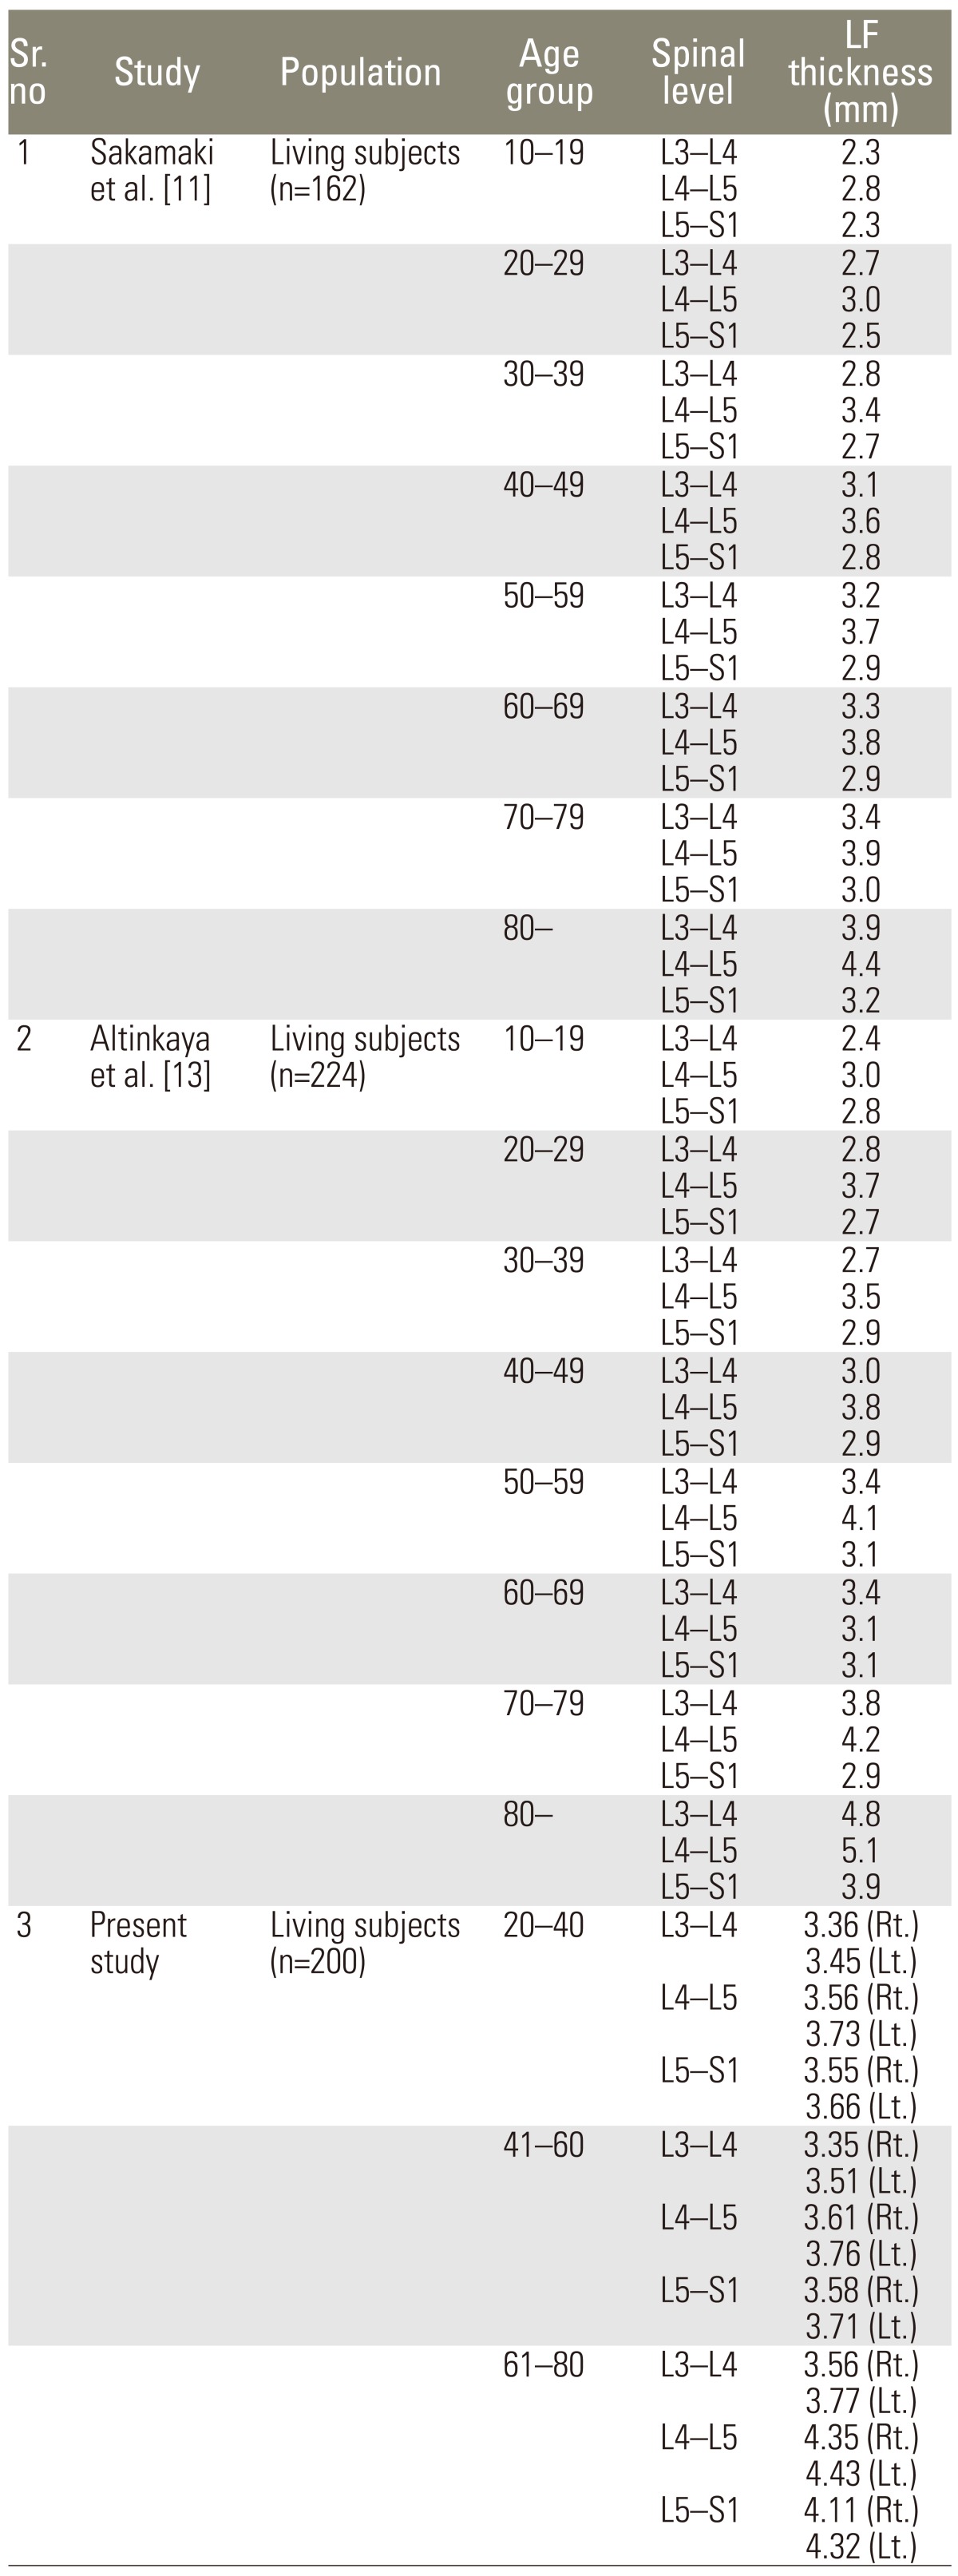
Sakamaki et al. [11] found that the thickness of LF at the L4-5 spinal level was over 3.0 mm in patients in the 20-29 age bracket, and, in many of them it was more, than 3.5 mm. He suggested that thickened LF in a patients as young as 30 years shows that, in spite of it being an age-dependant entity, thickened LF can be seen in younger age groups. Sairyo et al. [10] also found that significant changes in LF thickness can be seen in the 20-30 year-old age bracket. Abbas et al. [12] found 22 individuals under the age of 30 (4.5% to 13.6%, depending on vertebral level) manifested LF thicknesses greater than 4 mm.
The present study too is in close agreement with Sakamaki et al. [11] and Abbas et al. [12], where the thickness of the LF at the L4/5 and L5/S1 spinal levels significantly increased with age, and thickened LF (>4 mm) was observed in many young subjects (20-40 years of age group). Even though the prevalence was not calculated, its presence suggests the role of mechanical stress (as opined by Safak et al. [2]), in the increased thickness in the young adult population.
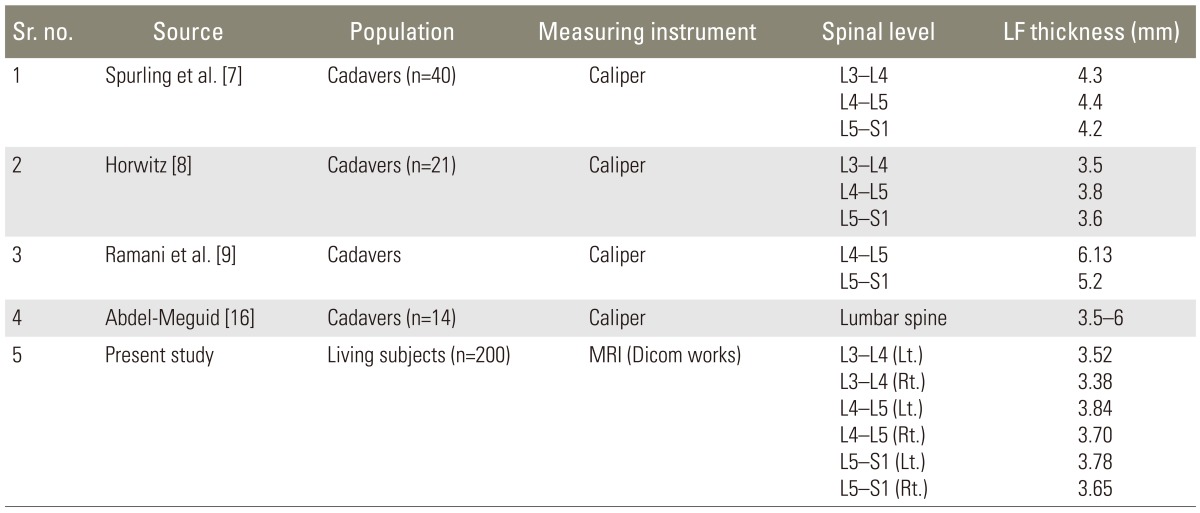
The findings of the present study are consistent with other studies [8,16] that reported the thickness of LF was found to be greatest at the L4-L5 spinal level (Table 2). The mean of thickness in most of the studies ranges from 3.5 to 4.5 mm, which is similar to the values of the present study (L3-L4: left, 3.52 mm, right, 3.38 mm; L4-L5: left, 3.84 mm, right, 3.70 mm; L5-S1: left, 3.78 mm, right, 3.65 mm).
The thickness of LF in the present study also closely resemble the results of a study conducted by Horwitz [8] (L3-L4=3.5 mm, L4-L5=3.8 mm, L5-S1=3.6 mm). He studied the thickness of LF along with the dimensions of the intervertebral foramina and the degenerative changes in related joints. He found that apparent forward bulging of the LF, which constricted the intervertebral foramen, was due to advanced marginal proliferation of the apophyseal joints and not due to hypertrophy of the overlying LF. However, it was a cadaveric study, so confirmation of his findings in living subjects is beyond the scope of our study a further detailed radiologic study for the other degenerative changes occurring in the spine is needed.
However, Ramani et al. [9] reported much higher values: up to 6.13 mm. They explained their findings by saying that they were probably due to the connection of a hypertrophied ligament to a prolapsed disc. A study performed by Spurling et al. [7] obtained results slightly higher than the other studies, suggesting that low back pain with neurologic signs of compression of the cauda equina may be caused by hypertrophied LF. However, since the present study is retrospective, data regarding the clinical history pertaining to neurological signs is not available. Hence, it may be postulated that the LF was not thickened to the extent where it would produce these signs.
Another reason for the discrepancy may be that the studies may have been conducted in elderly patients, where the mean thickness was higher due to age-related changes. Since our study included patients as young as 20 year, the overall mean values were lower.
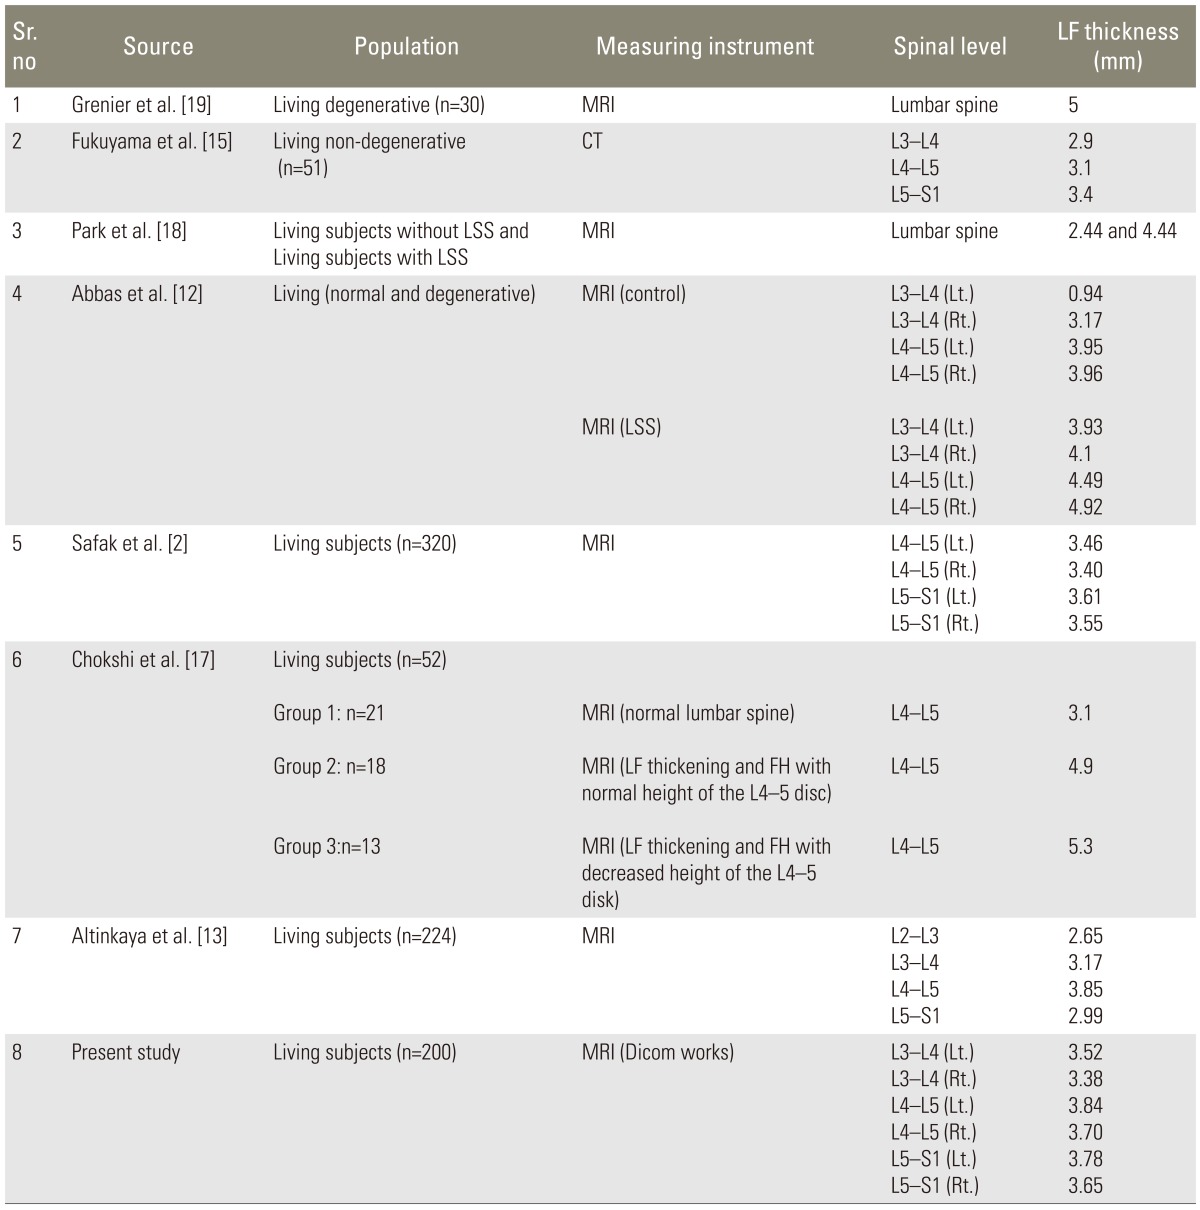
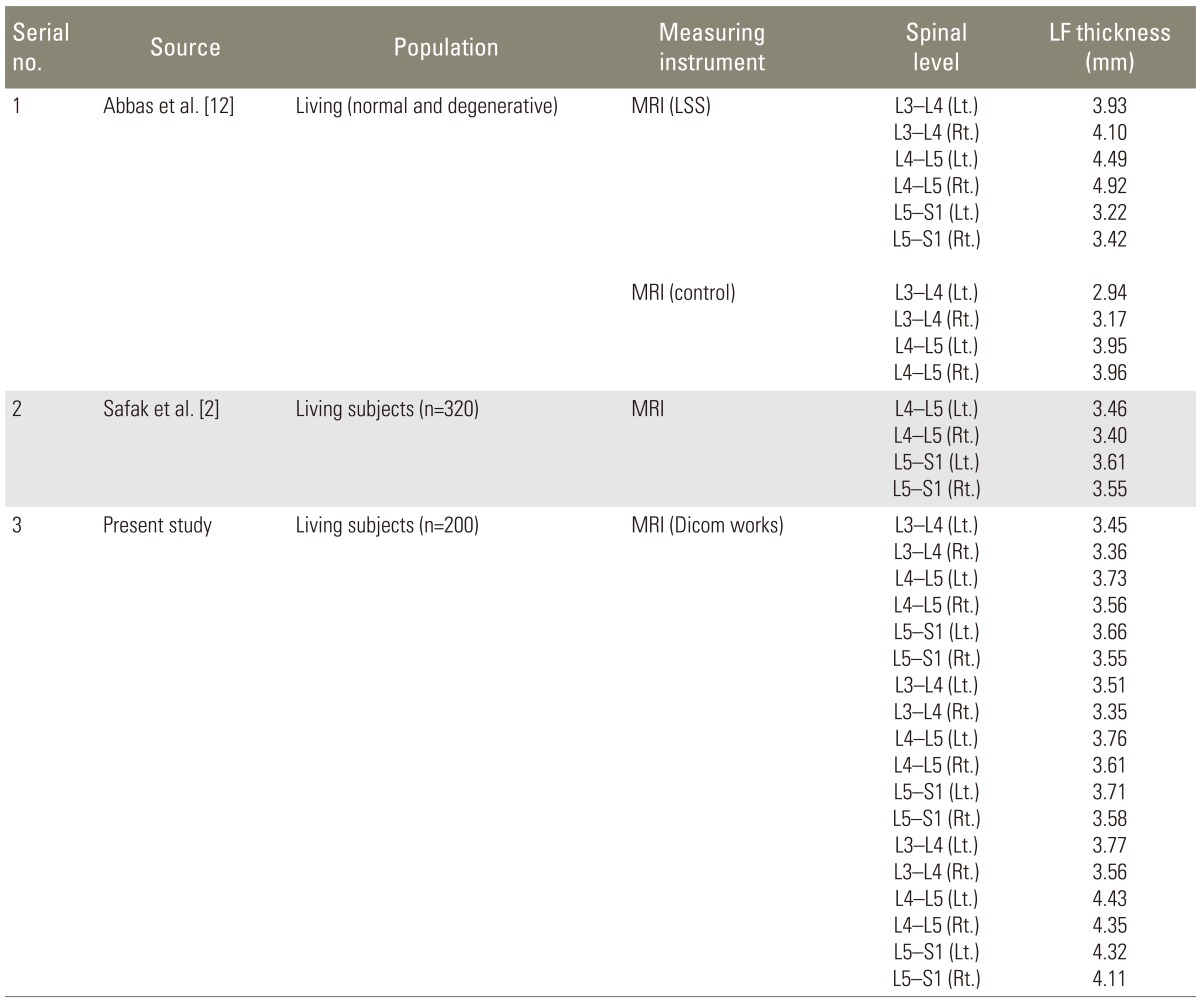
In comparison of the present study with others (Table 3) conducted in living subjects using CT or MRI, the mean thickness at the L4-L5 level (right, 3.7 mm; left, 3.84 mm) is in close agreement with studies by Altinkaya et al. [13] (3.85 mm), Safak et al. [2] (right, 3.40 mm; left, 3.46 mm) and Abbas et al. [12] (right, 3.96 mm; left, 3.90 mm).
Chokshi et al. [17] mentioned that the normal thickness of the LF was 3.1 mm. They classified their subjects in three groups depending on the degenerative changes involved; however, they found greater thicknesses (mean thickness was 4.09-5.03 mm) in patients having degenerative changes. Similar findings were reported by Park et al. [18] (mean thickness was 4.44 mm) and Grenier et al. [19] (5 mm), who studied MRIs of lumbar spines showing the presence of degenerative changes. Other authors, such as Fukuyama et al. [15] also stated that the ligament was thicker in the degenerative group (4.0┬▒1.1 mm vs. 3.0┬▒0.7 mm, p<0.01). This also supports the findings of cadaveric studies where the LF thickness was found to be more in the presence of other degenerative changes.
The spinal level at which the maximum thickness of LF was found, was also the same in living and cadaveric studies. In most of these studies (Abbas et al. [12] and Altinkaya et al. [13]) the thickness of the LF varied at different spinal levels, attaining a maximum thickness at the L4-L5 level, followed by the L3-L4, and then the L5-S1 levels.
In the present study; however, the maximum thickness was at the L4-L5 level, but the subsequent order was L5-S1 and then L3-L4. Other studies conducted by Fukuyama et al. [15] and Safak et al. [2] reported the maximum thickness to be at level L5-S1.
Abbas et al. [12] and Altinkaya et al. [13] have found that the LF thickness was significantly greater at the L4-L5 level and then the L3-L4 level in subjects with spinal stenosis. In contrast, at L5-S1 level, no significant difference was seen between patients with spinal stenosis and those without spinal stenosis. They explained this phenomenon by attributing it to the relative hypermobility of these two segments compared with the L5-S1 segment, which is stabilized by illio-lumbar ligaments and the large transverse process of the L5 vertebra. In addition, the articular facets of S1 are more coronally oriented, acting to decrease the shearing stress in that segment.
Fukuyama et al. [15] and Safak et al. [2] have found that the LF thickness at the L5-S1 level is significantly greater than that at the L4-L5 level. Safak et al. [2] explained his finding by saying that the increased thickness at the L5-S1 level was attributable to the greater mechanical stress at this level. This may explain the thickening found at this level, which is greater than at the L3-L4 level. We had a similar finding in our study.
Very few studies have compared the thickness of LF of both sides (Table 4).
Chokshi et al. [17] did not find any uniformity in side dominance, but he found that patients with asymmetric LF thickness showed a greater LF thickness on the side with greater facet hypertrophy.
Abbas et al. [12] (right>left) and Safak et al. [2] (left>right) compared the thicknesses of the LF on each side; however, their results were not in concurrence with each other.
Abbas et al. [12] found a significant thickening of the LF on the right side at the L3-L4 and L5-S1 levels. They explained that it could be attributed to the right thoracic built-in rotation in non-scoliosis spine at the mid and lower thoracic vertebrae. They assumed that there would be a compensatory rotation to the left of the lumbar spine that increases the tension forces in the right spine complex, LF included, leading, in time, to a greater thickening of the right LF.
Safak et al. [2] stated that the difference in LF thickness was significant between contralateral sides at the same level, finding the LF to be thicker on the left side. It was stated in the literature that the asymmetry reflects the magnitude of developmental instability/stability in an organism, which is the appearance of, or predisposition to, deviations from normal ontogeny. He suggested that the asymmetrical mechanical stress that the LF bears during a lifetime may lead to the asymmetrical thickening. This asymmetry is also suggested to be the result of the individual's side preference.
In the present study, the left LF was found to be thicker than right one at each spinal level surveyed. However, this difference was not statistically significant. This finding also supports the role of the degree of asymmetry and instability. The asymmetry and instability may not have been strong enough to produce a statistically significant difference between the two sides.
This study suggests an absence of any side dominance.
Conclusions
The LF suggests absence of any side dominance; however, it tends to thicken with increasing age. Statistically significant increases in thickness were observed at the L4-L5 and L5-S1 spinal levels. We also found that the thickening of the LF is an age-dependent degenerative change. However, several subjects in the younger age group (20-40) showed a thickness of >4 mm.