


Introduction
Many ligaments have a major role in reinforcement and mechanical support of the joints between vertebrae; one of them is the ligamentum flavum (LF). LF or yellow ligament is a ligament of the spine that connects the laminae of adjacent vertebrae from the C2 vertebra to the first segment of the sacrum. LF contains longitudinally arranged connective tissue fibers that are predominantly elastic in nature. These ligaments extend from the anterior/inferior aspect of the lamina above a disc space to the posterior/superior aspect of the lamina below the disc space [1].
Degeneration with thickening and calcification of LF can cause foraminal narrowing, spinal canal stenosis, and nerve root compression at the lumbar level [2]. LF thickening is an important cause of radiculopathy in lumbar degenerative disease. Back pain has become a significant healthcare concern in middle-aged and elderly individuals. It affects the quality of life significantly and usually is diagnosed late due to its indolent course. Hence, early diagnosis and initiation of treatment can improve the patient's outcome [3].
Either an increase in LF thickness or a posterior disc protrusion may cause spinal canal stenosis and compression of the nerve roots. The mechanism of LF thickening remains controversial. Thickening and hypertrophy of the ligament probably results from injury. Normally, LF comprises yellow elastic fibers, which are responsible for its elasticity [4]. LF is the main apposition to flexion loading of the spine, and it can be injured with excessive spinal flexion. Unfortunately, there is little or no regenerative capacity in the elastic tissue of LF; thus, it is replaced by a dense connective tissue cicatrix. This repair mechanism with scar tissue formation and with further enlargement of the ligament may result in compression of the nerve roots [5].
Most studies investigating LF thickness have examined and assessed the lumbar region. Few studies and data in the literature pertain to changes in LF thickness at the dorsal levels.
We aimed to provide details of LF thickness at the dorsal spinal levels and determine its relationship with age, sex, and sides.
Materials and Methods
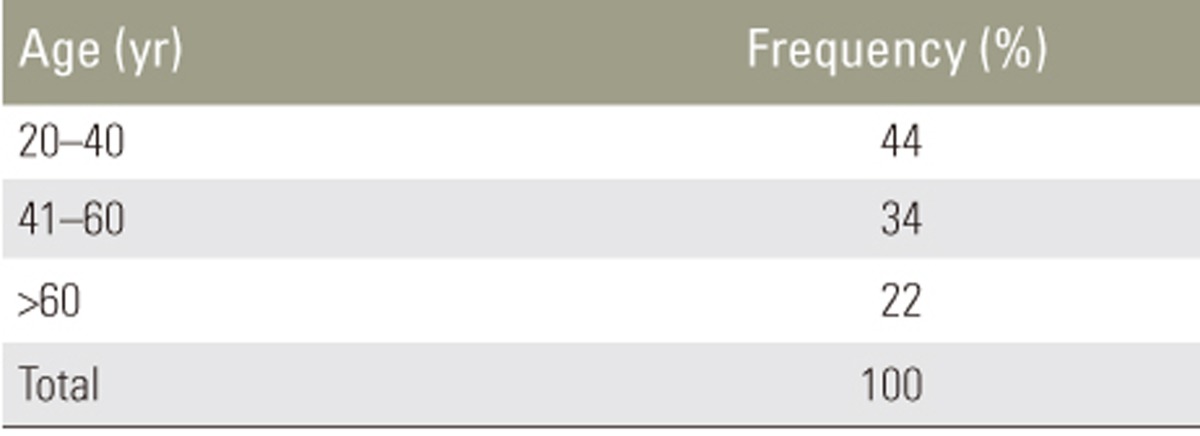
Institutional Ethical Committee approval was obtained (Reg. no-Ecr/131/inst/TN/2013) before the start of this 2-year (June 2015ŌĆō2017) retrospective study of 100 patients (58 males, 42 females; age >20 years) who presented for complaints other than back pain. We divided the patients into three groups based on age: 20 to 40, 41 to 60, and >60 years (Table 1). Patients aged <20 years or with severe degenerative disc disease, history of previous spine surgery and radiotherapy, congenital abnormality, spinal deformities, pacemakers, metallic implants, and joint replacements were excluded. LF thickness was measured by a radiologist experienced in spine magnetic resonance imaging (MRI).
1. Magnetic resonance imaging protocol
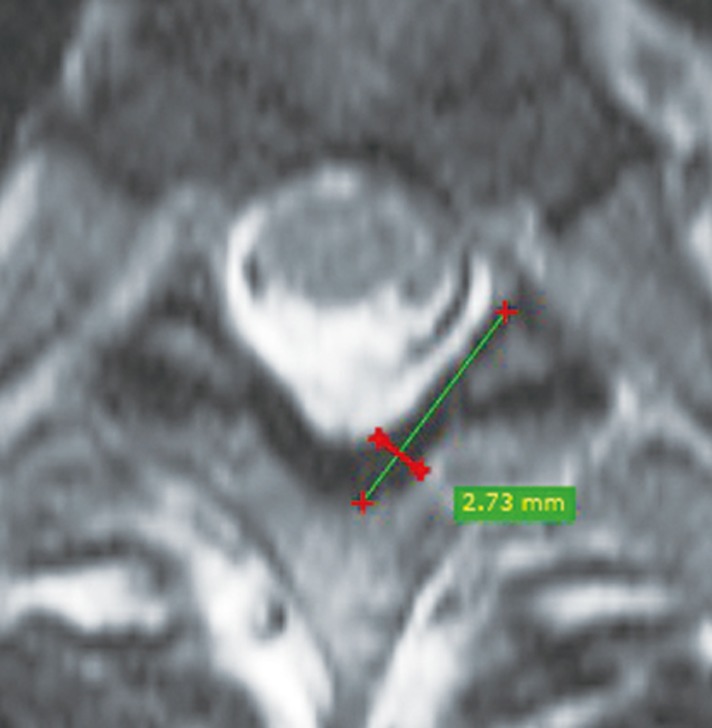
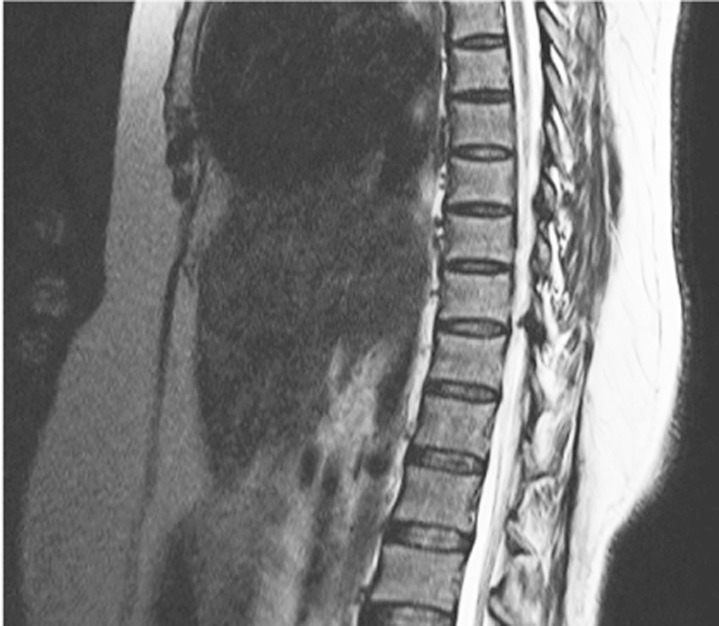
Imaging was performed on a 48-channel SIEMENS AERA system 1.5T (Siemens Medical Solutions, Erlangen, Germany) with the standard protocol. In every patient, MRI of the whole spine was performed in the axial and sagittal planes as per our institutional protocol. A mid sagittal T2-weighted image (T2WI) of the whole spine was used to count the spinal level of intervertebral spaces, after which the LF thickness was measured on axial T2WIs at dorsal spinal levels, at the mid-disc level perpendicular to the lamina border, either at half the length of LF or at maximum thickness, whichever was greater (Fig. 1). Increased LF thickening at the T10ŌĆōT11 level is shown in Fig. 2.
The mean LF thickness in three age groups (20 to 40, 41 to 60, and >60 years) was analyzed in relation to sides and sex. Mean values of LF thickness were analyzed for the entire dorsal levels.
2. Data analysis
Descriptive statistics were analyzed for all data, and suitable statistical tests of comparison were performed. Continuous variables were analyzed with the unpaired t-test and one-way analysis of variance. Correlation analysis was done using Pearson's r correlation. Statistical significance was set at p<0.05. The data were analyzed using SPSS ver. 16.0 software package (SPSS Inc., Chicago, IL, USA)
Results
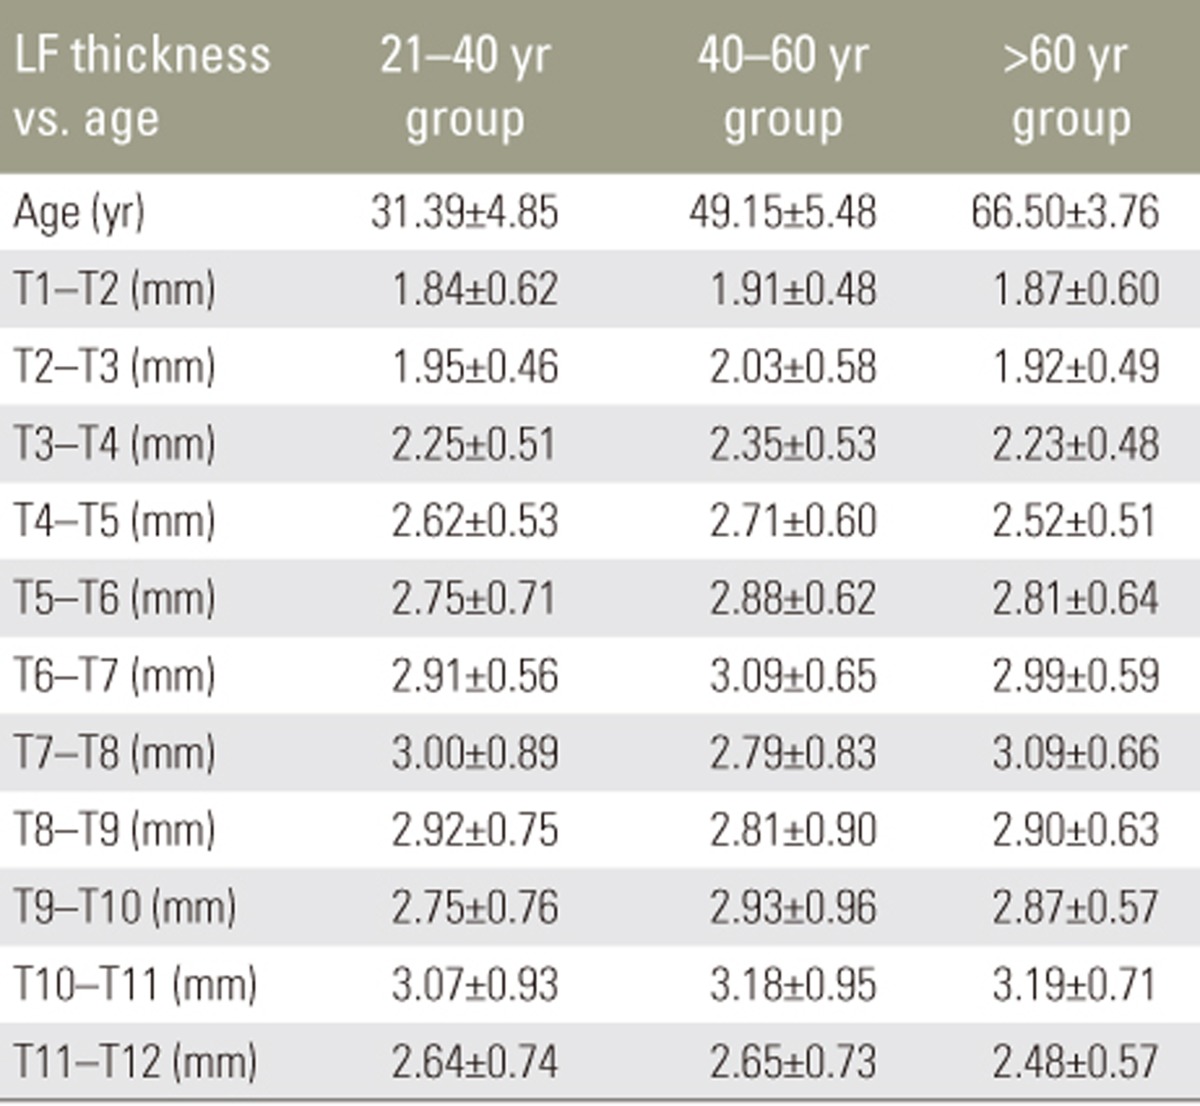
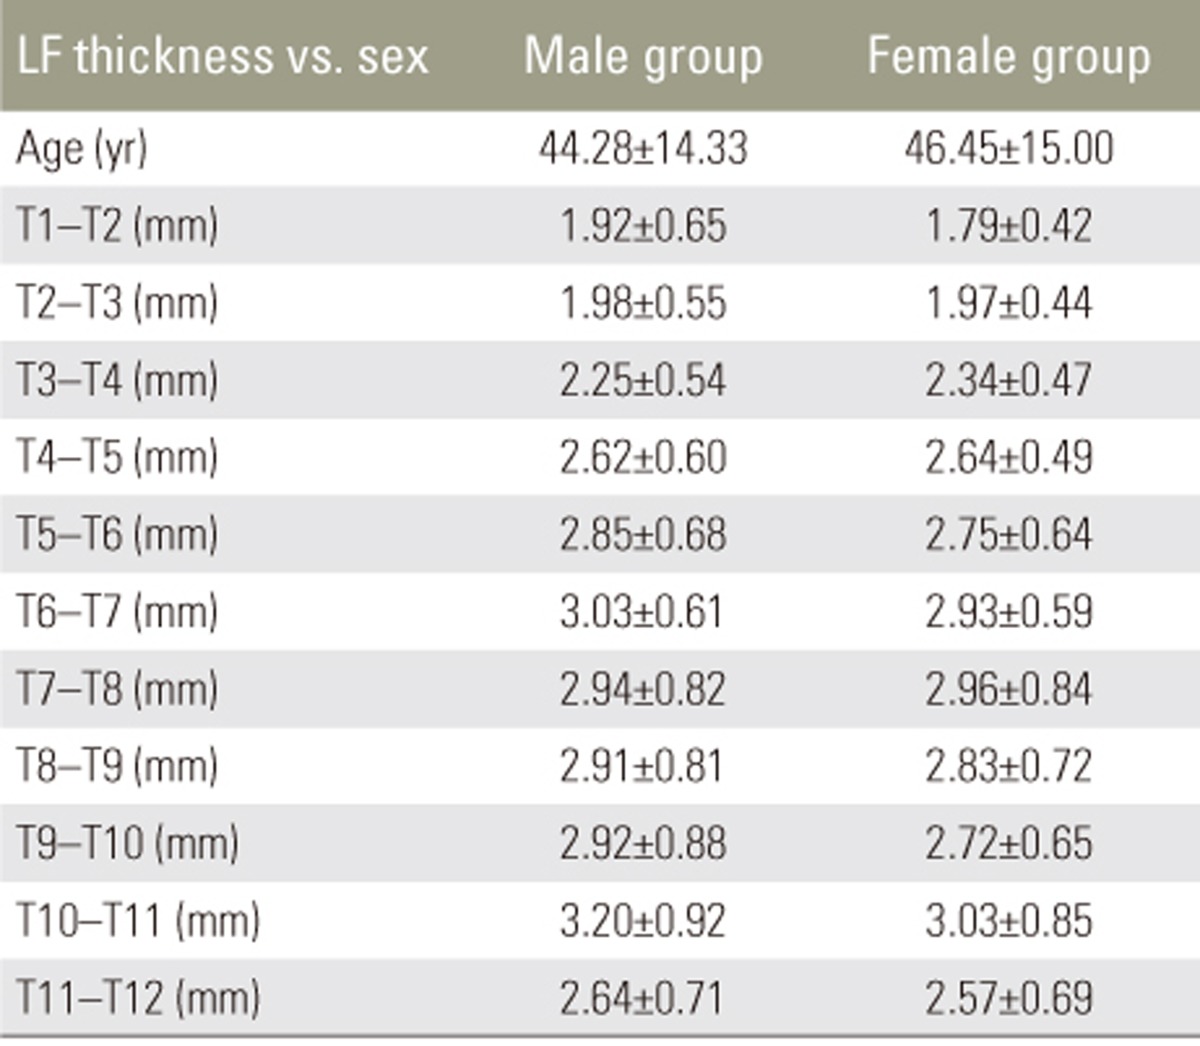
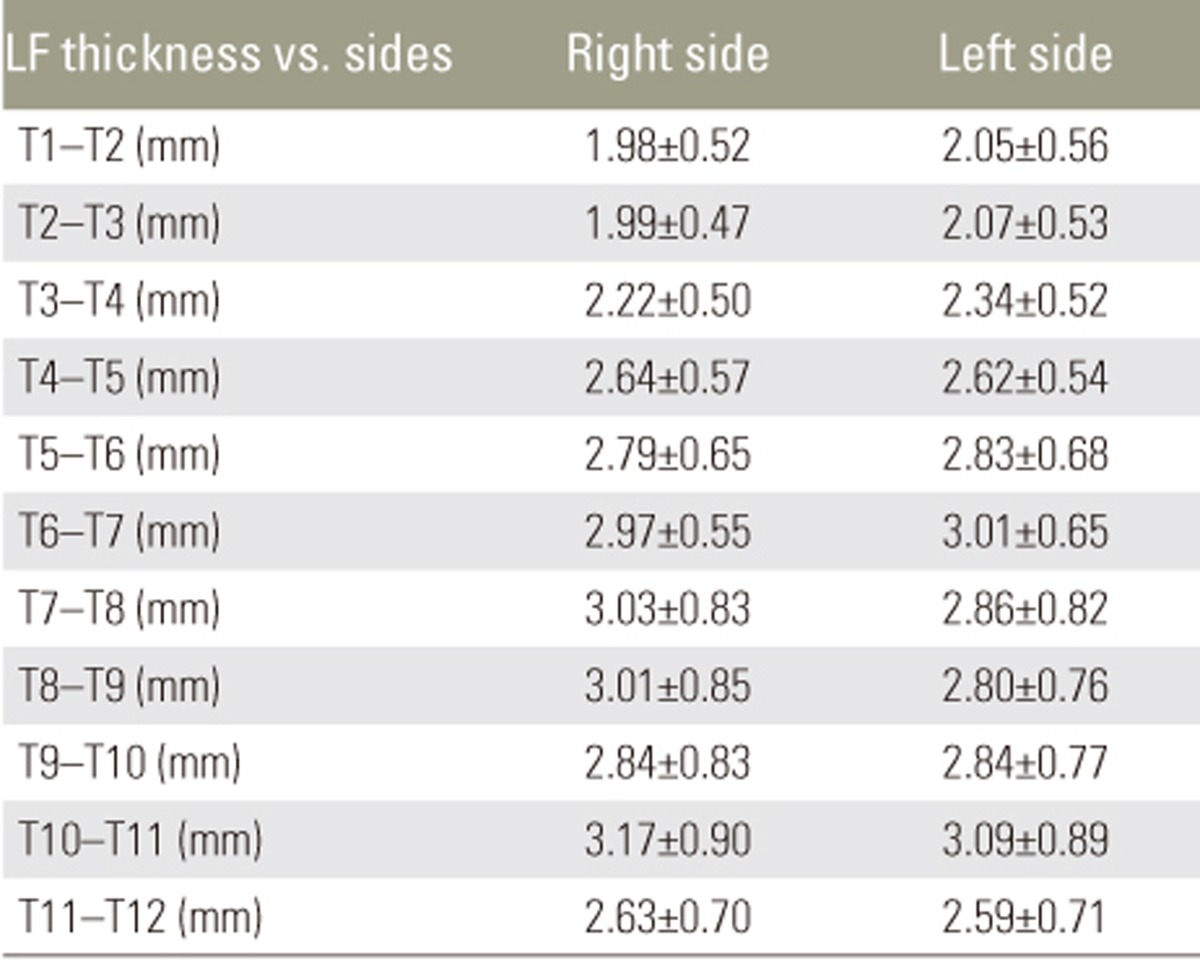
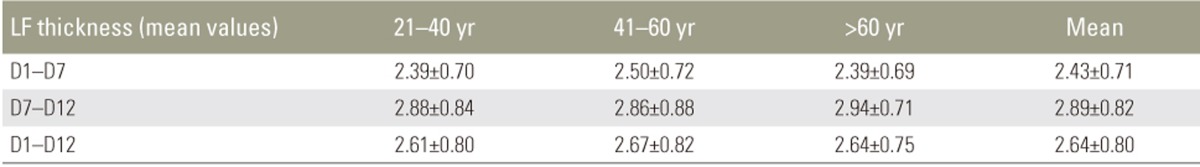
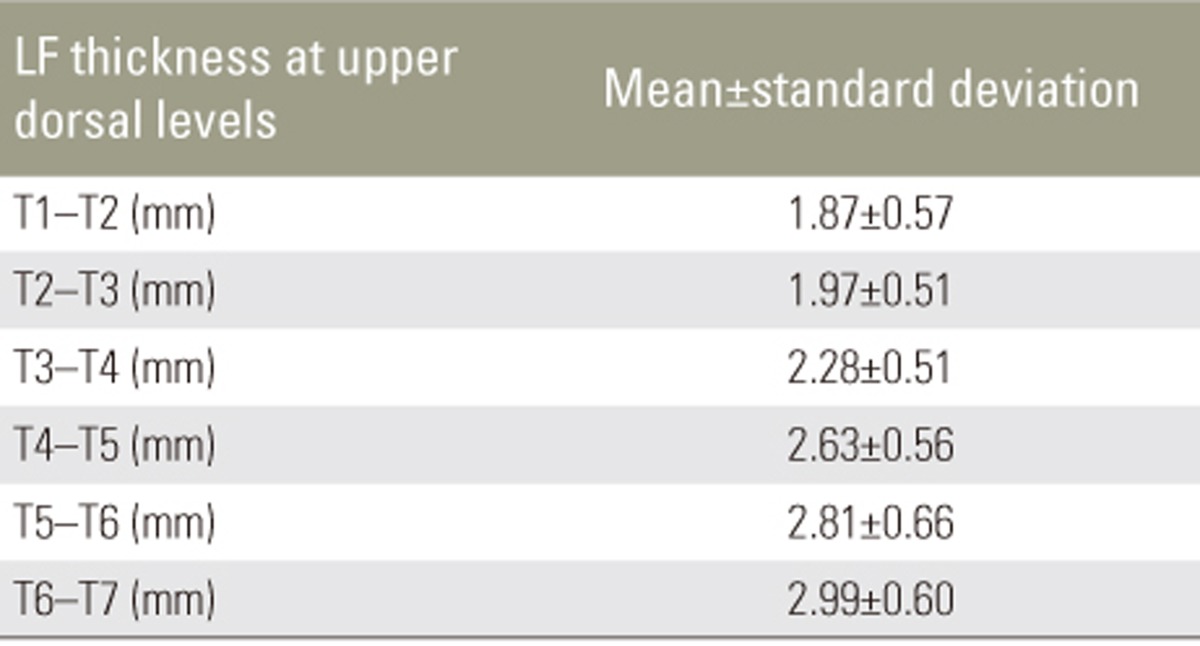
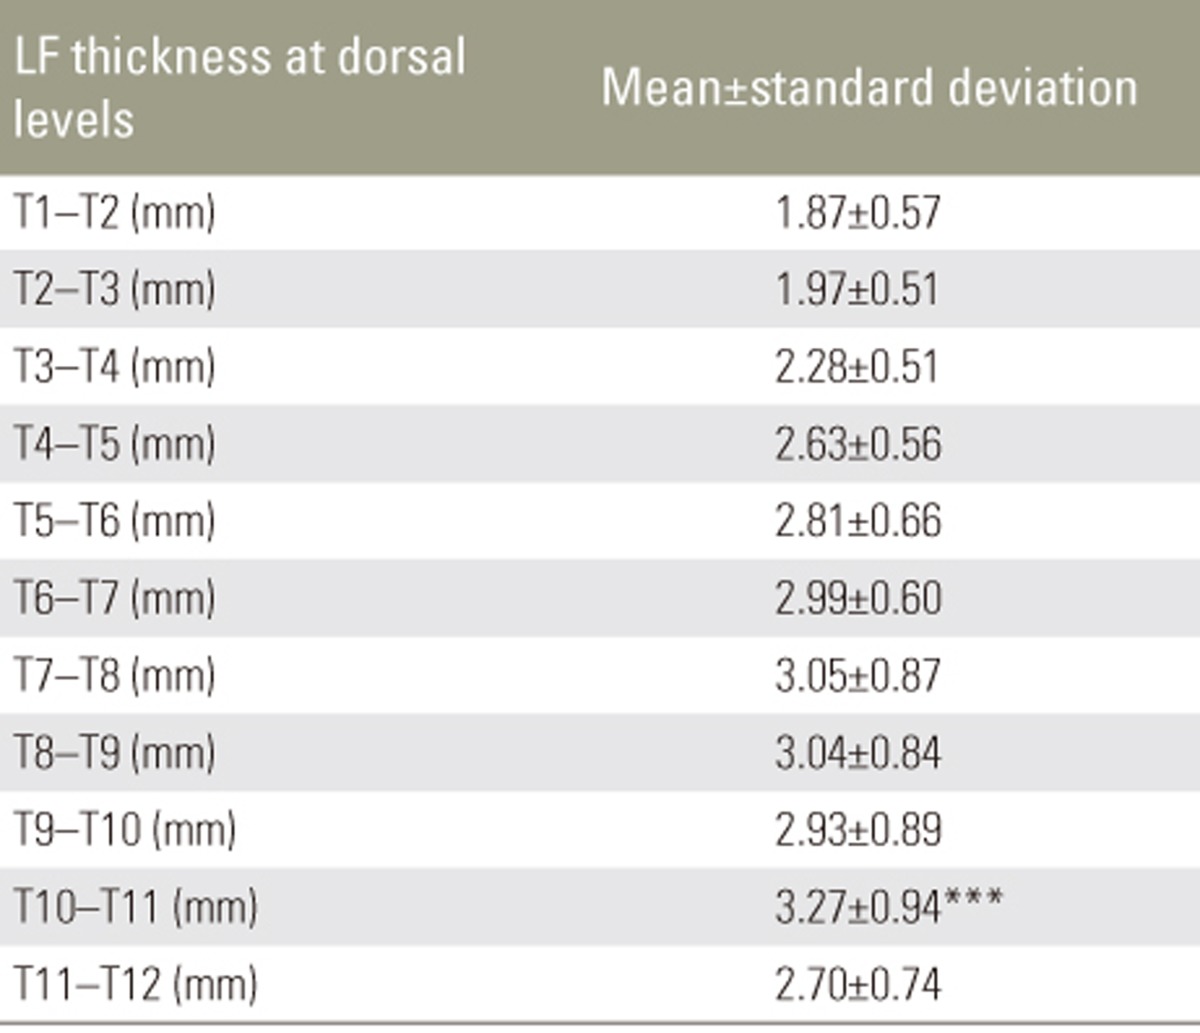
Mean LF thickness from T1 to T12 in different age groups is shown in Table 2. There was no significant increase in LF thickness with respect to age. Pearson's correlation revealed no correlation between LF thickness and age (Table 3). There was no significant difference in mean LF thickness between male and female sexes (Table 4) and between the two sides (Table 5). Mean LF thickness at the upper, lower, and entire dorsal levels separately in different age groups was analyzed (Table 6), and there was no significant thickening at any of the upper dorsal levels (T1ŌĆōT7) (Table 7). However, analysis of mean LF thickness for the entire dorsal levels showed a significant increase (p<0.001) at the T10ŌĆōT11 level (3.27┬▒0.94 mm) (Table 8).
Discussion
Many investigators have studied LF thickness at dorsal levels in patients with compressive myelopathy. However, there is a dearth of literature pertaining to the study of dorsal LF thickness in patients without myelopathy. Many hypotheses explain LF thickening, including age-related changes and the gradual replacement of elastin fibers in the ligaments with collagen [6]. Chokshi et al. [7] reported that degenerative diseases caused asymmetrical LF thickening, and Safak et al. [8] found no association between LF thickness and sex or age. We found that LF thickening in the dorsal spine has no correlation with age, and it does not increase with increasing age. There was no significant disparity in LF thickness between the two sides and between male and female sexes.
Among upper thoracic levels from T1 to T6, there was no significant increase in LF thickness at any specific level. However, at lower dorsal levels, there was a significant increase in LF thickness at the T10ŌĆōT11 level. We presume that this may be due to maximum tensile strength at this level [9]. The lower dorsal spine has greater mobility in flexion and extension [10]. One reason why ossification of LF develops more frequently in East Asia is considered to be due to the more frequent squatting position adopted by members of those populations [11]. The predilection sites for ossification of LF in patients with thoracic myelopathy are the lower, high, and mid-thoracic areas in order of frequency. The most frequent site is T10ŌĆōT11, and it is presumed that this is because these segments receive the maximum tensile force [11].
Calcification and ossification of LF, a frequent cause of compressive myelopathy, mainly affect the lower thoracic levels of the spinal cord, causing progressive spastic paraplegia [12]. Hirabayashi et al. [13] and Park et al. [14] also found that ossification of LF overlying the lower thoracic spine frequently produces myelopathy and the most frequent site of ossification is the T10ŌĆōT11 level. Because there is increased tendency of LF thickening at the T10ŌĆōT11 level, this may be used as a reference point for counting the vertebral levels.
Conclusions
LF thickness does not increase with increasing age, and it does not appear to have any side/sex dominance. LF thickening has a predominant tendency to occur specifically at the T10ŌĆō11 level, which may be due to maximum tensile strength at this level. Hence, LF thickening at the T10ŌĆōT11 level may be used as a reference point for counting the vertebral levels.
Our study has certain limitations. It did not include patients with compressive myelopathy, and we did not study dorsal spinal LF thickening with respect to disc space narrowing and facet hypertrophy. Low sample size may have influenced the results. Future studies could include assessment of dorsal spinal LF thickness in relation to degenerative disc disease.