The Impact of Preoperative Myelopathy on Postoperative Outcomes among Anterior Cervical Discectomy and Fusion Procedures in the Nonelderly Adult Population: A Propensity-Score Matched Study
Article information

Abstract
Study Design
Retrospective cohort study.
Purpose:
Anterior cervical discectomy and fusion (ACDF) is a common surgical intervention for patients diagnosed with cervical degenerative diseases with or without myelopathy. A thorough understanding of outcomes in patients with and without myelopathy undergoing ACDF is required because of the widespread utilization of ACDF for these indications.
Overview of Literature
Non-ACDF approaches achieved inferior outcomes in certain myelopathic cases. Studies have compared patient outcomes across procedures, but few have compared outcomes concerning myelopathic versus nonmyelopathic cohorts.
Methods:
The MarketScan database was queried from 2007 to 2016 to identify adult patients who were ≤65 years old, and underwent ACDF using the international classification of diseases 9th version and current procedural terminology codes. Nearest neighbor propensity-score matching was employed to balance patient demographics and operative characteristics between myelopathic and nonmyelopathic cohorts.
Results:
Of 107,480 patients who met the inclusion criteria, 29,152 (27.1%) were diagnosed with myelopathy. At baseline, the median age of patients with myelopathy was higher (52 years vs. 50 years, p<0.001), and they had a higher comorbidity burden (mean Charlson comorbidity index, 1.92 vs. 1.58; p<0.001) than patients without myelopathy. Patients with myelopathy were more likely to undergo surgical revision at 2 years (odds ratio [OR], 1.63; 95% confidence interval [CI], 1.54–1.73) or are readmitted within 90 days (OR, 1.27; 95% CI, 1.20–1.34). After patient cohorts were matched, patients with myelopathy remained at elevated risk for reoperation at 2 years (OR, 1.55; 95% CI, 1.44–1.67) and postoperative dysphagia (2.78% vs. 1.68%, p<0.001) compared to patients without myelopathy.
Conclusions:
We found inferior postoperative outcomes at baseline for patients with myelopathy undergoing ACDF compared to patients without myelopathy. Patients with myelopathy remained at significantly greater risk for reoperation and readmission after balancing potential confounding variables across cohorts, and these differences in outcomes were largely driven by patients with myelopathy undergoing 1–2 level fusions.
Introduction
Surgical treatment is usually required in patients with cervical spondylotic myelopathy (CSM) when neurological deficits are evident or progressive. Anterior cervical discectomy and fusion (ACDF) is the most commonly performed procedure for degenerative cervical spine disorders [1–4] and is one of the most common interventions for patients diagnosed with CSM [5], as it has low complication and revision rates and fast postoperative recovery, and it generally yields favorable outcomes. CSM is a degenerative spinal condition, where spondylosis (one or higher levels) or ossification of the posterior longitudinal ligament leads to compression of the cervical nerve roots and spinal cord [6].
While ACDF is not the only surgical intervention for CSM, previous studies revealed that non-ACDF approaches produced inferior outcomes in certain cases [5,7]. A systematic review compared a variety of techniques for CSM, including ACDF, anterior cervical corpectomy with fusion (ACCF), laminoplasty, and laminectomy with fusion. This review found that ACCF had a higher fusion but also had a higher graft failure rate than multilevel ACDF [5]. Considering the late deterioration potential of cervical laminectomy and the high graft failure rate of ACCF, ACDF with anterior cervical plating remains a preferred intervention among neurosurgeons for CSM.
Given the widespread and increasing use of ACDF, a thorough understanding of patient- and operative-specific risk factors is required to improve surgical planning [1,2]. By comparing the quality outcomes between patients with myelopathy and nonmyelopathy who underwent ACDF, the risks involved for ACDF in myelopathy can be better characterized and potential complications can be better understood. In the present study, we set out to determine whether patients with myelopathy experience inferior postoperative outcomes and require increased inpatient resources compared to patients without myelopathy undergoing ACDF procedures.
Materials and Methods
Data from the databases used in the study were de-identified, and thus this study was exempt from institutional review board approval and informed consent.
1. Patient identification
The Thomson Reuters MarketScan Commercial Claims and Encounters Database (Truven Health Analytics Inc., Ann Arbor, MI, USA) was queried from 2007 to 2016 to identify adult patients who underwent an ACDF procedure. The Commercial Claims database is a national registry that captures person-specific clinical utilization, expenditures, and enrollment across inpatient, outpatient, and prescription drug services. Diagnostic and procedural information was available in the form of the International Classification of Diseases 9th version (ICD-9) and Current Procedural Terminology (CPT) codes. Deidentified, patient-specific enrollment identification numbers facilitated the tracking of longitudinal and across services of individual patients.
Patients who underwent ACDF were identified via the CPT and ICD-9 codes listed in Supplement 1. The followings are the exclusion criteria included in the study: patients with posterior arthrodesis to ensure that patients whose ACDF may have been part of a staged procedure that were not captured; patients with a history of cervical spine fracture; patients with a history of ossification of the posterior longitudinal ligament in the cervical region or a deformity; and patients with diagnosis codes consistent with trauma, tumor, infection, or other emergent status to ensure that only elective procedures were included. Patients aged <18 years and >65 years at the time of surgery were also excluded. Older patients (>65 years) were excluded because their records are maintained in a distinct Medicare database, unlike those aged 18–65 years with private insurance in the MarketScan database. To maintain patient homogeneity, Medicare-insured patients were thus excluded and the present analyses only rely upon patients with private insurance. For patients who underwent surgical revision, the index ACDF was identified and isolated.
2. Collected parameters and outcomes
Individual demographic information, such as age, sex, and comorbidity status, including the history of diabetes, congestive heart failure (CHF), cardiac arrhythmia, myocardial infarction, osteoporosis, liver disease, peptic ulcer disease, obesity, and tobacco use, were gathered. Operative characteristics, such as bone morphogenetic protein (BMP) use, the use of anterior cervical plating, and the number of fused levels, were noted. A Charlson comorbidity index (CCI) score was calculated for each patient using the full comorbidity history of the patient, and selected comorbidities are shown in Table 1.

Demographic and operative factors of anterior cervical discectomy and fusion cohort
Short-term outcomes, particularly, the length-of-stay after the index procedure, postoperative readmissions, reoperations, and costs, as well as 90-day total payments, were considered. Long-term outcomes, such as reoperation rates at 1 and 2 years after the index procedure, were also determined.
3. Study groups, statistical analysis, and ethical considerations
This study divided patients who underwent ACDF in to two groups as following: (1) the myelopathy cohort and (2) the nonmyelopathy cohort.
Patients with a diagnosis code of myelopathy (ICD-9 codes: 721.1 and 722.71) in the 6 months before ACDF or on the day of ACDF procedure were included in the myelopathy cohort. Patients with no such diagnosis were included in the nonmyelophathy cohort. The top 10 diagnoses for the nonmyelopathic cohort are shown in Supplement 2.
In the first step, quality outcomes were directly compared between the myelopathy and nonmyelopathy cohorts. To minimize the effect of potential confounding, propensity-score matching (PSM) was utilized. A greedy nearest-neighbor algorithm without replacement was employed to match the patient cohorts with a 1:1 myelopathy to nonmyelopathy ratio using a 0.01 caliper. Patient demographics (age and sex), comorbidities, including inputs for the CCI, and operative factors (BMP, anterior cervical plating, allograft use, and the number of fused levels) were inputted into the algorithm, and an improved covariate matching was confirmed through standardized mean difference analysis.
Two sample t-tests, chi-square tests, Wilcoxon rank sum tests, or Fisher’s exact tests were used as appropriate. Logistic regression was used to generate odds ratios (ORs). Information about the level of significance is provided in each table caption. Statistical analysis was conducted in R Studio ver. 1.0.153 (RStudio, Boston, MA, USA) and Stata/SE ver. 16.1 (Stata Corp., College Station, TX, USA).
Results
1. Unmatched patient cohort
Of the 107,480 patients who met the inclusion criteria, 29,152 (27.1%) were diagnosed with myelopathy before their index ACDF. At baseline, the median age of patients with myelopathy was 2 years higher (52 years versus 50 years, p<0.001) with a higher comorbidity burden (mean CCI score, 1.92 versus 1.58; p<0.001) than those without myelopathy (Table 1). Additionally, operative characteristics substantially differed between cohorts. Patients with myelopathy are more likely to receive a structural allograft implant (36.3% versus 34.6%, p<0.001) and a multilevel fusion (11.5% versus 5.0%, p<0.001) than those without myelopathy. They received anterior cervical plating at higher rates (94.5% versus 88.4%, p<0.001) and had less frequent BMP use (2.9% versus 4.1%, p<0.001).
2. Unmatched analysis of complications and outcomes
Overall postoperative complication rates (6.5% versus 5.7%, p<0.001) were higher in the myelopathic cohort, with more common several specific complications (Fig. 1). These included dysphagia (2.8% versus 1.5%, p<0.001) and pulmonary, renal, cardiac, and central nervous system (CNS) complications. Post-hemorrhagic anemia (PHA) (2.0% versus 1.2%, p<0.001) was more common among patients without myelopathy.

90-Day complication rates across the entire, unmatched cohort and stratified by the presence of a preoperative myelopathy diagnosis. CNS, central nervous system; PE, pulmonary embolism; AKI, acute kidney injury; DVT, deep vein thrombosis. *p<0.05. **p<0.01. ***p<0.001.
Patients with myelopathy are more likely to undergo surgical revision at 90 days, 6 months, 12 months, and 2 years (unadjusted OR, 1.63; 95% confidence interval [CI], 1.54–1.73; p<0.001) or be readmitted within 90 days (unadjusted OR, 1.27; 95% CI, 1.20–1.34; p<0.001) (Table 2). Inpatient costs were slightly lower in patients with myelopathy than those without myelopathy, and their average inpatient length-of-stay was not different (1.8 days versus 1.8 days, p=0.795).

Cost, reoperation, and readmission outcomes
3. Matched patient cohort
After patient cohorts were matched across 22 covariates, 28,697 and 28,697 patients with and without myelopathy, respectively, were included in subsequent analyses. Patient demographics, comorbidity burden, and operative characteristics were substantially balanced between the groups (Table 3). The mean CCI for patients with myelopathy was no longer higher than those without myelopathy (1.88 versus 1.89, p=0.836).
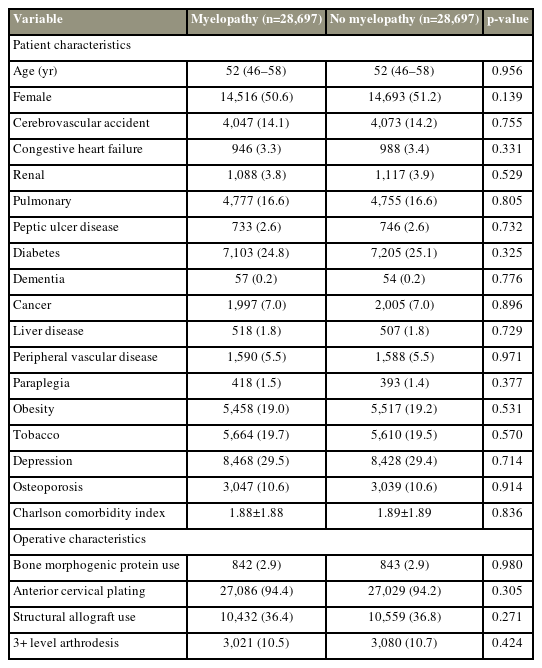
Demographic and operative factors of matched cohort
4. Matched analysis of complications and outcomes
The incidence of any postoperative complication remained higher in the myelopathic group (6.4% versus 5.7%, p=0.002) (Fig. 2). However, differences in renal or cardiac complications were no longer significant (Fig. 2). But, patients with myelopathy experienced pulmonary complications more frequently than those without myelopathy as previously described (2.0% versus 1.4%, p<0.001). Patients without myelopathy experienced elevated PHA rates (1.7% versus 1.2%, p<0.001), and patients with myelopathy still had higher rates of dysphagia (2.8% versus 1.7%, p<0.001) and CNS complications (0.5% versus 0.3%, p<0.001).
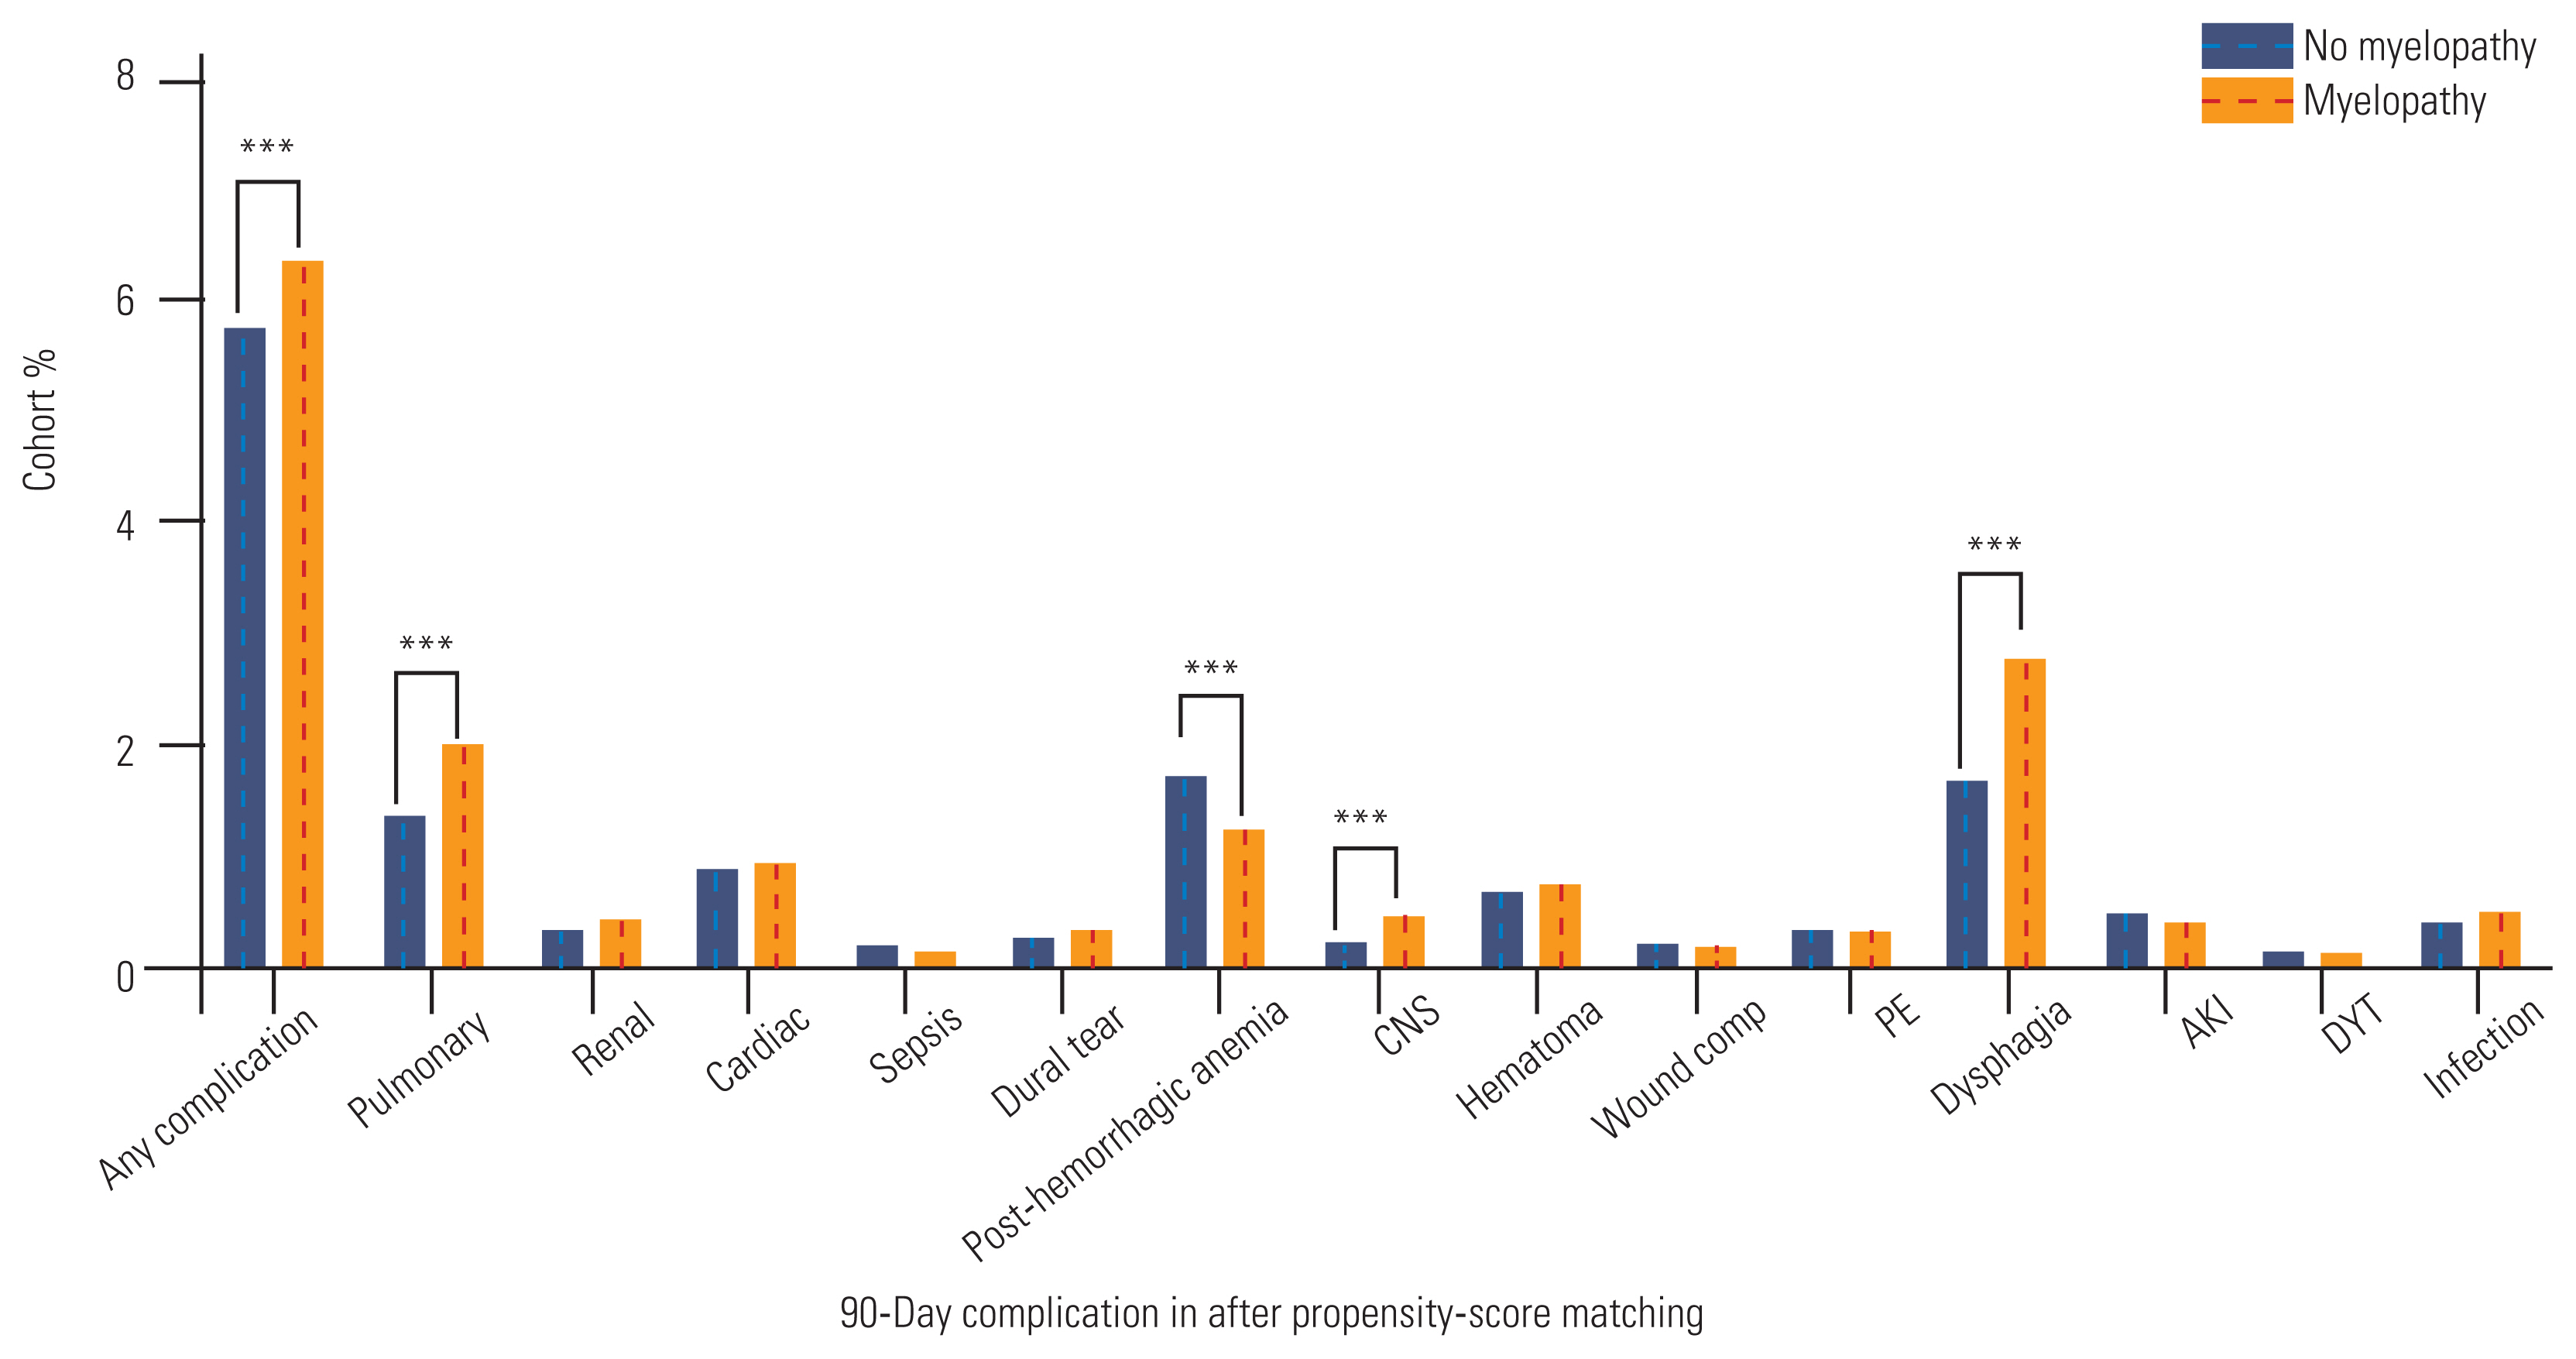
90-Day complication rates across the entire, unmatched cohort and stratified by the presence of a preoperative myelopathy diagnosis. CNS, central nervous system; PE, pulmonary embolism; AKI, acute kidney injury; DVT, deep vein thrombosis. *p<0.05. **p<0.01. ***p<0.001.
The myelopathic cohort remained at elevated risk for reoperation at 2 years (OR, 1.55; 95% CI, 1.44–1.67; p<0.001) (Table 4) and at elevated risk for readmission at 90 days (OR, 1.20; 95% CI, 1.12–1.28; p<0.001). Inpatient cost differences retained statistical significance, but the absolute differences were not large (Table 4).
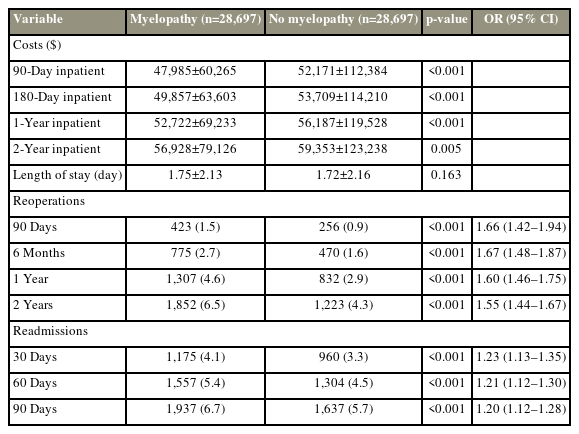
Cost, reoperation, and readmission outcomes for matched cohorts
5. Analysis per number of fused levels, unmatched versus matched
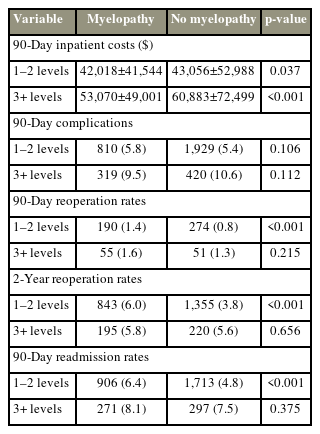
When patients were stratified by the number of fused levels, patients with 3+ level arthrodesis experienced globally inferior outcomes compared to patients who underwent 1–2 level fusion, with higher inpatient costs, complication, reoperation, and readmission rates (Table 5). At baseline, patients with myelopathy who required 3+ level fusion neither experienced different postoperative complication rates (9.5% versus 10.6%, p=0.112) than those without myelopathy at 3+ level fusion, nor had higher rates of 90-day readmission (1.6% versus 1.3%, p=0.215) or 2-year reoperation (5.8% versus 5.6%, p=0.656). However, differences in 2-year reoperation and 90-day readmission were seen for patients who underwent 1–2 level fusions. These differences were retained for patients who underwent 1–2 level fusions after PSM, although inpatient costs were no longer different between patients with and without myelopathy (Table 6). As previously described, 90-day complications, reoperation, or 90-day readmission rates were not different for patients with 3+ level fusion with and without myelopathy (Table 6).
Cost and clinical outcomes for unmatched cohorts

Cost and clinical outcomes for matched cohorts
Discussion
CSM is a common degenerative disorder of the cervical spine, with an estimated incidence of 1.6 per 100,000 inhabitants [8], and surgical treatment remains a central component for its management [9]. Given its substantial impact on patient quality-of-life, it is critical to determine which surgical interventions are most appropriate and how the condition itself influences postoperative outcomes. Treatments, including ACDF, ACCF, laminoplasty, laminectomy, laminectomy with fusion, and arthroplasty, have been considered in the management of CSM [5,10]. Previous studies have compared patient outcomes across these procedures, but few have performed detailed analyses of myelopathic and nonmyelopathic cohorts for any of these specific procedures [11–13]. This study used a large, national inpatient database and statistical matching tools to compare the complication, readmission, and reoperation rates in ACDF between the myelopathic and nonmyelopathic cohorts.
Before PSM was used to balance patient demographics and operative characteristics between the myelopathic and nonmyelopathic cohorts, in general, the patient with myelopathy experienced inferior outcomes to the patient with nonmyelopathy. Significant differences in reoperation rates (90 days, 6 months, 12 months, and 2 years); readmission rates (30 days, 60 days, and 90 days); and pulmonary, renal, cardiac, CNS, and dysphasia complications were observed. However, the myelopathic cohort suffered a higher comorbidity burden than the nonmyelopathic cohort. Patients with myelopathy had greater rates of cerebrovascular accident; CHF; renal, pulmonary, peptic ulcer, and peripheral vascular diseases; diabetes; paraplegia; obesity; depression; and osteoporosis; and a higher overall CCI. Furthermore, the myelopathic cohort had reduced BMP use and increased rates of 3+ level arthrodesis. These differences in comorbidity and operative factors between the cohorts may account for some of the observed differences in outcome. For example, the increased incidence of pulmonary disease in patients with myelopathy may influence the increased rate of pulmonary complications observed in the myelopathic cohort, thereby necessitating PSM.
After PSM was used to balance patient and operative characteristics between cohorts, patients with myelopathy remained at significantly greater risk for reoperation at 90 days, 6 months, 12 months, and 2 years. Moreover, the risk of readmission was greater in the myelopathic cohort, although the magnitude of the difference was smaller than that was seen for reoperation. Patients with myelopathy experienced increased rates of pulmonary postoperative complications and postoperative dysphagia, although other complications, including sepsis, infection, wound complications, or dural tears, were not markedly different between the cohorts. When patients were stratified by the number of fused levels, it was found that these differences in outcome were largely driven by myelopathic patients undergoing 1–2 level fusions. Patients with myelopathy who received 3+ level fusions did not experience meaningful different outcomes compared to patients without myelopathy undergoing similar multilevel fusions. Thus, even after balancing patients along demographic, comorbidity, and operative factors, we found that patients with myelopathy undergoing 1–2 level ACDF procedures experienced elevated rates of reoperation and readmission. Our findings suggest that patients with myelopathy undergoing ACDF may experience inferior postoperative outcomes compared to those without myelopathy, and thus may require increased preoperative counseling or more careful postoperative monitoring. This difference in outcomes is largely driven by patients with myelopathy undergoing 1–2 level ACDF procedures may be due to an underlying disparity in surgical indications. The symptomatology and extent of spondylosis in the nonmyelopathic cohort are likely less severe than in the myelopathic cohort. These differences, both in clinical presentation and frank disease, likely drive the disparity in outcomes observed in this study.
Concerningly, patients with myelopathy were at higher risk for dysphagia than those without myelopathy, and this risk should be factored into surgical decision-making for ACDF in patients with myelopathy. Further research is needed to prospectively identify patients at elevated risk for dysphagia following their ACDF. Previous studies revealed that risk factors for dysphagia following ACDF include duration of preexisting pain, number of vertebral levels involved, and BMP use (for 1–2 level procedures) [14,15]. Notably, postoperative dysphagia was strongly associated with preexisting medical comorbidities, thereby suggesting a possible application of machine learning models to predict dysphagia and other complications following ACDF [16]. Such model development could be particularly important to identify operative factors, such as BMP or structural allograft use, which modulate predicted risks of complication.
Our findings provide a more comprehensive assessment of the impact of preoperative myelopathy on post-ACDF outcomes than in the reported literature [17–19]. A higher complication rate in cervical myelopathy treatment by ACDF was suggested by a study; hence, others investigated whether the postoperative complication rate was higher in myelopathic cohort than in nonmyelopathic cohort [20]. Lukasiewicz et al. [17] revealed increased morbidity and mortality rates in a myelopathic ACDF cohort compared to a nonmyelopathic cohort, even when adjusted for baseline patient characteristics. However, findings of the study may be limited by small sample size and unbalanced comorbidities between the studied cohorts. Previous studies that reported serious augmented risk from myelopathy did not use the PSM technique to balance cohorts by patient and operative characteristics. The inability to separate the number of levels fused was another limitation of earlier analyses. We were able to study the outcomes among 1–2 level and 3+ level fusion patient cohorts separately because of our large sample size. We found a higher 90-day readmission rate in the myelopathic cohort than in the nonmyelopathic cohort for 1–2 level fusion patients when stratified by the number of fused levels and by using PSM, but it was not different for patients undergoing 3+ level procedures.
Notably, in general, patient with myelopathy had a substantially higher comorbidity burden than that of patient without myelopathy and therefore will continue to represent a challenging patient population for a spine surgeon. Indeed, our results suggest that those comorbidities augment the risk of inferior postoperative outcomes, as expected. The care for a patient with myelopathy should account for those comorbid conditions. Furthermore, the myelopathic cohort was found to incur lesser cost, while readmission and revision rates are greater than that of the nonmyelopathic cohort. A deeper examination of these cost differences revealed no significant difference after cohort matching and accounting for the number of levels fused. Thus, any raw cost differences between the two cohorts are due to clinical and operative factors, including the extent of arthrodesis.
While myelopathic cases may continue to undergo ACDF as clinically appropriate; however, results of our study may motivate to develop steps to improve the outcome of patients with myelopathy. These steps may include increased attention to dysphagia and pulmonary complications. For example, specific preoperative risk prediction models for dysphagia and pulmonary complications can be used to evaluate myelopathic cases for their candidacy before ACDF. Additionally, ensuring clear preoperative communication and a frank discussion of the postoperative risks between the neurosurgeon and patient would be appropriate while clinical decision-making for patients with myelopathy may not change because of our results.
Despite the large sample size of our study and the statistical tools used to balance patient cohorts, there are a few limitations to this study. First, the insurance claims database we used may contain individual coding errors. Our large sample size may reduce the effect of outlier data points or individual errors; this remains as a constraint to our findings. Furthermore, we were not able to extract data on disease severity, including the level of pain, degree of neurological compromise due to myelopathy, and the severity of cervical degeneration and misalignment. Accordingly, we were unable to query variables regarding functional improvement following the ACDF. Further research is needed to prospectively track patients with and without myelopathy and determine postoperative outcomes while accounting for the presence of comorbid conditions and collective information on disease severity, performance status, and functional recovery.
Conclusions
This study revealed inferior postoperative outcomes for patients with myelopathy undergoing ACDF before accounting for baseline differences in patient demographic, comorbidity, and operative factors between patients with and without myelopathy. Patients with myelopathy remained at significantly greater risk for reoperation at 90 days, 6 months, 12 months, and 2 years after balancing potential confounding variables across cohorts. The risk of readmission was also greater in the myelopathic cohort, although the magnitude of the difference was smaller than that was seen for reoperation. These differences in outcome were largely driven by patients with myelopathy undergoing 1–2 level fusions, when patients were stratified by the number of fused levels. Our findings suggest that patients with myelopathy undergoing ACDF may experience inferior postoperative outcomes compared to those without myelopathy and thus may require increased preoperative counseling or more careful postoperative monitoring.
Acknowledgments
The researchers would like to thank the Stanford Population Health Sciences for data access.
Notes
Conflict of Interest
AV is a consultant to Medtronic, Stryker, Nuvasive, Surgical Theater, and Osteocentric. Except for that, no potential conflict of interest relevant to this article was reported.
Author Contributions
Conceptualization: AJR, ES, KV, AV; data curation: AJR, ES, KV; formal analysis: AJR, ES, KV; writing–original draft: AJR, ES, KV, MNS, AV; writing–review & editing: ES, KV, MNS, AV; and final approval of the manuscript: all authors.
Supplementary Materials
Supplementary materials can be available from https://doi.org/10.31616/asj.2022.0347
Supplement 1. Patient cohort construction with defined clinical phenotyping and exclusion criteria.
Supplement 2. Top 10 principal diagnoses for non-myelopathic cohort.
asj-2022-0347-Supplementary.pdf