


Introduction
Lumbar spine degenerative disorders associated with instability often require spinal stabilization in the form of pedicle instrumentation and fusion in elderly patients [1,2]. There are multiple approaches allowing access to the interbody space, but transforaminal lumbar interbody fusion (TLIF) has become the gold standard. TLIF can be applied to any lumbar spine level with minimal retraction of the neural structures [3,4]. With increasing life expectancy, high-demand lifestyles, and advances in technology and instrumentation design in recent years, more elderly patients are undergoing TLIF surgeries for various lumbar pathologies [1-4]. Increasing age was thought to produce higher complication rates, with increased morbidity and mortality, resulting in suboptimal results [3-7]. Most literature evaluating TLIF efficacy and safety is from studies conducted on the younger population (age <60 years); hence, these results cannot be extrapolated for the elderly population [8]. The effect of age on final outcome and overall patient satisfaction after conventional open TLIF are not well known. There are reports of promising results with lumbar fusion surgeries for degenerative disorders in the elderly [6-8], but the effect of age on TLIF results in elderly patients has not been studied so far. Most of the literature on lumbar fusion in elderly patients has focused on the prevalence of complications, with no comparison to the younger population, and the results have not been validated in terms of age. Moreover, there has not been a direct comparison of results in two different groups in terms of results by age in heterogeneous cohorts. In this study, the authors attempted to reduce heterogeneity by comparing matched groups for all other variables except age, making this study the first of its kind to evaluate conventional open TLIF results in an elderly population.
The primary objective of this study was to compare the clinical-radiological outcomes and incidence of perioperative complications of conventional open TLIF at lower lumbar levels for elderly (age >65 years) and younger patients (age <65 years). The secondary objective was to evaluate the effect of age and co-morbidities on clinical outcome and incidence of complications in two groups.
Materials and Methods
1. Patients
This was a retrospective cohort study of prospectively collected data performed at Bombay Hospital and Medical Research Centre, Mumbai, India from 2011 to 2017. The institutional ethical and review committee approved the study (IRB approval no., 2019/32/191BH), which included 218 patients who underwent conventional open TLIF for degenerative pathology at L4–L5/L5–S1 levels (degenerative lumbar canal stenosis, prolapsed intervertebral disc, and lytic/degenerative spondylolisthesis). To be considered for surgical intervention, patients had to have a comprehensive clinico-radiological evaluation, conducted on more than one occasion, and have symptoms affecting activities of daily life. The same spinal surgeon, at a single institute, following the standard preoperative optimization of co-morbidities and the same postoperative mobilization protocols, operated on all patients. Patients with TLIF other than L4–L5/L5–S1 level, tandem stenosis, trauma, tumor, infection, and those who had revision or multilevel surgeries were excluded.
2. Surgical technique
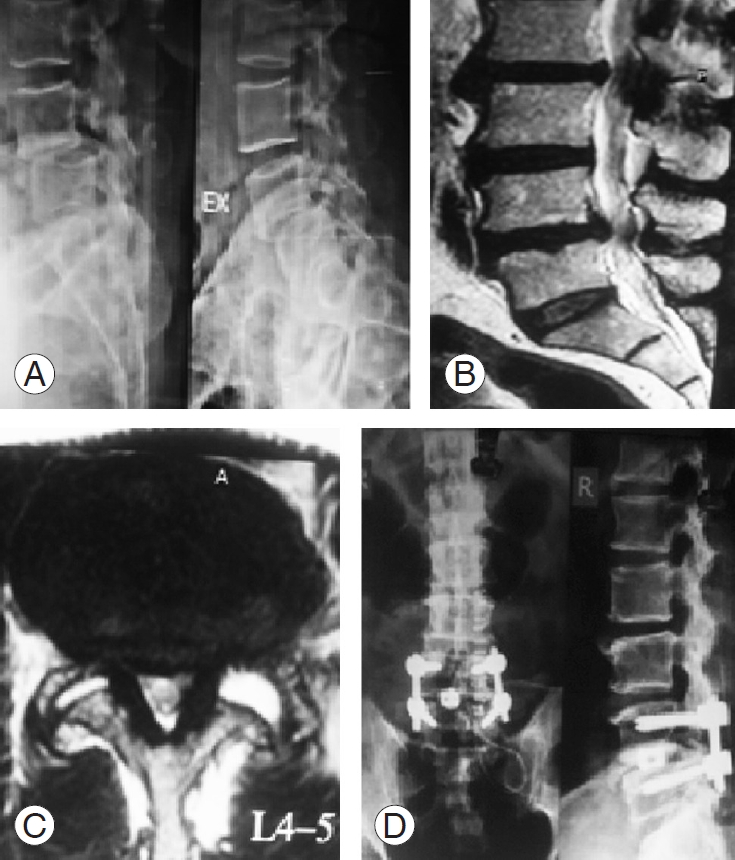
The appropriate spine level was exposed after radiographic surface marking. The posterior elements were subperiosteally exposed to the tips of the transverse processes. Pedicle screws were placed with fluoroscopy, based on anatomical landmarks. A starting hole was made at the intersection of the mid-transverse process, pars, and superior articular facet. The pedicle was cannulated with a pedicle probe, and the track was palpated with a ball-tipped probe to ensure no cortical breach had occurred. The hole was then tapped, and a screw of an appropriate diameter was placed, based on the surgeon’s discretion, followed by rod insertion. The next steps were decompression with partial unilateral laminectomy, inferior facetectomy, discectomy, end plate preparation, and titanium cage insertion with locally achieved bone graft followed by closure in layers over the sub-fascial drain (Fig. 1).
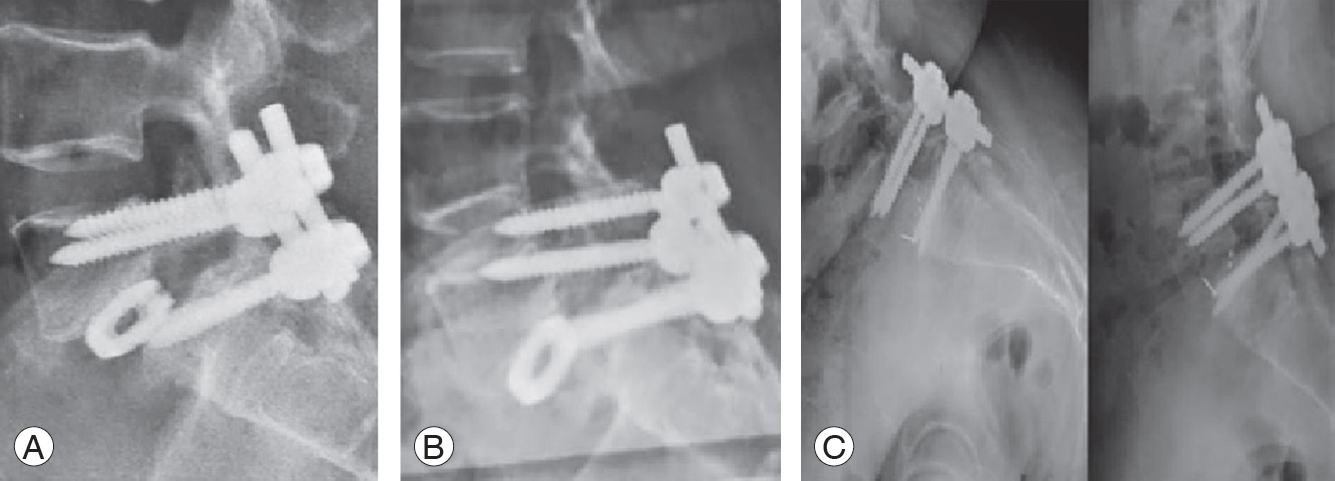
Of the 218 patients satisfying the above-mentioned inclusion criteria and with a minimum follow-up of 36 months, 121 were included in study analysis. To study the effect of age, patients were divided into two groups: group A included 64 elderly patients (age >65 years) and group B included 57 younger patients (age <65 years but >25 years of age). Preoperative data, such as demographic (age, sex, body mass index [BMI]), clinical (Visual Analog Scale [VAS], Oswestry Disability Index [ODI], neurology), medical co-morbidities, and radiological data were recorded (Table 1). Data on co-morbidities (single or multiple) and their distribution are shown in Table 2. An independent observer reviewed intraoperative parameters like operative time, estimated blood loss, intraoperative adverse events, and hospital stay (Table 1). Postoperative complications were divided into four broad categories (Table 3). Most patients were mobilized out of bed with a walker on first postoperative day in both groups. Dressing changes were done at 48 hours postoperatively with drain removal (if output <50 mL), and patients were usually discharged within 3 to 4 days. All patients were followed up with evaluation of VAS, ODI, and neurological parameters at 1 month, 3 months, 6 months, 12 months, and 24 months (Table 4). Fusion rate, screw loosening, implant failure, pseudoarthrosis, and cage slippage were assessed with dynamic X-rays and computed tomography scans in both groups (Fig. 2, Table 5). The Wang criteria, in which grading of results is based on symptom relief, final return to work, and satisfaction index, were used to evaluate surgical outcome at final follow-up (Table 2). All patients were interviewed with a pretested questionnaire, and the outcome was graded. Statistical analysis with comparison of two groups was established with simple regression analysis and Student t-test using the IBM SPSS software ver. 19.0 (IBM Corp., Armonk, NY, USA) and Microsoft Excel 2010 (IBM Corp.). The effect of age on clinical outcome as well as co-relation between medical comorbidities and complications were evaluated with chisquare test. A p-value <0.005 was considered significant.
Results
Group A was comprised of 64 patients (males, 24; females, 40), and group B was comprised of 57 patients (males, 28; females, 29). The mean age in group A was 73.8±4.5 years (range, 65–93 years) and in group B was 47.3±12.7 years (range, 25–65 years). There was no significant difference (p=0.09) in BMI between the groups (Table 1). All patients in group A had neurogenic claudication as the presenting symptom, with a mean symptom duration of 9.5±8.6 months (range, 3–24 months) before surgery. In addition to neurogenic symptoms, 46 patients also complained of mechanical low back pain, with radiologically evident instability of varying degrees, with mean VAS score of 7.9±1.52 (range, 6–10). The preoperative mean ODI score in group A was 78.35±6.46 (range, 66–87) (Table 4). In group B, 26 patients were in the 25–45-year age range, and 31 were in the 45–65-year age range. The mean preoperative VAS score was 7.8±1.13 (range, 4–9) and preoperative ODI score was 76.11±6.52 (range, 56–84). There was little significant difference in postoperative VAS score between the two groups, and the overall improvement in functional outcome at final follow-up was insignificant in the two groups. The mean duration of preoperative symptoms was 7.8±8.1 months (range, 3–24 months) in group B (Table 4). The incidence of medical co-morbidities was greater among group A patients (single, 23 cases; multiple, 17 cases). In group B, 19 patients had a single co-morbidity, and 12 patients had two or more co-morbidities (Table 1). The chi-square test revealed no significant difference in outcome at final follow-up between the two groups with reference to the presence of co-morbidities (p=0.37 for group A and p=0.17 for group B). The mean operative time was 154±29 minutes (range, 75–215 minutes) in group B and 158±35 minutes (range, 75–230 minutes) in group A. The mean operative blood loss was 220±15 mL in group A and 190±31 mL in group B (p=0.01) (Table 1). The reason for this statistical significance might be that one patient in group A had a blood loss of around 1,600 mL, for no obvious reason, and required multiple blood transfusions with prolonged hospital stay. In each group, there was a single, minor intraoperative dural tear that was managed with fibrin glue, Gelfoam, and watertight fascia closure, with no postoperative dural tear-related complications. In group A, 11 patients had complications in the postoperative period (Table 3). Three patients, who had superficial infections (due to uncontrolled diabetes) and delayed wound healing, were managed conservatively with antibiotics and daily dressings, prolonging their hospital stays. Two patients had deep infection, requiring debridement on the seventh postoperative day. One patient had wound dehiscence on the ninth day postoperatively, requiring secondary re-suturing, and another patient developed transfusion related problems after multiple blood transfusions (acute respiratory distress syndrome [ARDS]). Additionally, three patients had urinary tract infections (UTI) with related fever and were managed with oral antibiotics postoperatively without additional hospital stay (Table 3). The mean duration of hospital stay in group A was 3.5±1.67 days (Table 1). Three patients had persistent paresthesia related to diabetic neuropathy, and none of the patients had any neurological complications in group A in the postoperative period. Seven patients developed syndrome of inappropriate antidiuretic hormone secretion due to electrolyte imbalance, and five patients needed prolonged catheterization in group A. Six patients in group B had postoperative complications. Two patients developed superficial wound infections, requiring minor debridement and re-suturing. One patient had a screw malposition with persistent paresthesia, requiring screw revision on the third postoperative day, and another patient had UTI with fever that required prolonged oral antibiotics (Table 3). The mean duration of hospital stay in group B was 2.45±1.76 days. The mean ODI and VAS scores showed significant improvement (p<0.05) in both the groups at final follow-up, with considerable improvement in clinical parameters (Table 4). Per Wang’s criteria, 54 patients in group A had excellent-to-good outcomes. Ten patients had fair-to-poor outcomes, two had only partial symptom relief, and one patient had worsened symptoms after surgery. In group B, 51 patients had excellent-to-good outcomes, and six patients had fair-to-poor outcomes, with persistent or recurrent symptoms at final follow-up (Table 4). There was no significant difference in mean time to return to mobilization between the two groups, although group A took a little longer (average, 3.4 weeks) to reach pain-free status than group B (average, 2.6 weeks). Radiological data analysis showed a 90.6% fusion rate, two cases of screw loosening, three pseudoarthrosis, and one case each of implant failure (due to trivial fall and low bone mineral density), adjacent segment disease (ASD), and cage migration in group A (Table 5). Five patients, including two cases of screw loosening and three cases of pseudoarthrosis, underwent revision surgeries at the same level while a case of asymptomatic ASD was managed conservatively. The fusion rate was 92.9% in group B, with two cases of pseudoarthrosis and two cases of ASD (Table 5). Revision surgeries were done in four patients, two cases each of pseudoarthrosis and symptomatic ASD in group B (Table 3).
Discussion
The recent advances in surgical techniques and instrumentation design have made TLIF a safe approach with improved outcomes and decreased morbidity rates [6-8]. TLIF can be performed in populations at an increased surgical risk (elderly and those with significant comorbidities) [9-11]. Despite these technological advancements, age remains a major concern when planning a surgical strategy for elderly patients.
Conventional TLIF for degenerative lumbar disease is increasingly being performed in elderly patients [9,10]. TLIF outcomes in elderly patients have not been studied widely, with limited literature compared to that for younger patients [12]. It is generally thought that fusion procedures are associated with increased cost and incidence of complications [4]. Recently, Carreon et al. [13] studied 98 patients (age >65 years) who underwent lumbar decompression and fusion and concluded that elderly patients were at increased risk of surgery-related complications. Conversely, some authors have reported no difference in either outcome or rate of complications between the elderly and the younger population [14-17]. However, some studies have said that there is a clinical benefit in terms of quality of life for elderly patients who have had operations for degenerative lumbar disease [14,18,19]. The effect of age on lumbar fusion, therefore, remains unclear. Glassman et al. [11] did a retrospective study of 85 elderly patients (>65 years) who were treated with single level posterolateral fusion at L5–S1 and concluded that there was a mean improvement at 2 years of surgery of 6.21 on the physical composite scale of 36-item Short-Form Health Survey (SF-36) and 5.71 points on the mental composite scale of the SF-36. The disability improvement score, as measured with the ODI, was 16.38. They compared these results with a younger control group and found no significant differences in any case.
Okuda et al. [12] performed a cohort study of 101 patients affected by degenerative spondylolisthesis at L4–L5 treated using the posterior lumbar interbody fusion technique. They used a questionnaire from the Japanese Orthopedic Association, quantifying both the fusion degree and the complications. They found similar results in terms of quality of life in patients above and below age 70 years. Some previous studies have concluded that comorbidities are associated with more complications and greater mortality rates following lumbar surgery [4,5,20]; however, in the present series, there was no surgical mortality and no difference in the incidence of complications regardless of the presence or absence of medical co-morbidities. Despite the increased co-morbidity rate in patients older than 65 years, extensive adjustment revealed the odds of developing a complication were not significantly different if age were independently assessed [21]. These findings suggest that age itself is not an independent risk factor for complications after TLIF. Although some clinical case studies have indicated a slightly higher risk of perioperative complications in elderly patients [1-3], cohort studies with younger control groups have failed to show significant differences [12,22]. In this series, a young and an elderly patient both underwent single-level TLIF with substantially similar characteristics like gender, BMI, and indication for surgeries. There was no significant difference between the two groups with respect to total complication rate. The cardiopulmonary complication rate, once said to be common in the elderly age group, was not very common in this study. One elderly patient developed ARDS, requiring prolonged ventilator support with intensive care and a prolonged hospital stay, but this complication was mostly because of transfusion related volume overload caused by multiple blood transfusions. Overall, intraoperative blood loss in the two groups was not significantly different.
Mortality in an elderly population undergoing TLIF has not been studied in detail in previous studies. This study had no intra- or postoperative mortality, even after 2 years of surgery. This is mostly attributed to the fact that this study dealt with degenerative patients with ambulation related issues, who were generally healthy except for reduced reserves due to age and medical co-morbidities. With strict preoperative optimization over co-morbidities and with judicial patient selection, the TLIF-related mortality in elderly patients can be brought down to zero as in this study.
Reoperation rates were almost the same in both groups in this study. Clinical outcomes in terms of satisfaction after surgery, as well as pain and functional improvement, were similar in both elderly and younger patients. However, the quality of the evidence, as it stands, could be poor and randomized controlled trials or well-controlled prospective cohort studies are needed to determine TLIF’s complication risks and efficacy more accurately in elderly patients. As of now, age should not be an independent exclusion factor and the decision to proceed with TLIF should be made on a case-by-case basis.
The main limitations of study were small sample size, retrospective design, and matched pair analysis without randomization, even though data were collected prospectively. Another limitation was that the study was designed with the assumption that age has a large effect on clinical outcome and perioperative complications while undergoing TLIF; if age only had a small effect, it would require a larger sample size to increase the power of the study. Finally, this study was limited to patients undergoing single-level TLIF, and results may not necessarily apply to patients who undergo multi-level TLIF. Finally, a midterm follow-up of 2 years was analyzed here, which does not allow us to know whether differences will appear over a longer period.
Conclusions
This study shows a comparable clinical benefit in elderly patients (age >65 years) who underwent conventional TLIF for degenerative lumbar disease, and this improvement, in the form of clinico-radiological outcome and complication rate, was no different from that obtained by younger patients. Preoperative risk assessment and optimization of medical co-morbidities are important to avoid intraoperative and postoperative complications. Increased age should not be a contraindication for TLIF in degenerative lumbar disease.