


Erratum: Correction of Figures. The Time Course Changes in Bone Metabolic Markers after Administering the Anti-Receptor Activator of Nuclear Factor-Kappa B Ligand Antibody and Drug Compliance among Patients with Osteoporosis
- Kazuhide Inage1, Sumihisa Orita1, Kazuyo Yamauchi1, Yoshihiro Sakuma2, Go Kubota1, Yasuhiro Oikawa3, Takeshi Sainoh1, Jun Sato1, Kazuki Fujimoto1, Yasuhiro Shiga1, Kazuhisa Takahashi1, Seiji Ohtori1
Asian Spine J 2015;9(3):338-343
Corrections for Fig. 2, Fig. 3, and Fig. 4 in page 340 are needed.
There were some mistakes in the numerical values of the graphs. We apologize for any inconvenience that this may have caused.
• Before correction

Fig. 2. P1NP levels before and 1 month after administrating the anti-RANKL antibody. P1NP, N-terminal propeptide of type 1 collagen; RANKL, receptor activator of nuclear factor-kappa B ligand; NS, not significant.
• After correction
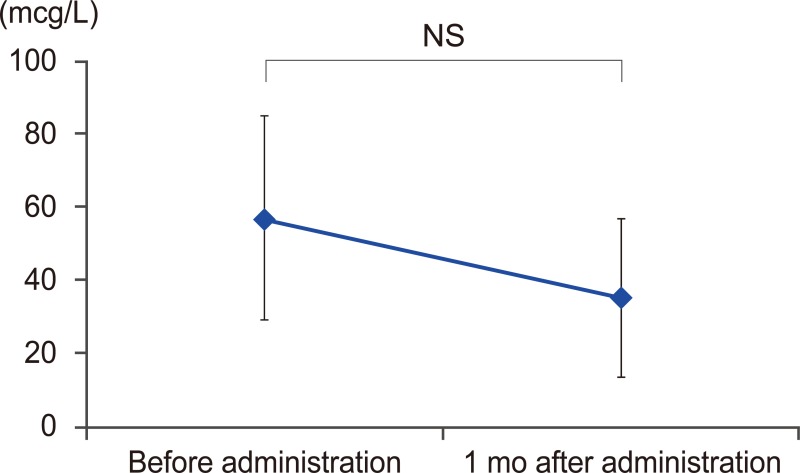
Fig. 2. P1NP levels before and 1 month after administrating the anti-RANKL antibody. P1NP, N-terminal propeptide of type 1 collagen; RANKL, receptor activator of nuclear factor-kappa B ligand; NS, not significant.
• Before correction
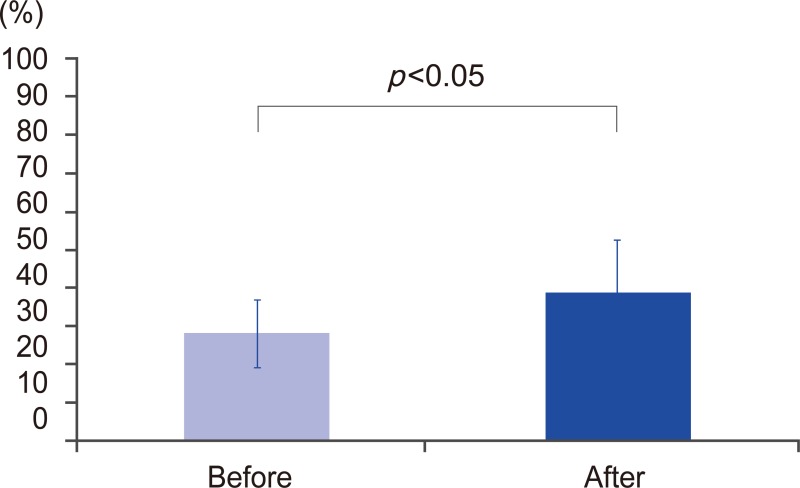
Fig. 3. The averages YAM level for the anti-RANKL antibody before and 6 months after treatment. YAM, young adult mean; RANKL, receptor activator of nuclear factor-kappa B ligand.
• After correction

Fig. 3. The averages YAM level for the anti-RANKL antibody before and 6 months after treatment. YAM, young adult mean; RANKL, receptor activator of nuclear factor-kappa B ligand.
• Before correction
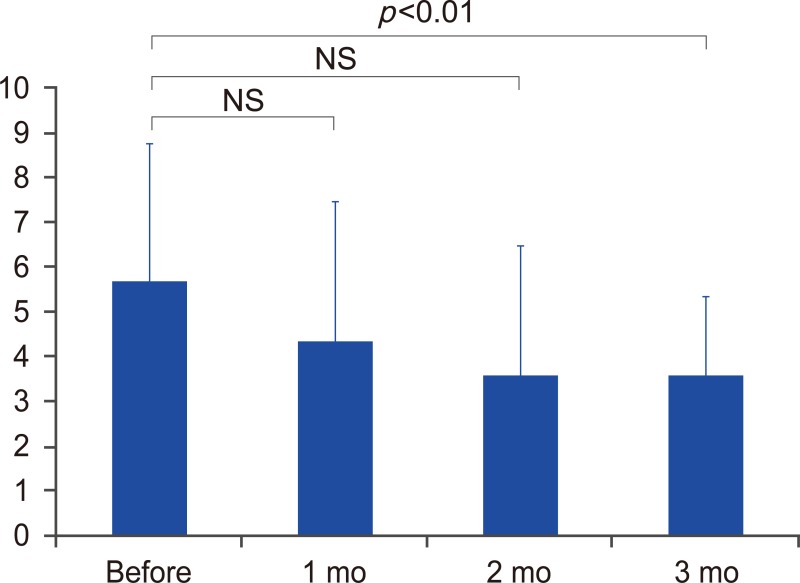
Fig. 4. The time course changes by using the back pain VAS before treatment and 1, 2, 3, and 6 months after treatment. VAS, visual analogue scale; NS, not significant.
• After correction
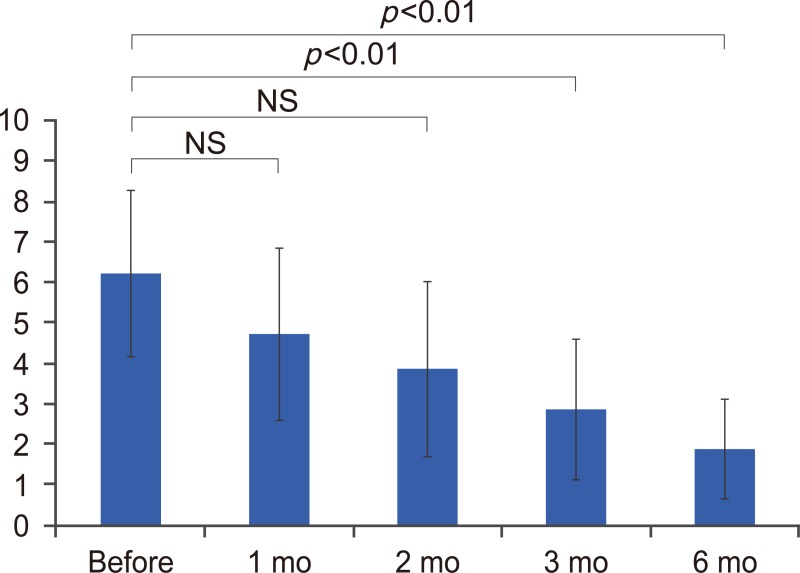
Fig. 4. The time course changes by using the back pain VAS before treatment and 1, 2, 3, and 6 months after treatment. VAS, visual analogue scale; NS, not significant.