Evaluation of the Degenerative Changes of the Distal Intervertebral Discs after Internal Fixation Surgery in Adolescent Idiopathic Scoliosis
Article information
Abstract
Study Design
Retrospective study.
Purpose
Lumbar intervertebral disc degeneration is an important cause of low back pain.
Overview of Literature
Spinal fusion is often reported to have a good course for adolescent idiopathic scoliosis (AIS). However, many studies have reported that adjacent segment degeneration is accelerated after lumbar spinal fusion. Radiography is a simple method used to evaluate the orientation of the vertebral column. magnetic resonance imaging (MRI) is the method most often used to specifically evaluate intervertebral disc degeneration. The Pfirrmann classification is a well-known method used to evaluate degenerative lumbar disease. After spinal fusion, an increase in stress, excess mobility, increased intra-disc pressure, and posterior displacement of the axis of motion have been observed in the adjacent segments.
Methods
we retrospectively secured and analyzed the data of 15 patients (four boys and 11 girls) with AIS who underwent a spinal fusion surgery. We studied the full-length view of the spine (anterior-posterior and lateral) from the X-ray and MRI obtained from all patients before surgery. Postoperatively, another full-length spine X-ray and lumbosacral MRI were obtained from all participants. Then, pelvic tilt, sacral slope, curve correction, and fused and free segments before and after surgery were calculated based on X-ray studies. MRI images were used to estimate the degree to which intervertebral discs were degenerated using Pfirrmann grading system. Pfirrmann grade before and after surgery were compared with Wilcoxon signed rank test. While analyzing the contribution of potential risk factors for the post-spinal fusion Pfirrmann grade of disc degeneration, we used generalized linear models with robust standard error estimates to account for intraclass correlation that may have been present between discs of the same patient.
Results
The mean age of the participant was 14 years, and the mean curvature before and after surgery were 67.8 and 23.8, respectively (p<0.05). During the median follow-up of 5 years, the mean degree of the disc degeneration significantly increased in all patients after surgery (p<0.05) with a Pfirrmann grade of 1 and 2.8 in the L2–L3 before and after surgery, respectively. The corresponding figures at L3–L4, L4–L5, and L5–S1 levels were 1.28 and 2.43, 1.07 and 2.35, and 1 and 2.33, respectively. The lower was the number of free discs below the fusion level, the higher was the Pfirrmann grade of degeneration (p<0.001). Conversely, the higher was the number of the discs fused together, the higher was the Pfirrmann grade.
Conclusions
we observed that the disc degeneration aggravated after spinal fusion for scoliosis. While the degree of degeneration as measured by Pfirrmann grade was directly correlated by the number of fused segments, it was negatively correlated with the number of discs that remained free below the lowermost level of the fusion.
Introduction
Spinal fusion is often reported to have a good course for adolescent idiopathic scoliosis (AIS) [1]. However, many studies have reported that adjacent segment degeneration (ASD) is accelerated after lumbar spinal fusion [2]. Cochran et al. [3] have reported that low ASD is more likely to occur in patients with AIS in whom fusion was extended down to L4 or L5. Disc degeneration is an age-related process but may be accelerated by several genetic or pathological conditions, such as spine trauma, inflammatory diseases, and systemic disorders (atherosclerosis, high cholesterol, diabetes, and nutrient supply to the disc). Furthermore, mechanical loading has been identified as a major factor that modifies the effect of age on the progression of intervertebral disc degeneration [4,5]. The orientation of the lumbosacropelvic structure also plays an important role in the determination of shear and compressive forces applied on the anterior (corpus vertebrae and intervertebral discs) and posterior (facet joints) elements of the lumbar vertebral column [6].
Intervertebral disc degeneration is characterized by a loss of cellularity, degradation of extracellular matrix, and, consequently, morphological changes and alterations in biomechanical properties. Secondary changes from the redistribution of tissue stress include fibrocartilage production, with the disorganization of the annular architecture and increases in type II collagen [7]. AIS is a complex three-dimensional disorder of the spine involving deviations in the frontal plane, modifications of the sagittal profile, rotations in the transverse plane, and alterations of the rib cage. Local structural deformities concurrently develop in pedicles, spinous and transverse processes, vertebral bodies, and intervertebral discs. With idiopathic scoliosis, the intervertebral discs become wedged and narrowed, which is due in part to the altered biomechanical environment [8].
Radiography is a simple method used to evaluate the orientation of the vertebral column [9-11]. magnetic resonance imaging (MRI) is the method most often used to specifically evaluate intervertebral disc degeneration [7]. The displacements of the intervertebral disc components under various movements of the spine can be also measured from MRI images, highlighting significant correlations between the nucleus zone migration and flexion-extension movements of the spine [7]. It has been reported that there might be correlations between nucleus zone migration and intervertebral disc wedging in patients with idiopathic scoliosis. Significant differences on disc migration at the apex of the curve have also been observed [12,13].
The Pfirrmann classification is a well-known method used to evaluate degenerative lumbar disease [14]. The Pfirrmann scale has been modified because cerebrospinal fluid (CSF) has higher signals than the disc in the MRI sequences used, and this criterion was not used to evaluate the intensity difference of intervertebral disc with respect to the CSF [15]. According to Pfirrmann grading, grades I and II indicate normal discs, whereas grades III, IV, and V indicate degenerated discs. For cases in which multiple intervertebral disc degeneration was present, the most advanced disc was considered [15]. In general, the causes, incidence, and risk factors of ASD remain uninvestigated. It has been reported that the development of ASD, similar to the breakdown of a neighboring unfixed motion segment, is a common consequence of an instrumented lumbar spine [16]. After spinal fusion, an increase in stress, excess mobility, increased intra-disc pressure, and posterior displacement of the axis of motion have been observed in the adjacent segments [2]. At the least, lumbar fusion is thought to accelerate ASD. Therefore, we aimed to study the degenerative changes of intervertebral discs after spinal fusion in AIS and its potential risk factors.
Materials and Methods
This retrospective cohort study was conducted on a sample of patients with AIS seeking care from the orthopedic clinic at Sina Hospital, Tehran, Iran during 2010–2011. It is certified that all applicable institutional and governmental regulations concerning the ethical use of human volunteers were followed during this research. The Ethical Committee of Tehran University of Medical Sciences approved this study. The study protocol conforms to the ethical guidelines of the 2008 Declaration of Helsinki. Patients who were 10–21 years old at the time of spinal fusion surgery were included in this study. Patients who were diagnosed with degenerative or congenital scoliosis were excluded from this study. A total of 15 patients (four boys and 11 girls) contributing to 41 discs were included in the current analysis. Informed written consent was obtained from all participants. Demographic data was secured from the hospital records on the index admission. The pre- and postoperation full-length spine view (anteroposterior and lateral) radiography and MRI was performed in all patients. Pelvic tilt, sacral slope, pelvic incidence, curve correction, and fused and free segments after the study were determined. The intervertebral disc degeneration was quantified using MRI as suggested by Pfirrmann [14].
Pfirrmann grades before and after surgery were compared with Wilcoxon signed rank test. Patients were analyzed as clusters to estimate the intraclass correlation (ICC) between discs in the same patient. To analyze the contribution of potential risk factors for the post-spinal fusion Pfirrmann grade of disc degeneration, we used generalized linear models with robust standard error estimates to account for ICC that may have been present between discs of the same patient. The degree to which the scoliosis curvature was corrected, indices of sagittal balance, degrees of scoliosis curve, and number of fused segments and discs that remained free were analyzed as potential risk factors for postoperative Pfirrmann grade of degeneration. Potential confounding bias due to age and body mass index (BMI) was controlled by introducing each risk factor to a model already incorporating age and BMI. Statistical significance level at a two-tailed type I error was set at 0.05. All statistical analyses were performed using STATA ver. 12.0 (Stata Corp., College Station, TX, USA).
Results
The demographic information of the patients is presented in Table 1, and surgical characteristics of participants are presented in Table 2. Moreover, the contribution of candidate variables to the postoperative Pfirrmann grade of disc degeneration is presented in Table 3. In this study, 15 patients (four boys and 11 girls) were included. The median (interquartile range) for follow-up time was 57 years (54–67 years). The mean age for boys and girls were 14 and 14.1 years, respectively. The mean degree of scoliosis curvature before and after the study was 67.8 and 23.8, respectively. The mean degree of curve correction was 44. The mean number of fused segment was 12.7. The mean distal free segment was 2.7. A total of 42 discs were evaluated of which 37 (88%) showed degenerative changes. The mean Pfirrmann grade increased from 1.2 before index surgery to 2.4 after index surgery. As shown in Fig. 2, there were six free discs at the L2–L3 level, seven at the L3–L4, 14 at the L4–L5, and 15 at the L5–S1. In preoperative evaluation, the Pfirrmann grade in nine discs was 1, with 33 discs at grade 2 and no patients had a preoperative Pfirrmann grade ≥3. The Pfirrmann grade considerably increased after surgery with only four discs showing grade 1. Details of each participants surgical characteristics has been provided in the Tables 4 and 5.
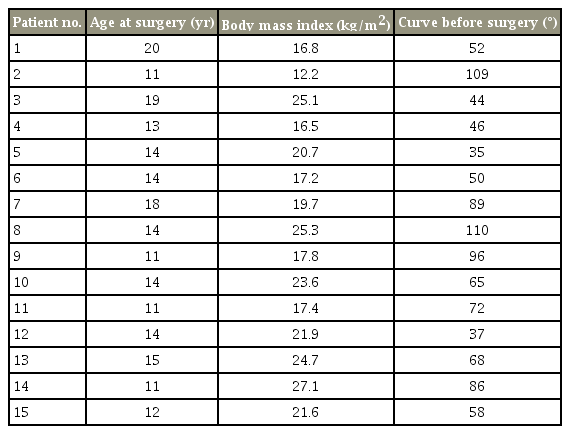
Baseline characteristics of participants
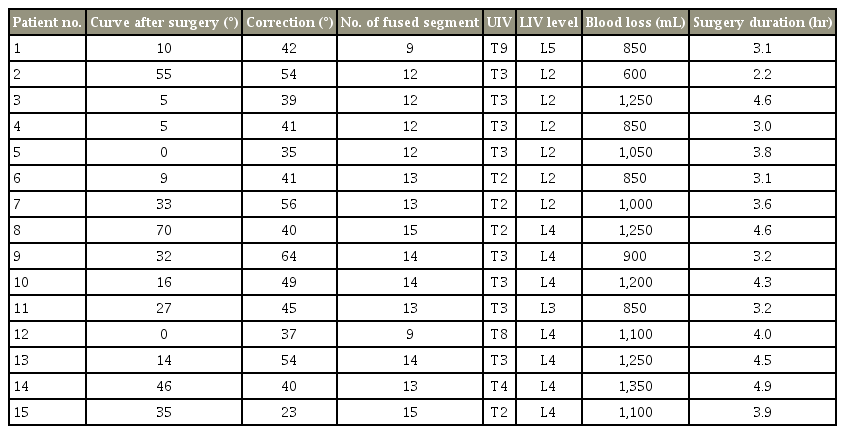
Surgical characteristics of participants
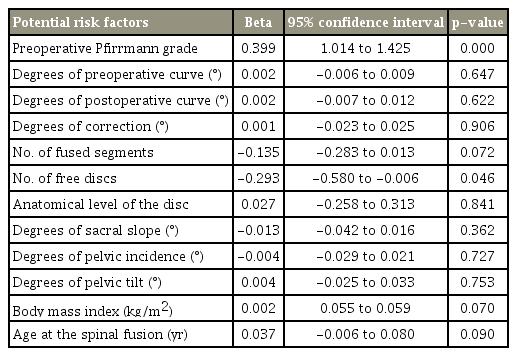
Contribution of candidate variables to the postoperative Pfirrmann grade of disc degeneration

Comparison between the number of distal free disc and degenerative grade after surgery across varying grades of disc degeneration.

Sagittal balance characteristics of participants

Dick degeneration severity among participants
In Fig. 1, the highest degeneration changes were observed in the L2–L3 level where Pfirrmann grade increased from 1 in the preoperative state to 2.8 postoperatively mean. The least magnitude of increase in Pfirrmann grade was observed at the L5–S1 level with Pfirrmann grade increasing from 1 before surgery to 2.3 after surgery. As shown in Fig. 2, the further the free discs were from the fused ones, the lesser were their postoperative Pfirrmann grades. However, this trend did not achieve a statistical significance (p=0.84). The Pfirrmann grade in five discs (11.9%) did not change after surgery, and the rest of the 37 discs (88%) had at least one degree increase. As shown in Fig. 2, the overall mean Pfirrmann grade preoperatively was 1.2 that increased to 2.4 postoperatively.

Comparison of disc degeneration before and after surgery according to level.
The lower was the number of free discs below the level of fusion, the higher was the Pfirrmann grade of degeneration (p<0.001). Conversely, the higher was the number of the discs fused together, the higher was the Pfirrmann grade (p=0.041) (Fig. 3). No significant association was observed between Pfirrmann grade after surgery and candidate variables, including the size of curve before surgery (p=0.647), curve after surgery (p=0.622), correction curve (p=0.906), anatomical disc (p=0.841), pelvic tilt (p=0.753), pelvic incidence (p=0.727), sacral slope (p=0.362), BMI (p=0.070), and patients age at surgery (p=0.090). The radiographic characteristics of some of the participants has been presentedin Figs. 4–7.
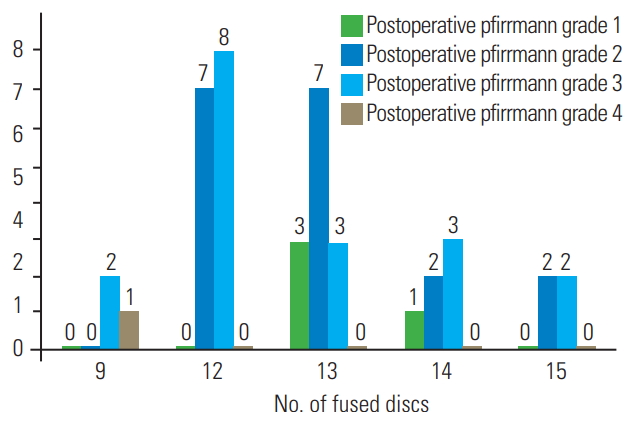
Frequency of varying Pfirrmann grades across numbers of fused discs.
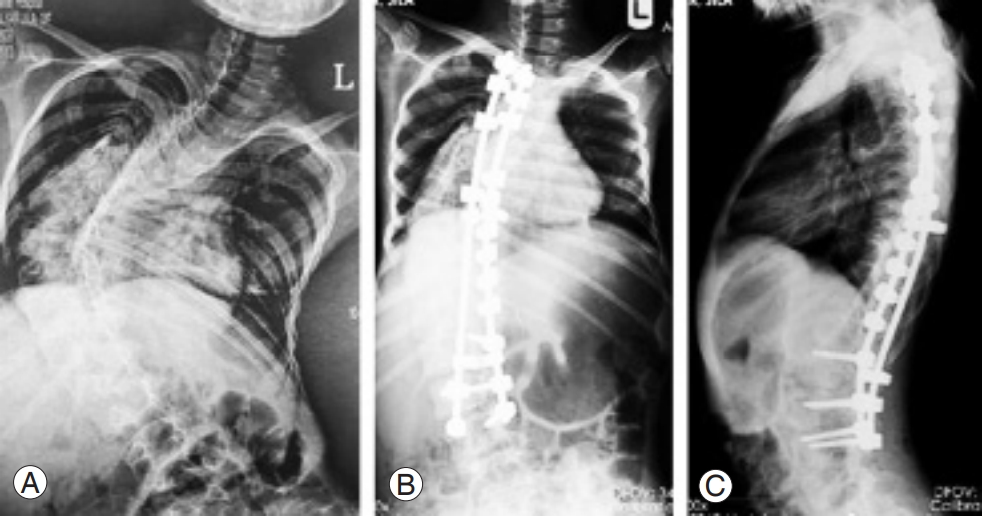
(A–C) X-ray images of patient 15 before and after surgery.
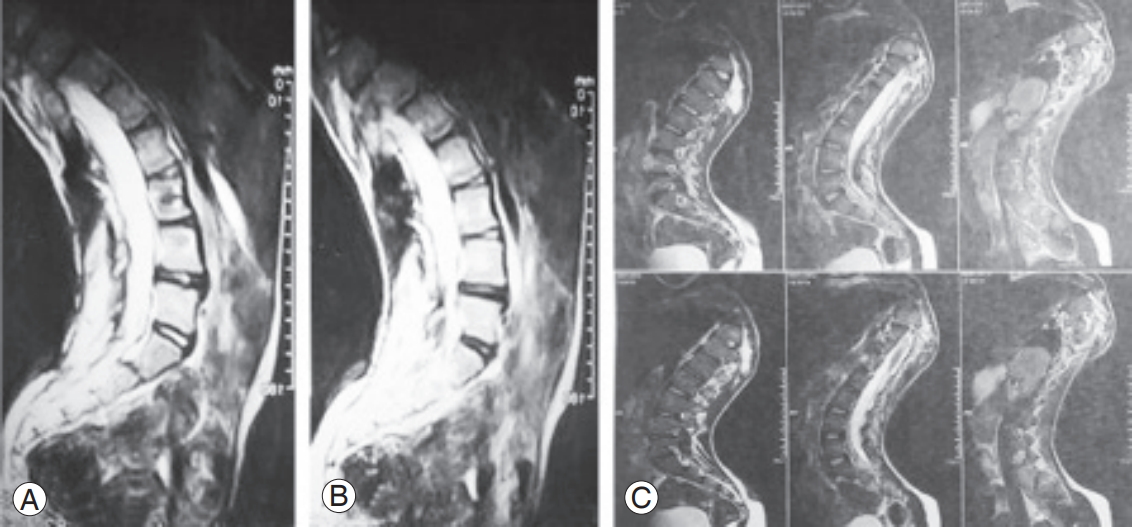
(A–C) Magnetic resonance imaging of patient 15.
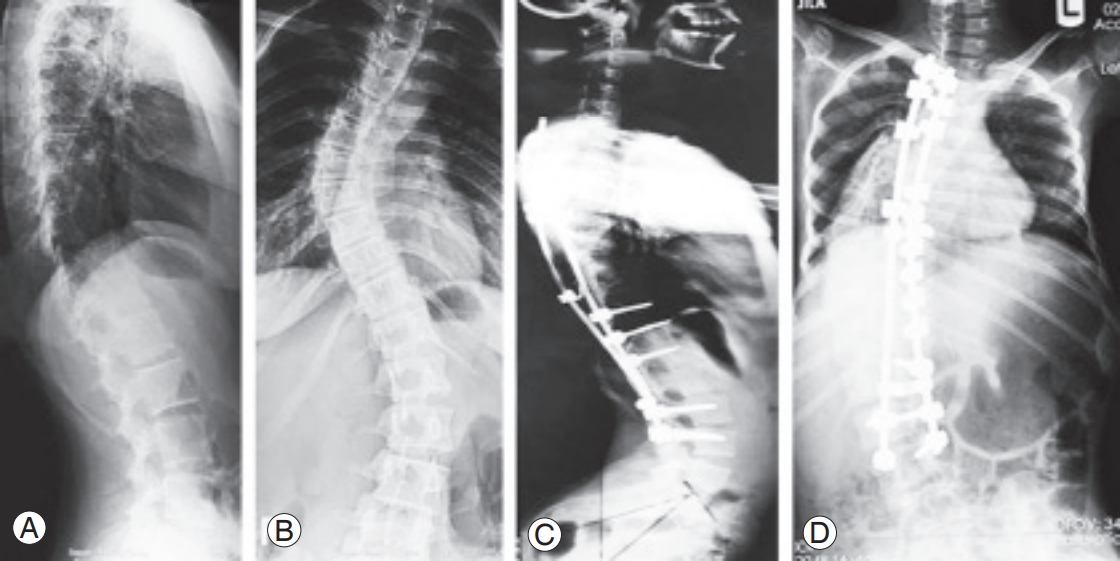
(A–D) X-ray images of patient 10 before and after surgery.
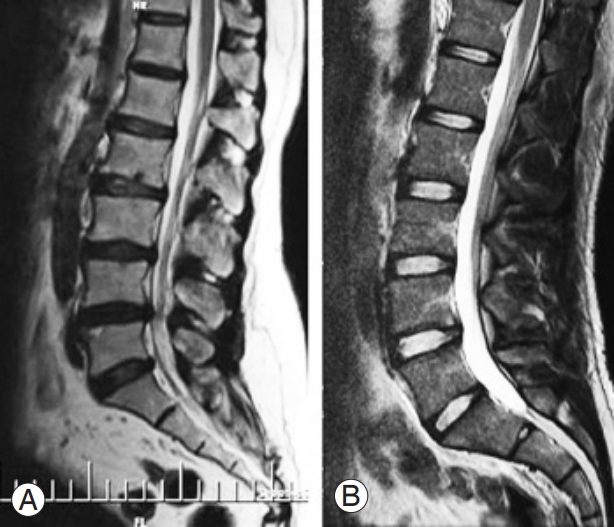
(A, B) Magnetic resonance imaging of patient 10 before and after surgery.
Discussion
In this study, we observed that the spinal fusion for AIS was accompanied with significant intervertebral disc degeneration as evidenced by an increase in the Pfirrmann grade. The magnitude of disc degeneration as measured by the MRI-based method of Pfirrmann was conversely affected by the number of fused discs. Meanwhile, the lower was the number of the segments that remained free below the lowermost level of fusion, the higher was the magnitude of disc degeneration. Many risk factors for ASD development have been identified in numerous studies, even though they are not always consistent [17]. In the current analysis, age, BMI, degree of scoliosis curvature correction, and indices of sagittal balance were not observed to be associated with the magnitude of change in the Pfirrmann grade postoperatively. Analysis of the literature suggests a strong correlation between fusion and development of intervertebral disc degeneration [18]. Although ASD may be considered part of the normal aging process and degenerative change, it could be affected by changes in the stress acting on the adjacent segment after spinal fusion [19]. Takahashi et al. [20] have observed tendencies in the sagittal plane, such as gradual increase in lumbar lordosis, anterior-upward tilting of the lowest instrumented vertebra, and posterior shift of the sagittal spinal balance. These findings may explain the accelerated degeneration we observed in the current study.
Previous studies have generally reported increasing incidence of ASD with increasing number of fused segments by the longer lever arm and stress transfer phenomenon [18,21-24]; however, other studies could not detect a significant progress in ASD [25-27]. Sears et al. [22] observed that the fusion of 3 or 4 levels confers a 3-time increase in the risk of revision surgery compared with single-level fusions. However, Ghiselli et al. [28] postulated that the incidence of adjacent segment disease decreased in patients with multi-level fusion, because the number of remaining segments decreases as the number of fused segments increases. They suggested that longer segment fusion does not necessarily result in a higher revision rate for ASP than shorter segment fusion [28]. In an in vitro biomechanical study on adjacent segment motion after a simulated lumbar interbody fusion in different sagittal alignments, Akamaru et al. [29] found that hypolordotic alignment at the fused level causes the greatest amount of flexion-extension motion at the adjacent level. However, in a load-controlled model carried out by Untch et al. [30], extending fusion across the L5–S1 level did not consistently increase the motion at the L3–L4 level [30]. Cochran et al. [3] have reported that low ASD is more likely to occur in patients with AIS in whom fusion was extended down to L4 or L5 [3]. However, in the current study, the highest degeneration changes were observed at the L2–L3 level, whereas the least magnitude of increase in Pfirrmann grade was observed at the L5–S1 level. The correction of spinal deformity with instrumentation is an established procedure in scoliosis surgery, and good clinical outcomes have been reported even on long-term evaluations. Because many patients with AIS who have a thoracolumbar/lumbar curve have rotatory kyphosis, sagittal alignment is important after anterior spinal fusion. Physiological sagittal alignment in the thoracolumbar/lumbar regions should be neutral or slightly lordotic [18]. Many risk factors encountered in lumbar disc degenerative disease include advancing age, gender, obesity, height, socioeconomic status, heavy lifting, trauma, vibration, and hereditary factors [20].
We used MRI to detect the degenerative changes after spinal fusion, which has been shown to be a sensitive method. However, the results of our study need to be interpreted in the light of its limitations. First, we did not evaluate the clinical impact of the MRI-detected degeneration we observed in this study. However, it has been shown that ASD takes a long time before it becomes symptomatic. At the time when the patients develop symptoms we might have already lost many opportunities for intervention or prevention. Second, our sample size was small; therefore, we might not have the required statistical power to capture trivial associations.
Conclusions
In conclusion, we observed that disc degeneration aggravated after spinal fusion for scoliosis. While the degree of this degeneration, as measured by Pfirrmann grade, was directly correlated with the number of fused segments, it was negatively correlated with the number of discs that remained free below the lowermost level of the fusion. Age, BMI, degree of scoliosis curvature correction, and indices of sagittal balance were not observed to be associated with the magnitude of change in the Pfirrmann grade postoperatively.
Notes
No potential conflict of interest relevant to this article was reported.