How Is Degenerative Lumbar Scoliosis Associated with Spinopelvic and Lower-Extremity Alignments in the Elderly
Article information

Abstract
Study Design
A retrospective cohort study.
Purpose
Our aim is to investigate the relationship between degenerative lumbar scoliosis (DLS), and whole-body alignment, including spinopelvic and lower extremity alignments.
Overview of Literature
DLS is a deformity commonly associated with aging. However, the correlation between whole-body alignment and DLS remains controversial.
Methods
Adult volunteers aged over 50 years were included in the study after participating in the screening program. Characteristic data and standing radiographic parameters were assessed. A propensity score model was established with adjustments for age and sex after a preliminary analysis, and cases were divided into DLS (Cobb angle >10°) and non-DLS (Cobb angle ≤10°) groups.
Results
There were significant differences in age, sex, C2 sagittal vertical axis (C2-SVA), C7-SVA, T1 pelvic angle (TPA), lumbar lordosis (LL), pelvic incidence (PI), pelvic tilt (PT), PI minus LL (PI–LL), knee angle, ankle angle, pelvic shift, C7-center sacral vertical line, L4 tilt, femur-tibia angle, and hip-knee-ankle angle (all p<0.05) using a preliminary analysis of 261 cases (75 DLS and 186 non-DLS). A one-to-one propensity score-matched analysis was used after 70 pairs of cases were selected. There were no significant differences in the characteristic data for lower extremity parameters. There were still significantly higher values of C2-SVA, TPA, PI, PT, and PI–LL in DLS group than in non-DLS group (all p<0.05).
Conclusions
This study showed an important relationship between DLS and sagittal spinal deformity. However, DLS was not associated with the sagittal and coronal lower extremity alignments.
Introduction
Adult scoliosis mainly includes degenerative scoliosis and progression of adolescent idiopathic scoliosis. The prevalence of degenerative adult scoliosis reportedly ranges from 6% to 68%, and it is increasing with the aging population worldwide [1]. The most prevalent three-dimensional deformity is degenerative adult scoliosis, specifically in the lumbar spine (degenerative lumbar scoliosis [DLS]), which common among older adults. DLS is the chronic degeneration of intervertebral discs and bones, resulting in joint instability with spinal column rotation.
Knee joint alignment is correlated for lower extremity alignment, and abnormal knee alignment potentially triggers the onset and development of knee osteoarthritis, which leads to lower extremity deformity [2,3]. Knee joint degeneration is associated with spinal sagittal malalignment [4]. Knee osteoarthritis is associated with leg length discrepancy and this leads to pelvic obliquity [5]. Pelvic obliquity compensates for lumbar scoliotic curves in patients with lumbar deformity [6]. It is therefore important to investigate the relationship between DLS and lower extremity alignment in elderly population.
Several studies reported that patients with DLS had poor spinopelvic sagittal alignment [7,8]. The lower extremities are recruited to compensate for spinopelvic alignment to maintain trunk alignment [9]. However, it is still unclear whether the lower extremity alignment compensates for sagittal spinopelvic malalignment associated with DLS. Aging and sex are the main risk factors for poor spinopelvic and lower extremity malalignment [10,11]. Our aim is to clarify the relationship between DLS and whole-body alignment including spinopelvic and lower extremity alignments using a propensity score-matched analysis for the adjustment of baseline data. We hypothesized that DLS would be associated with spinopelvic and lower extremity malalignments.
Materials and Methods
1. Study design
The study was approved by the institutional review board of Hamamatsu University School of Medicine, University Hospital (IRB no., 16-115). A total of 279 adult volunteers participated in the 2018 Health Screening Program in Toei (Aichi, Japan) (Fig. 1). Written informed consents were obtained from all volunteers. Written informed consent for the publication of images in Fig. 2 was obtained from the volunteers. Subjects were recruited as follows: (1) cases with full-length radiographs of the spine and lower extremities, (2) those aged ≥50 years. The exclusion criteria were as follows: history of hip, knee, or spinal surgery.
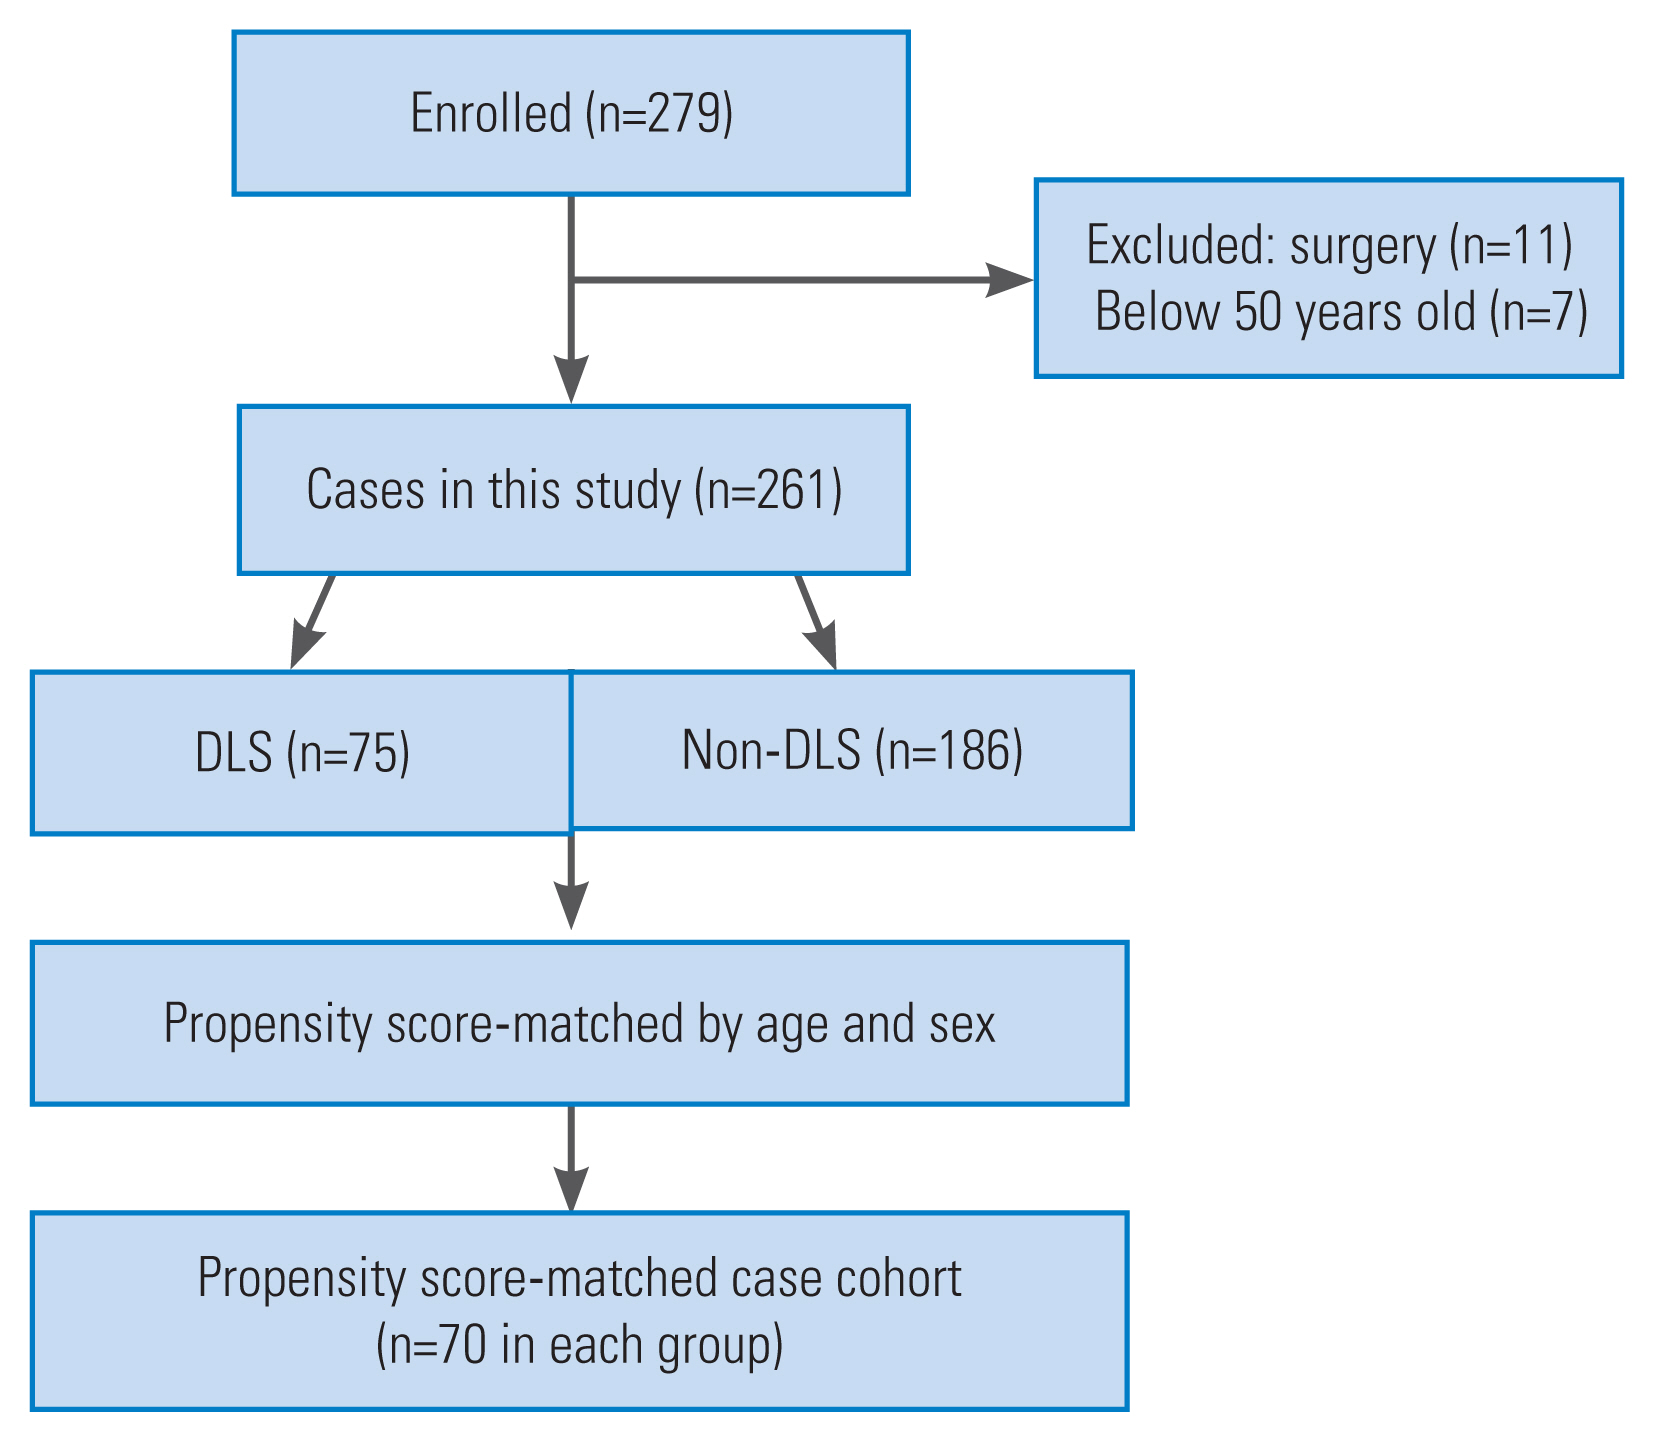
Study design. DLS, degenerative lumbar scoliosis.

(A–C) Radiographic measurements of coronal parameters. FTA, femur-tibia angle; HKA, hip-knee-ankle; mLDFA, mechanical lateral distal femoral angle; mMPTA, mechanical medial proximal tibia angle; mLDTA, mechanical lateral distal tibia angle; FLD, functional leg-length discrepancy; POA, pelvic oblique angle; DLS, degenerative lumbar scoliosis.
2. Data collection and radiographic parameters
The following individual demographic characteristics were evaluated: age, sex, height, body weight, body mass index, femoral neck bone mineral density (BMD), lumbar BMD, and grasping power. The Oswestry Disability Index (ODI) was evaluated to determine the health-related quality of life (HRQOL) associated with low back pain [12]. The 25-question Geriatric Locomotive Function Scale (GLFS-25) was evaluated to assess the risk of locomotive syndrome including muscle weakness, joint or spine disorders and osteoporosis, knee pain, and low back pain [13]. Furthermore, low back and knee pain were measured using a questionnaire; subjects were requested to mark the pain intensity on a diagram of the body surface on a scale of 1–10, with 0 representing “no pain” and 10 representing “severe pain,” and data regarding the knee and lower back areas were selected.
Lateral and anteroposterior radiographs of each case were taken in a free-standing position with their fingers resting on their clavicles. Furthermore, radiographs were obtained at 1.5 m between the X-ray tube and radiograph [14,15]. The following sagittal spinopelvic and lower extremity radiographic parameters were assessed in the radiographs: C2-sagittal vertical axis (C2-SVA), C7-SVA, T1 pelvic angle (TPA), cervical lordosis, thoracic kyphosis, lumbar lordosis (LL), pelvic incidence (PI), pelvic tilt (PT), sacral slope (SS), PI minus LL (PI–LL), knee angle (KA, angle between the femoral and tibial mechanical axes) [16], ankle angle (AA), and pelvic shift (PS). Coronal spinopelvic and lower-extremity radiographic parameters were included (Fig. 2): C7-center sacral vertical line (C7-CSVL, the distance between the C7 plumb line and center sacral vertical line); Cobb angle of DLS (measured by Cobb method; the range of curve apex is from T10 to L5); L4 tilt; pelvic oblique angle (POA, the angle of intersection between the line connecting the most proximal points of the iliac crests and the horizontal line measured on standing anteroposterior radiographs) [17]; functional leg-length discrepancy (FLD, the height between the left and right femoral horizontal lines; a horizontal line is defined as the line tangent to the top of the highest portion of the femoral head) [18]; femur-tibia angle (FTA, the average of the left and right FTAs; the lateral angle at the intersection of the femoral and tibial bone axes) [19]; the hip-knee-ankle angle (HKA angle, the average of the left and right HKA angles; the lateral angle between the femoral and tibial mechanical axes), mechanical lateral distal femoral angle (mLDFA, the average of the left and right mLDFAs; the lateral angle between the femoral mechanical axis and distal femoral joint line), the mechanical medial proximal tibia angle (mMPTA, the average of the left and right mMPTAs; the medial angle between the tibial mechanical axis and proximal tibial joint line), the mechanical lateral distal tibia angle (mLDTA, the average of the left and right mLDTA, the angle between the tibial mechanical axis and distal tibial joint surface), and discrepancy of leg length. All parameters were measured using Surgimap Spine software (Nemaris Inc., New York, NY, USA).
The subjects were divided into the following two groups based on radiographic data once all the data were collected: DLS group (Cobb angle of DLS >10°) and non-DLS group (Cobb angle of DLS ≤10°).
3. Statistical analysis
We compared baseline data between DLS and non-DLS groups as a preliminary analysis. A one-to-one matching model analysis using propensity scores was performed because of significant differences in baseline between groups. Age and sex were included in the multivariate logistic regression model to calculate the propensity score for the presence of DLS. The C-statistic was calculated to evaluate the accuracy of fit. We compared data between matched non-DLS and DLS in subsequent analyses.
Statistical analysis was performed using IBM SPSS software ver. 25.0 (IBM Corp., Armonk, NY, USA). Mean values and standard deviations were calculated for demographic parameters. Independent t-tests were used to compare continuous variables between groups. Categorical variables were analyzed using the chi-square or Fisher’s exact test. Statistical significance was set at p<0.05.
Results
1. Analysis of the whole cohort
The study design is shown in Fig. 1. This cohort study initially comprised of 279 cases. Of the 279 cases, 18 were excluded due to a history of surgery (n=11) and age below 50 years (n=7). The remaining 261 cases (75 DLS and 186 non-DLS cases) met our inclusion criteria. The baseline characteristic data are presented in Table 1. The DLS cases were significantly older (p<0.001) and had significantly lower height, body weight, and grasping power (p<0.001, p=0.002, and p=0.005, respectively). DLS cases had a significantly lower proportion of males compared to the non-DLS cases (p=0.010).
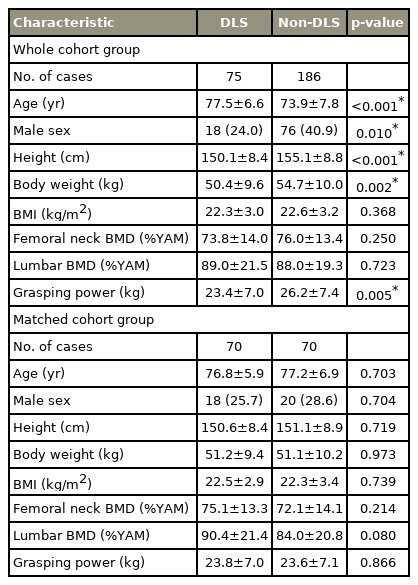
Comparison of baseline characteristic data between DLS and non-DLS cases
The sagittal radiographic parameters between the DLS and non-DLS cases are summarized in Table 2. The C2-SVA, C7-SVA, TPA, PI, PT, PI–LL, KA, AA, and PS, which shows those in the DLS cases were significantly higher than the non-DLS cases (all p<0.05). The DLS cases had significantly lower values of LL and SS (p<0.001 and p=0.004, respectively). The coronal radiographic parameters between the DLS and non-DLS cases are shown in Table 3. The C7-CSVL, Cobb angle of DLS, L4 tilt, FTA, and HKA in the DLS cases were significantly higher than in the non-DLS cases (all p<0.05).
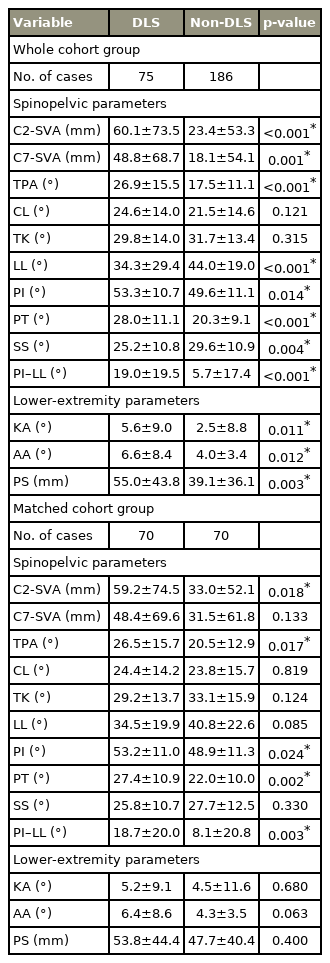
Comparison of sagittal radiographic parameters between DLS and non-DLS cases

Comparison of coronal radiographic parameters between DLS and non-DLS cases
The HRQOL and pain scores are shown in Table 4. ODI and GLFS-25 scores were significantly higher in the DLS cases than in the non-DLS cases (p=0.038 and p=0.046, respectively). However, low back pain and knee pain scores did not differ between the DLS and non-DLS cases.

Comparison of health-related quality of life or pain scores between DLS and non-DLS cases
2. Analysis of the matched cohorts
DLS and non-DLS groups were selected through one-to-one propensity score-matched analysis for 70 pairs of cases. The C-statistic for the propensity score model was 0.692 (95% confidence interval, 0.622–0.762; p<0.001). The baseline data, radiographic parameters, and HRQOL in propensity score-matched patients are shown in Tables 1–4. In terms of baseline data and coronal radiographic parameters after analysis, there were no significant differences between the DLS and non-DLS groups, except for Cobb angle of DLS and L4 tilt (p<0.001 and p<0.001, respectively). DLS group had significantly higher values of C2-SVA, TPA, PI, PT, and PI–LL compared to the non-DLS group (all p<0.05) in terms of sagittal spinopelvic radiographic parameters. Sagittal lower extremity parameters were not significantly different between the two groups. However, there was a tendency for the mean values of KA, AA, and PS to be higher in the DLS group compared to the non-DLS group.
Discussion
The prevalence of DLS was 28.7% among community-dwelling adult volunteers, similar to the previous study [12]. However, the prevalence of DLS in our result was higher than in other regions or ethnicity (13.3%) [20]. DLS group had poor whole-body alignment, including spinopelvic and lower extremity alignments which is the pre-matched result of this study. Compared to non-DLS group, ODI and GLFS-25 scores were significantly higher in DLS group; however, there were significant differences in age and sex between groups. Therefore, after propensity score-matched analysis for the adjustment of baseline data, the results were more credible. We found that DLS was accompanied by sagittal spinopelvic malalignment, which was shown by high C2-SVA, TPA, PI, PT, and PI–LL. DLS did not affect the coronal spinopelvic alignment except for the L4 tilt. There was no significant difference in the coronal and sagittal lower extremity alignments between DLS and non-DLS groups. Furthermore, there was no relationship between DLS and HRQOL or pain scores.
Spinal sagittal alignment involves a concordant relationship between the cranium, spine, and pelvis [21]. We mainly investigated the relationship between DLS and sagittal spinopelvic alignment. Although there were significant differences for SVA, TPA, LL, PI, PT, PT, SS, and PI–LL between groups, when we excluded the bias of age and sex, there were still significantly higher values of C2-SVA, TPA, PI, PT, and PI–LL in DLS group. It has been reported that the DLS group had a higher SVA, PI, and PT, and SVA was significantly correlated with PT in the DLS group [8]. Our results were consistent with these findings. DLS is associated with pelvic morphology and sagittal spinopelvic deformity. However, KA, AA, and PS showed a trend towards larger values in the DLS group. If the number of DLS cases or the degree of deformity increases, the lower limbs may compensate for the sagittal spinopelvic malalignment.
DLS is a coronal deviation of the spine and volunteers with a larger Cobb angle of DLS tend to have a larger L4 tilt with resultant asymmetry in disc degeneration and spinal instability [12,22]. Our result was consistent with this finding. The DLS is associated with C7-CSVL, which is used to evaluate coronal global spinopelvic alignment, and C7-CSVL could predict DLS progression [12]. Pelvic obliquity is a compensatory phenomenon of degenerative scoliosis [6]. However, in our study, there was no significant difference in C7-CSVL, POA, and FLD between DLS and non-DLS groups. Possible thoracolumbar scoliosis compensates for the curve of DLS resulting spinopelvic alignment, and progressive DLS is associated with coronal global spinopelvic malalignment. It is therefore important to have a long-term prospective study, which includes thoracolumbar scoliosis, and to evaluate the relationship between the progression of DLS, and coronal spinopelvic alignment.
Lumbar degenerative pathologies result in pelvic retroversion and sagittal malalignment when pelvic compensation is insufficient to compensate for the loss of sagittal alignment. The lower extremities are recruited to compensate for spinopelvic alignment to maintain trunk alignment [9]. DLS is associated with spinopelvic malalignment, but it is still unclear whether the lower extremities compensate for sagittal spinal malalignment associated with DLS. In our result, the values of KA, AA, and PS were significantly higher in the DLS group than in the non-DLS group. There were no significant differences in KA, AA, and PS between groups after propensity score-matched analysis. Pelvic compensation is probably enough to compensate for the loss of sagittal alignment in the DLS group.
It has been proven that the increased varus at the knee joint in the coronal lower extremity compensates for coronal spinal decompensation in patients with adolescent idiopathic scoliosis [23]. The coronal spinal deformity correction improves coronal lower extremity alignment in patients with adult spinal deformity [24]. Those studies showed that coronal spinal malalignment was associated with lower extremity deformity in both young and adult patients with spinal deformity [23,24]. FTA is used to assess knee alignment in the coronal plane. Knee deformity increases the stress on articular cartilage, resulting in knee osteoarthritis [2,3]. The HKA angle indicates mechanical alignment from the center of the femoral head to the center of the ankle, and HKA-angle distribution is different between normal and knee osteoarthritis cases [25]. Yasuda et al. [4] reported there was poor sagittal spinopelvic alignment in knee osteoarthritis cases. Changes in PI–LL were associated with changes in FTA in over 22 years of follow-up as previously reported [19]. There were a few studies that reveal the relationship between DLS and coronal lower extremity alignment in elderly cases. There were significantly higher values of FTA and HKA in the DLS group in our study. There was no significant difference in FTA and HKA between groups after propensity score-matched analysis. To summarize, DLS is not associated with the coronal lower extremity alignment by the adjustment of age and sex. Elderly women are more likely to have knee osteoarthritis, resulting in lower limb deformity [11]. Age and sex might be the main reasons that significantly affect the coronal lower extremity alignment. Besides, the DLS cases in this study were all volunteers, and there was not severe coronal malalignment in the DLS group compared to previous studies [23,24].
Spinal deformity has a significantly debilitating effect on HRQOL. The ODI, a self-completed questionnaire on function, pain, and health status limitations [26,27], has been used to evaluate the functional outcomes in patients with degenerative scoliosis [28]. As ODI deterioration was significantly greater in the progressive DLS group than that in the non-progressive DLS group, progression of DLS impact on patients’ HRQOL [12]. ODI and GLFS-25 scores in the DLS group were significantly higher than those in non-DLS group in our study. There was no significant difference in ODI and GLFS-25 between groups after a propensity score-matched analysis. Low back pain scores were not significantly different between groups, which was consistent with the previous report [22]. We also evaluated knee pain scores, and there was no correlation between DLS and knee pain. A few studies reported that loss of LL showed worsened HRQOL results in patients with DLS [12,29]. HRQOL is affected not by DLS but mainly by sagittal spinopelvic malalignment. Therefore, DLS cases with worsened HRQOL need to give priority to the assessment of sagittal spinopelvic alignment among whole-body alignment in daily clinical practice. If surgery is required, the surgeons should perform primarily sagittal spinopelvic alignment correction to improve HRQOL in DLS patients with sagittal spinopelvic malalignment.
The limitations of the study were: first, our study’s sample size was small, and only Japanese subjects were available. There was no significant difference regarding sample size compared with previous reports, and the sample size was statistically enough to assess risk factors of DLS. These results might improve the understanding of age-related changes in other populations since Japan has the highest percentage of elderly people. Second, as the objects in our study were community-dwelling volunteers, the Cobb angle of DLS was mild or moderate, and the severe DLS was few. The relationship between DLS and lower extremity alignment might be different in patients with severe DLS. Further prospective longitudinal studies are mandatory to better understand the etiology of DLS and the impact on patients’ HRQOL.
Conclusions
The etiology of DLS is a significant concern in spinal deformity. This study showed an important relationship between DLS and sagittal spinal deformity Using propensity score-matched analysis. However, DLS was not associated with the sagittal and coronal lower extremity alignments, HRQOL, and pain scores.
Acknowledgments
We sincerely thank for hospital staff in Toei, and express their sincere gratitude to Ms. Nao Kuwahara, Tomoe Mabuchi, Mrs. Taku Nagao, and Tomokazu Suzuki, secretaries in the Department of Orthopedic Surgery, Hamamatsu University School of Medicine. The authors also would like to thank Editage (www.editage.com) for English language editing.
Notes
Conflict of Interest
Yu Yamato and Shin Oe work at a donation-endowed laboratory and are funded by Medtronic Sofamor Danek Inc., Japan Medical Dynamic Marketing Inc., and Meitoku Medical Institution Jyuzen Memorial Hospital. For the remaining authors, no potential conflict of interest relevant to this article was reported. The submitted manuscript does not contain information about medical devices/drugs.
Author Contributions
Conception and design: JW, HU, YY; acquisition of data: JW, HU, YY, KI, TH, GY, TB, SO, HA, YM, YW, KN, KK, HH; analysis of data: JW, HU; drafting the article: JW, HU, YY; critically revising the article: HU, YY; reviewed submitted version of manuscript: JW, HU, YY, KI, TH, GY, TB, SO, HA, YM, YW, KN, KK, HH, YM; study supervision: YY, YM; and final approval of the manuscript: all authors.