Development of a Unique Mouse Intervertebral Disc Degeneration Model Using a Simple Novel Tool
Article information
Abstract
Study Design
Animal case control study.
Purpose
To create a simple, reproducible disc degeneration model for mouse coccygeal vertebrae.
Overview of Literature
Back pain due to disc degeneration is probably the most common problem encountered in neurosurgical practice. An easily reproducible animal model for disc degeneration will help in understanding its pathophysiology, and serve as a platform for examining various therapeutic options.
Methods
A total of 18 mice were divided into injured (n=12) and non-injured (n=6) groups. The disc height index (DHI%) at coccygeal 4–5 level was measured by computed tomography (CT) scan for all mice. Coccygeal 4–5 discs of the injury group were injured using a 32G needle fixed to a novel tool and confirmed by CT. The non-injury group underwent no procedure. DHI% was measured by CT at 2-, 4-, and 6-week post-injury, and all mice tails were sectioned for histopathology grading of disc degeneration at the respective time intervals.
Results
The injured group showed significant variation in DHI% at 2, 4, and 6 weeks, whereas there was no change in the non-injured group. Histopathologic evaluation with Safranin O stain showed a worsening of the disc degeneration score at 2, 4, and 6 weeks in the injured group, but in the non-injured group there was no change. Percutaneous needle injury technique with our novel tool provided 100% accuracy and uniform degeneration.
Conclusions
A simple, easily reproducible mouse model for disc degeneration was created using a simple, cost-effective, novel tool and technique, its advantage being high precision and user friendly.
Introduction
Degenerative disc disease is a very common problem encountered in current practice. Various therapies focus on alleviating the symptoms, rather than correcting the pathology, e.g., bed rest, analgesics, physiotherapy, surgery, and artificial disc replacement [1,2]. Stem cell therapy for various diseases has been attempted, with promising results [3,4]. However, there are no proven regenerative therapies available for complete disc restoration. We require a human representative animal disc degeneration model, not only in order to study the varied pathological changes of the disc, but also to explore different therapeutic options. Over the years, various small and large animal disc degeneration models have been created, but the techniques used are inconsistent, and the outcomes are not identical to human disc degeneration [5]. Even models closest to the human disc [6,7] lack ideal technique and uniform reproducibility [8]. Hence, the need for a simple and superior animal model persists. We introduce a novel technique and tool for creating a mouse disc degeneration model which is simple, uniform, and easily reproducible.
Materials and Methods
This study was conducted in compliance with the principles of the Declaration of Helsinki. The study’s protocol was reviewed and approved by the Institutional Review Board of Christian Medical College, Vellore (IRB approval no., 9263) and received institutional animal ethics committee clearance (IAEC-1/2015).
1. Novel tool design
In order to create a disc injury, a novel tool was developed, using the stage and coarse adjustment of a light microscope (used in histopathology); to which a glass slab and a 32G needle syringe holder were attached (Fig. 1A). The glass platform was fixed to the microscope base and a groove was made for the mouse tail to fit in. To immobilize the tail, a clamp with multiple open slots were designed, so that the needle could pass through it (Fig. 1B). The syringe holder was attached to a height-adjustable microscope stage capable of three-directional movement using three different available microscope knobs. The mobile syringe holder with needle assisted in aiming directly over the marked point on a fixed tail. As shown (Fig. 1B), vertical motion (z-axis) of the needle was possible with the coarse and fine adjustment knobs of the microscope stage, which helped in achieving a controlled penetration of the needle into the disc space. For good visibility, an external light source and a magnifying glass were placed adjacent to the microscope during the procedure.
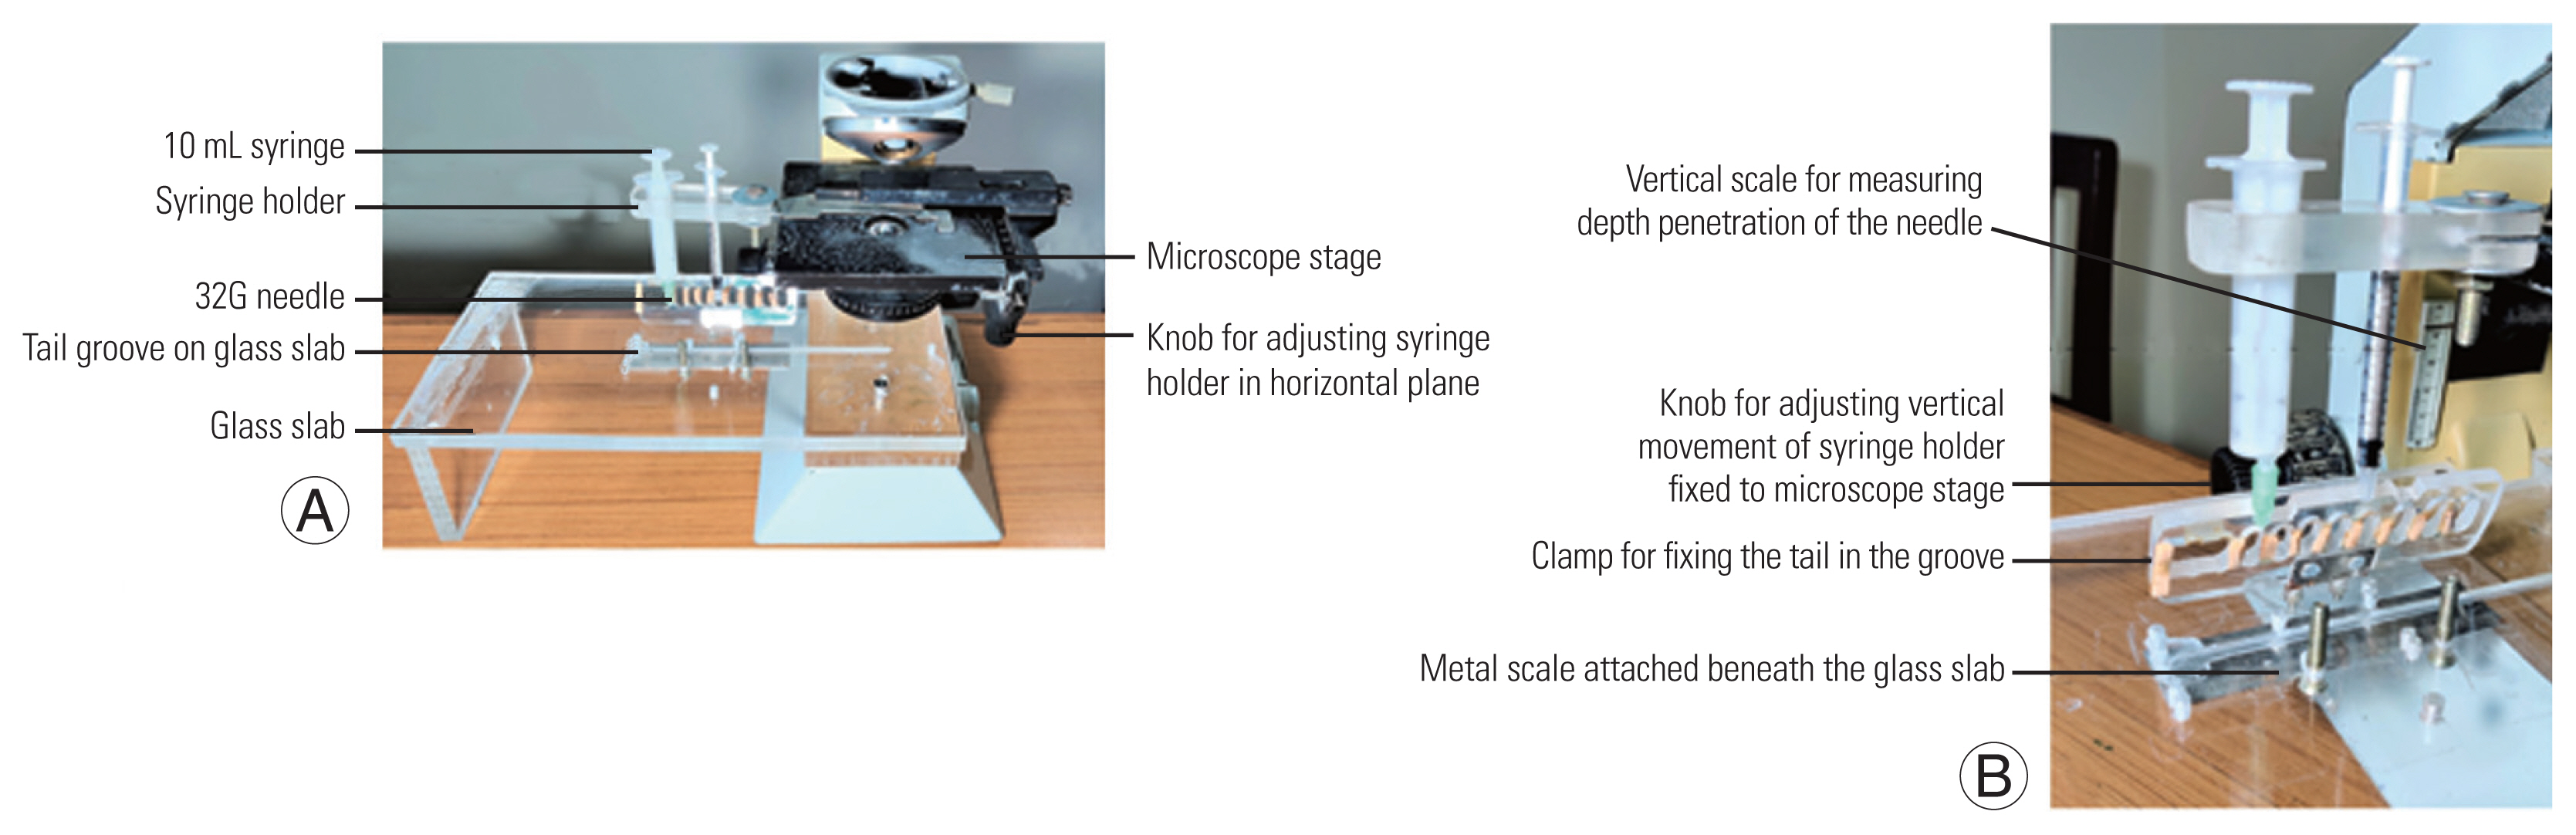
(A) Novel tool design with a glass slab attached to light microscope body used in histopathology. There is a syringe holder containing a 32G needle attached to the microscope stage which can be moved in vertical and horizontal planes by the knobs. On the glass slab there is a groove for the tail to fit in and a clamp to immobilize it. (B) Oblique view of the novel tool displaying vertical scale, knob, tail clamp fixed to glass slab, and a metal scale beneath it.
2. Disc injury technique
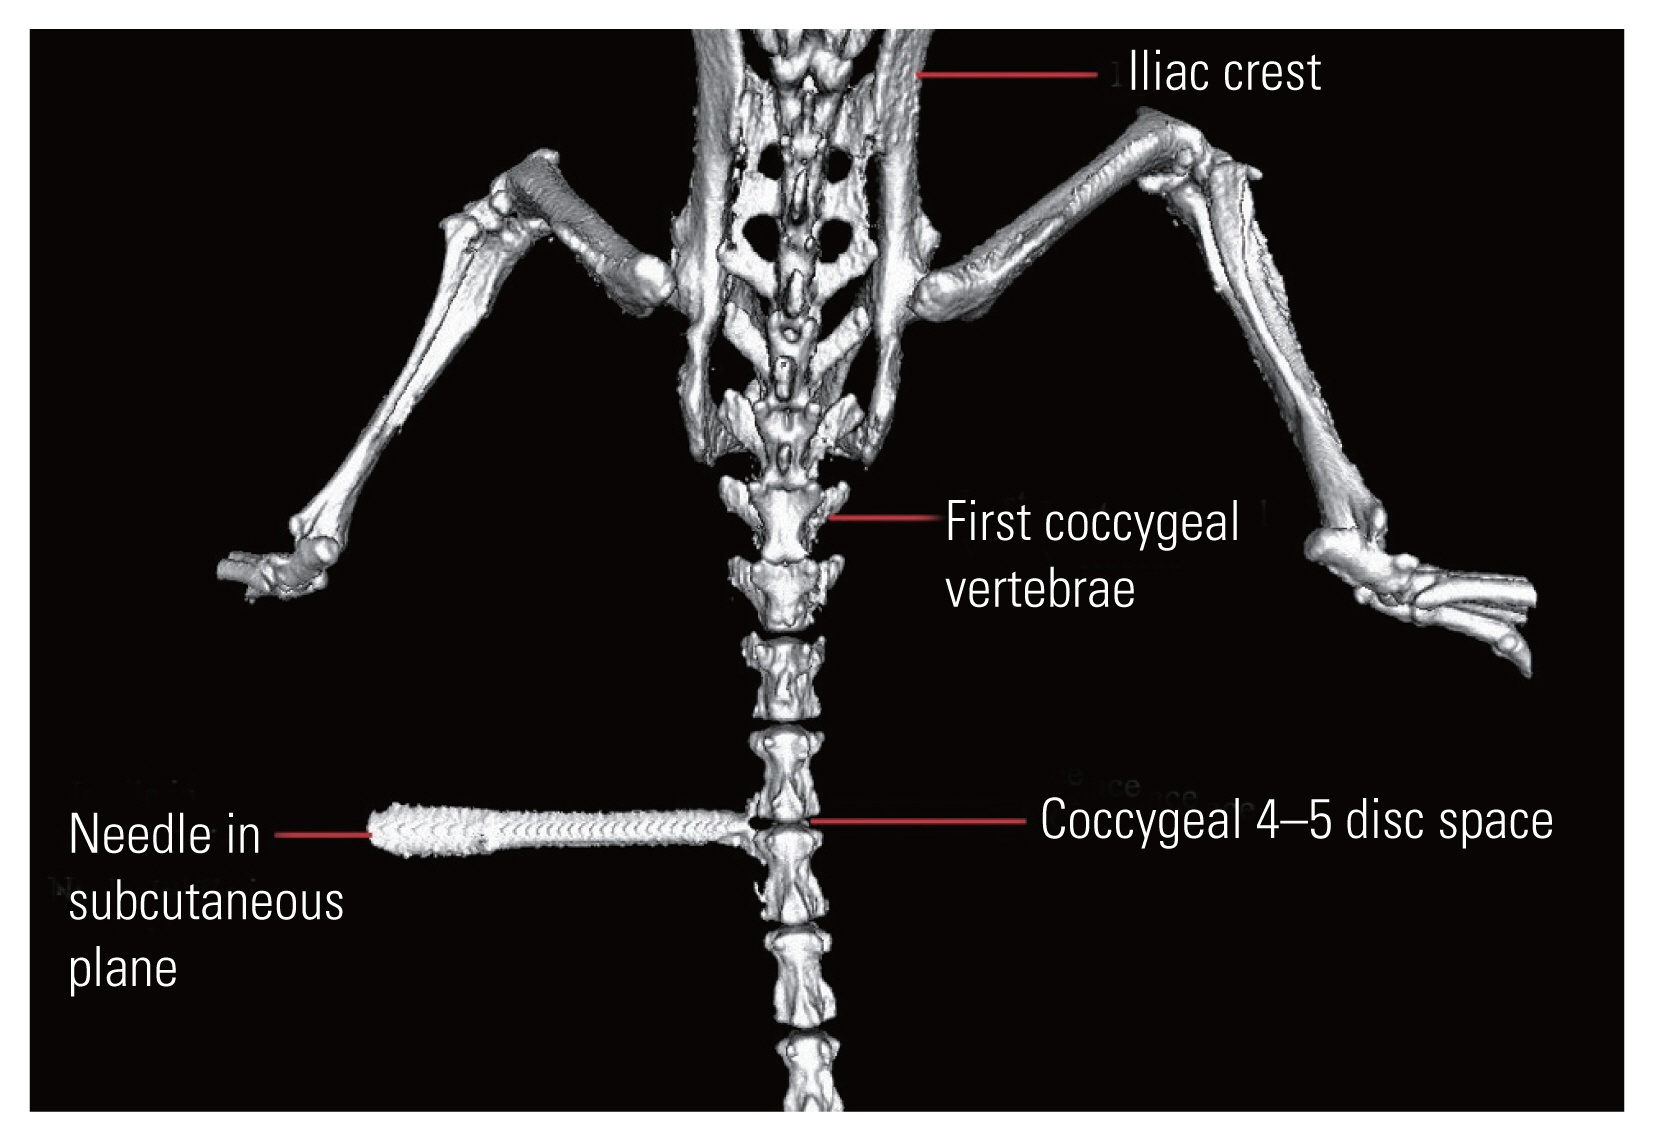
A total of 18 C57BL6 mice, aged 10 weeks, were selected, and were divided into injured (n=12) and non-injured (n=6) groups. Each animal was anaesthetized with an intra-peritoneal injection of Ketamine (180 μL/100 g, 1 mL=50 mg) and Xylazine (50 μL/100 g, 1 mL=20 mg). All underwent a high-resolution computed tomography (CT) scan of the coccyx at the coccygeal 4–5 level, with subcutaneous needle attachment on one side (Fig. 2). The CT confirmed level was marked on the dorsum of the tail with a skin marker. The pre-injury disc height index (DHI) was measured as shown in (Fig. 3).
Computed tomography-guided localization of the coccygeal 4–5-disc level by the needle.
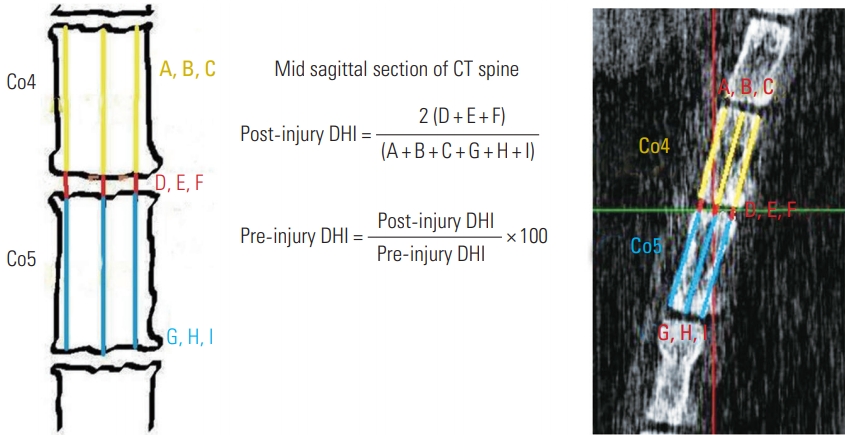
How to measure disc height index on mid sagittal section of computed tomography (CT) coccygeal (Co) spine and the formula to calculate the change in disc height index (DHI, %).
Twelve mice were injured, and each one was placed on the extended glass platform of the microscope, with its tail snug and immobilized in the groove with the clamp (Fig. 4A). Three-directional control of the syringe holder was used to precisely localize the needle over the marked area on the tail. The syringe holder (with 32G needle attached) was then lowered using the coarse adjustment knob of the microscope stage and penetrated to a depth of 2 mm into the disc. Post-penetration, the needle hub was detached from the syringe, the syringe holder rotated up, and the needle was left in the disc space (Fig. 4B). To confirm the needle position in the disc space, a CT scan was done (Figs. 4C, 5). The mice were kept for 2-, 4-, and 6-week duration post-injury (four mice for each duration).
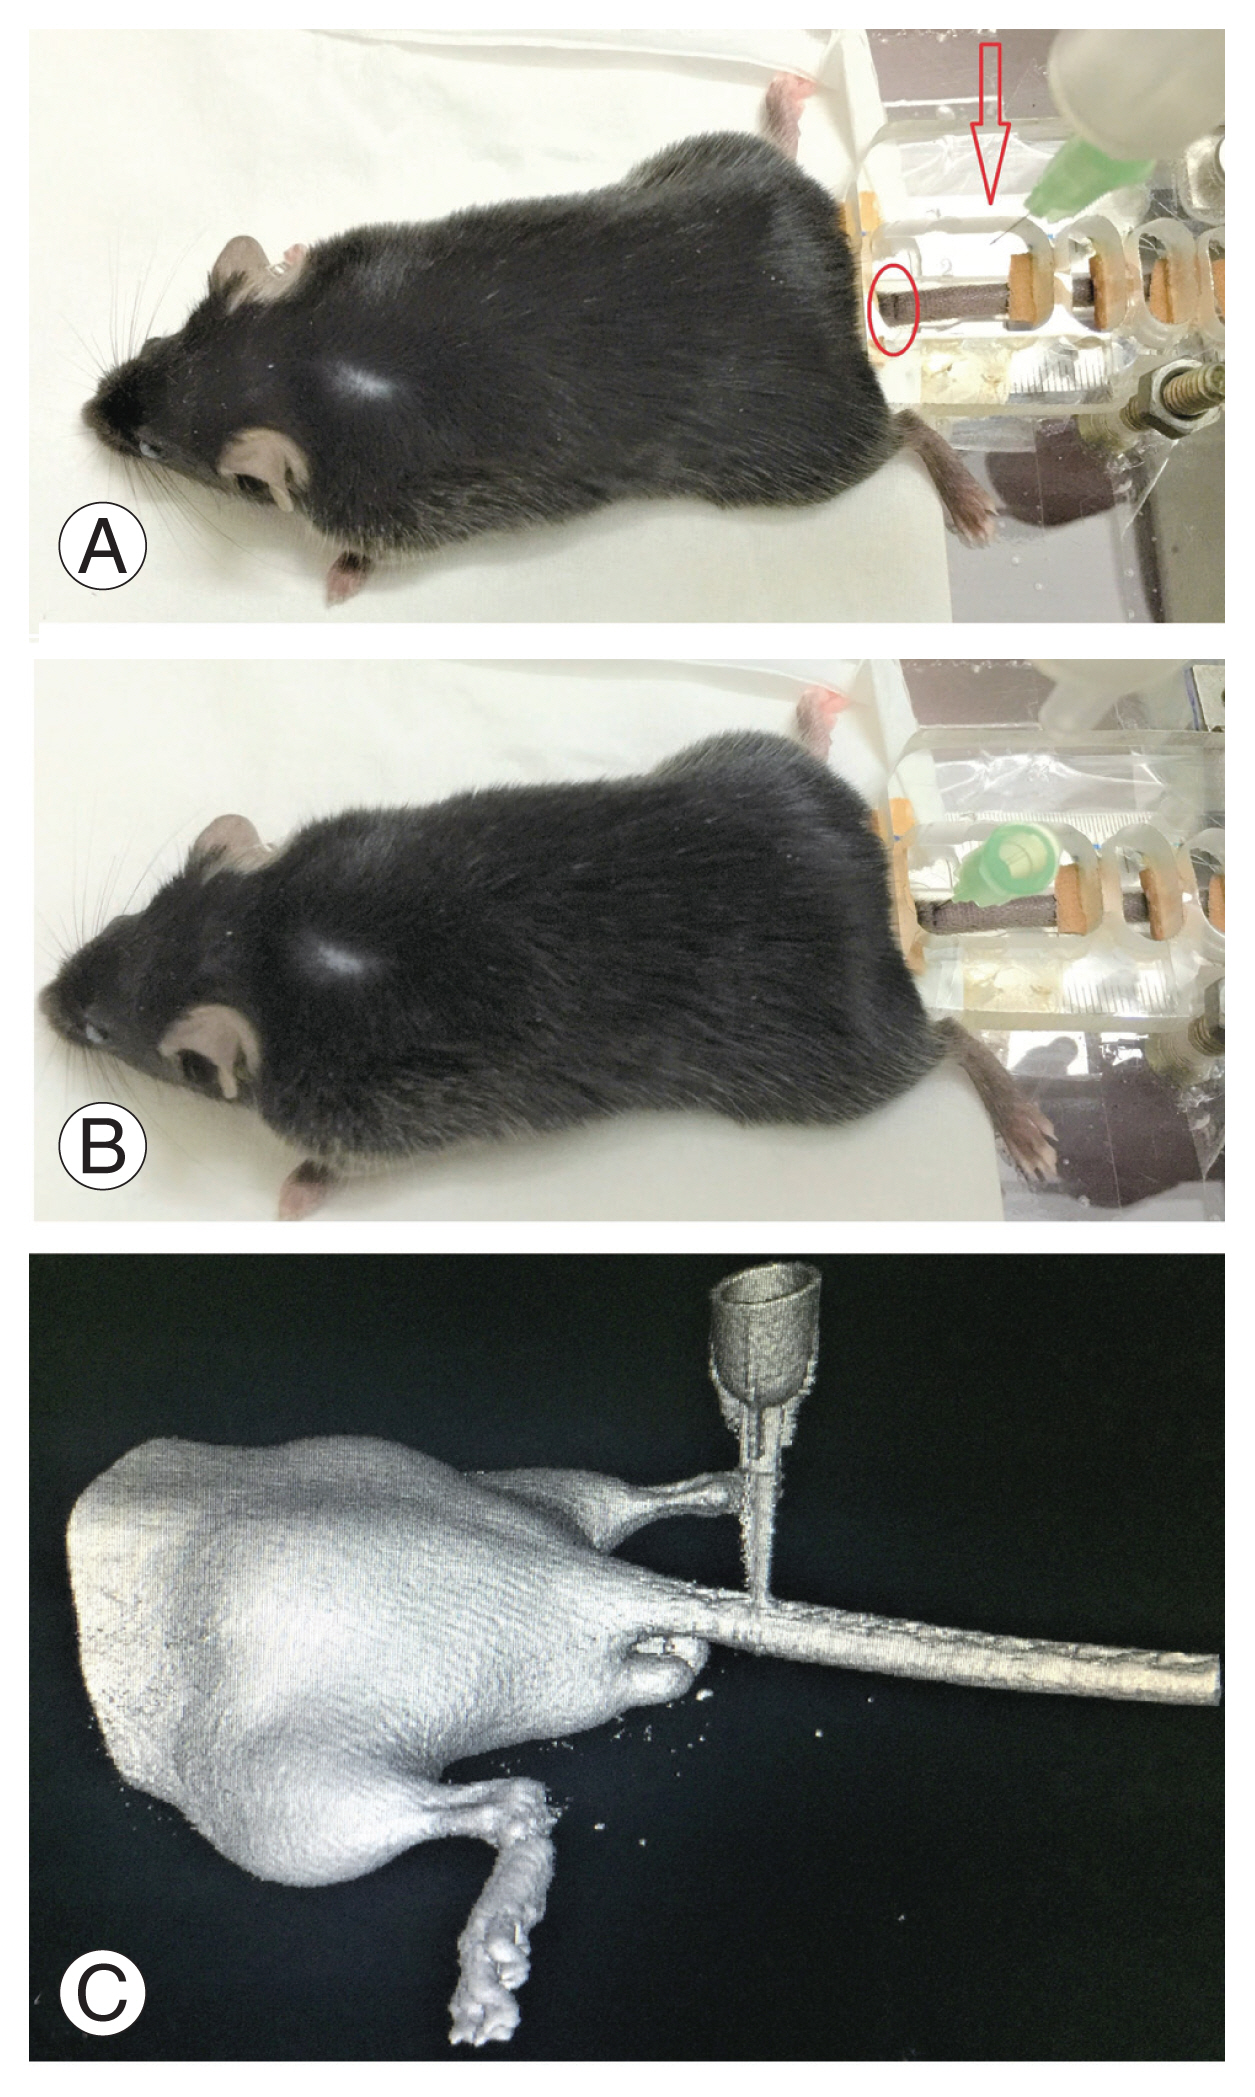
The methodology of creating computed tomography. (CT)-guided needle injury (A, B) and confirming placement of the needle at the correct level (coccygeal 4–5) with the help of three-dimensional CT (C). Arrow indicates needle tip; oval represents surface marking over the tail.
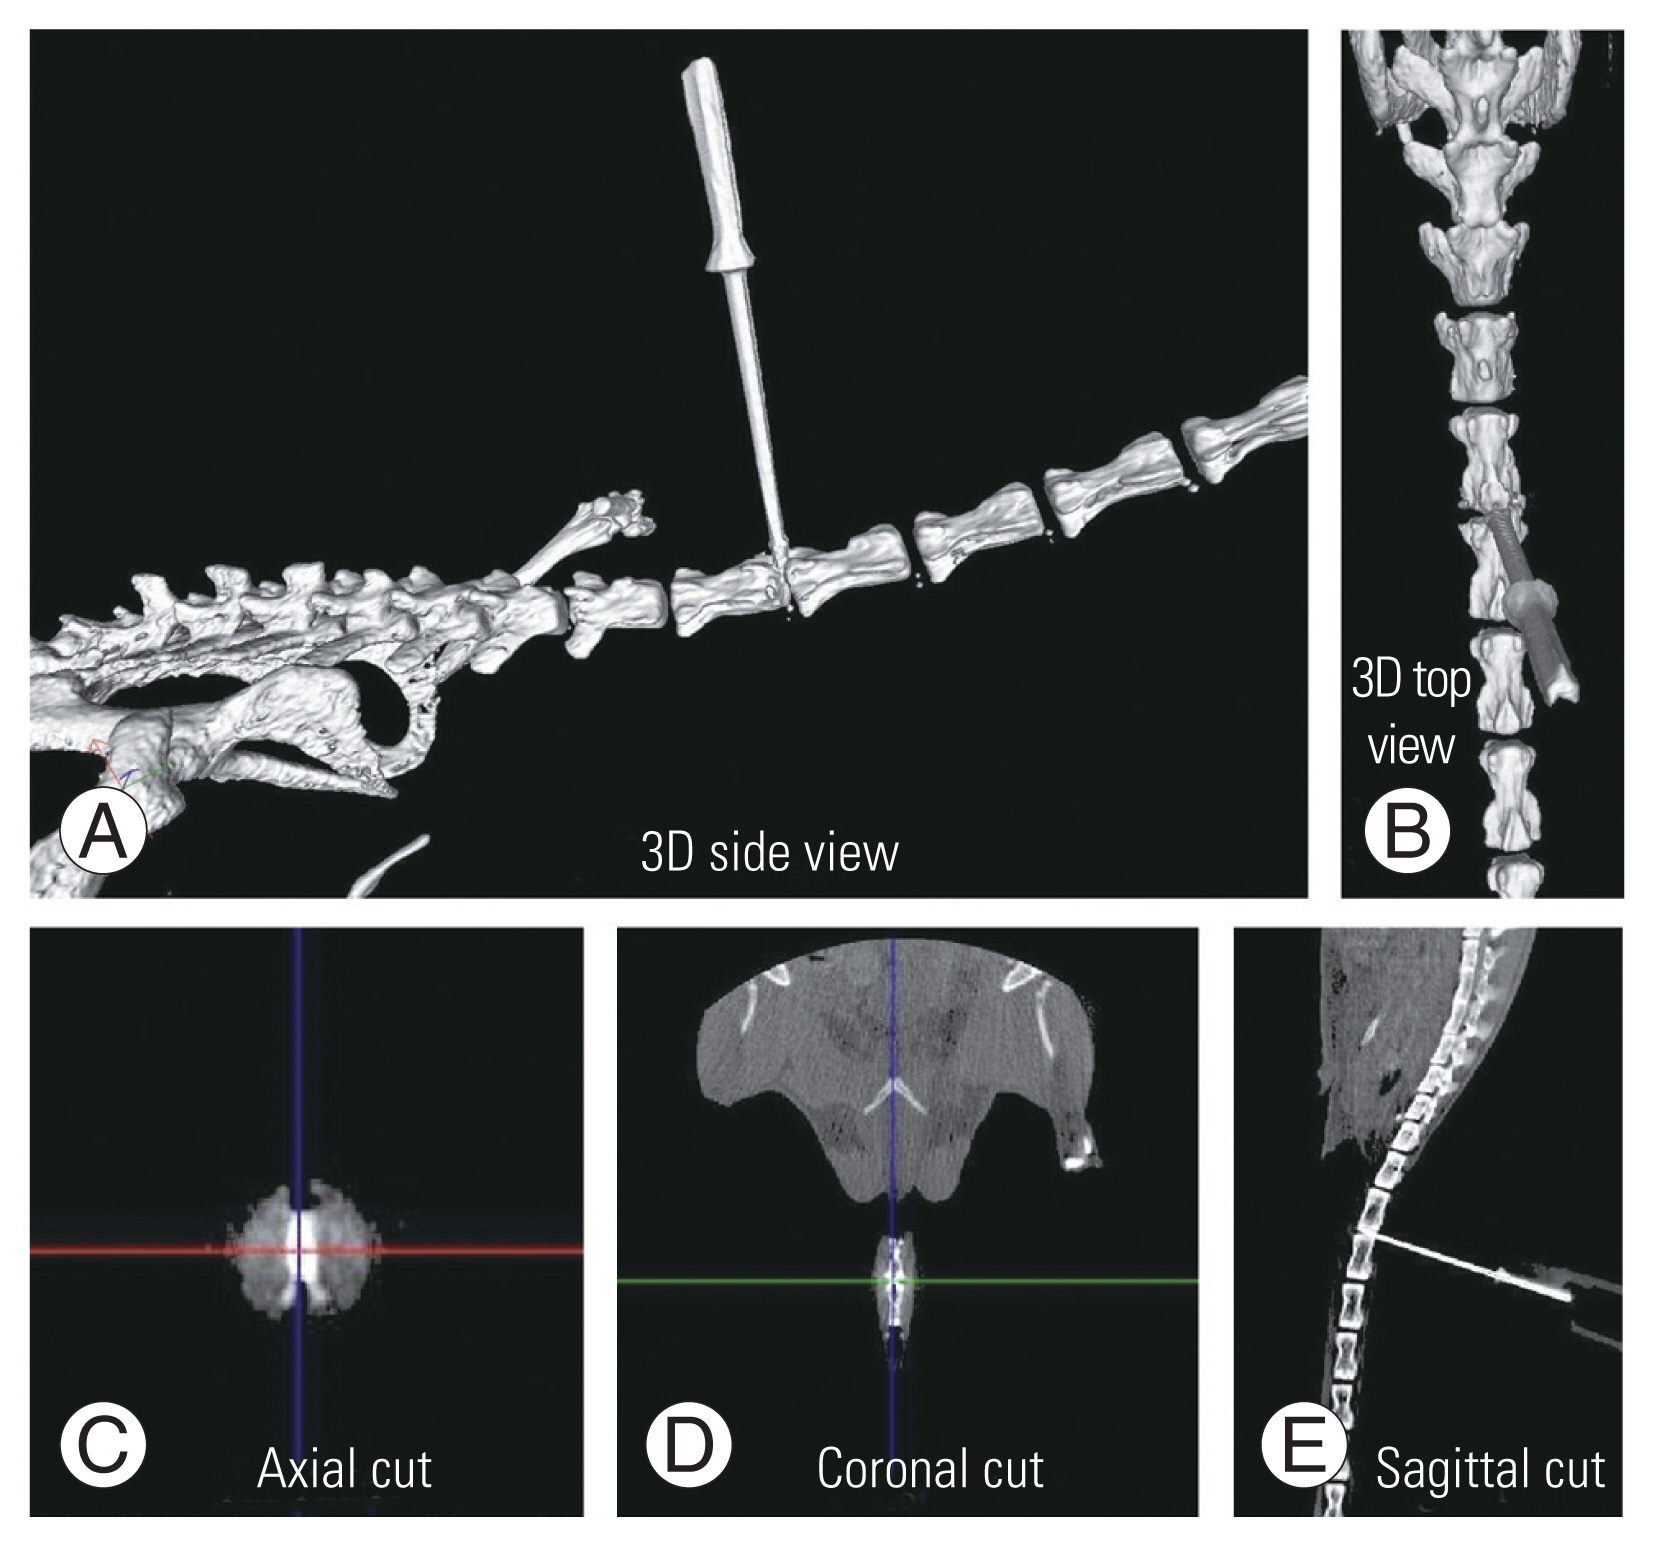
(A–E) Three-dimensional (3D) computed tomography, axial, coronal, and sagittal images of the mouse confirming the accurate placement of the needle in the disc.
3. Post-injury computed tomography and histology
Post-injury DHI was measured using CT at 2 weeks (four mice), 4 weeks (four mice), and 6 weeks (four mice). The change in DHI% was calculated based on pre- and post-injury values using the formula shown (Fig. 3). Following CT, the tails were sectioned and sent for histology staining as described below.
Harvested mouse tail segments were fixed with 10% neutral buffered formalin for 1 week, and then decalcified in 22.5% formic acid and 10% sodium citrate for 3 days. The material was processed for paraffin embedding, and sagittal sections of 4-μm thickness were then obtained using a microtome.
Hematoxylin and Eosin, Safranin O, and Sirius Red stains were employed to stain the sections. Safranin O was used for detection of cartilage regeneration and Sirius Red stained sections (viewed with polarized light) for orientation of collagen fibers in the annulus fibrosus (AF). The disc degeneration scoring system of Masuda et al. [9] was applied to grade the degeneration (Table 1). In this system, a normal disc is assigned a score of 4, while a score of 12 indicates severe degeneration.
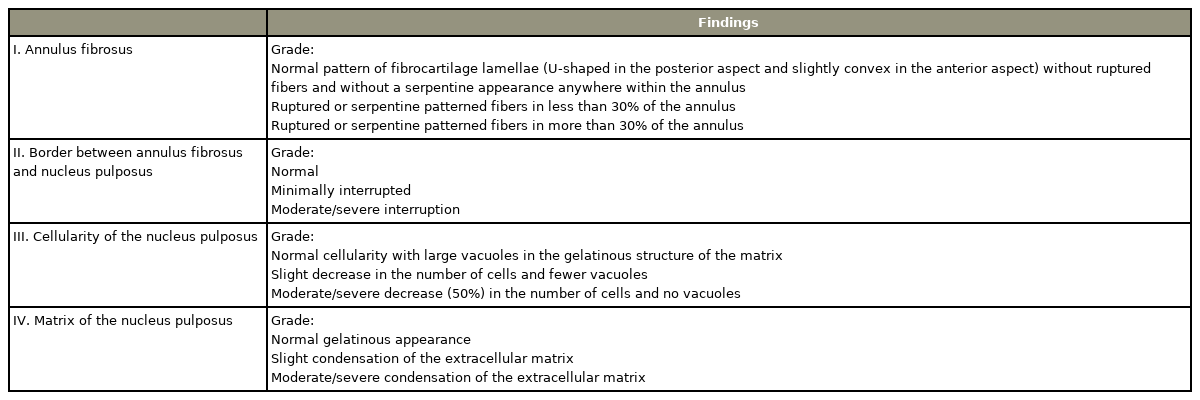
Masuda disc degeneration score based on histopathology findings
Results
1. Accuracy and ease of novel tool
Aiming of the needle to a CT-guided marked point on the tail was extremely easy and quick with the help of our tool. The tail had good fit and immobilization in the groove. Needle penetration into the disc space was very accurate (100%), and there were no instances of penetration at an incorrect level, or missed disc space. A controlled depth penetration of 2 mm was achieved, and in no case did the needle pass through ventrally. With the aid of the tool, creation of disc injury with a 32G needle was simple, accurate, and reproducible.
2. Computed tomography findings of disc height index
The preoperative DHI was 0.4 mm, and at 2 weeks post-injury, there was a significant reduction in this index to 0.2 mm. At 4- and 6-week post-injury, there was a gradual increase in the DHI, which is quite contrary to what one would expect in human degenerated discs. The change in DHI% in the injured group was reduced at 2 weeks and then increased until 6 weeks, whereas, in the non-injured group, there was no significant change (Fig. 6).
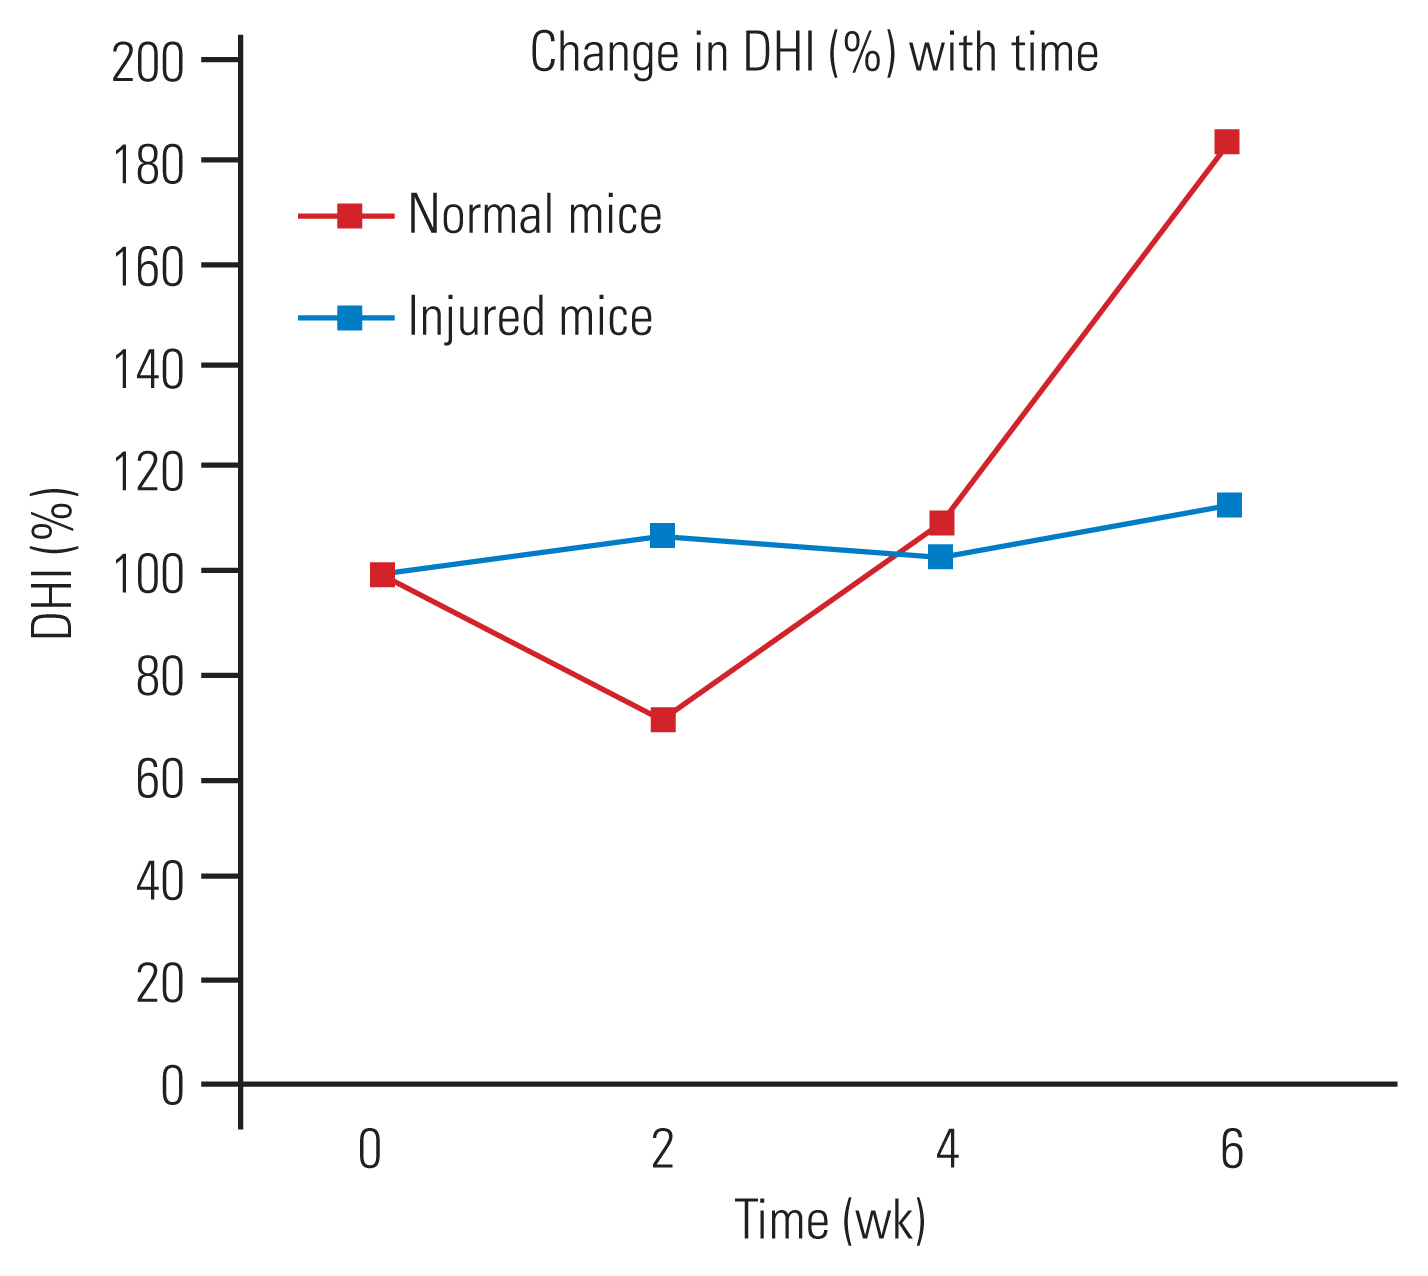
Change in disc height index (DHI, %) in injured mice versus normal. In normal mice there was no meaningful change, whereas in the injured group at 2 weeks the DHI (%) initially reduced, followed by there was a gradual increase at 6 weeks.
3. Histopathology findings
Paraffin sections stained with Safranin O and Sirius Red at 6 weeks of un-injured disc stained with Safranin O, displayed normal architecture of the inner nucleus pulposus (NP), intact outer AF, and adjacent superior and inferior endplates (Fig. 7A). Sirius Red stained polarized images of the normal disc demonstrated good orientation of collagen fibers in the AF (Fig. 7B). The injury group demonstrated severe disc degeneration (Masuda score=12) with complete distortion of the NP and the AF (Fig. 8A). A uniform disc degeneration was observed in all injured mice. Polarized images of AF at 40× magnification showed disorientation of collagen fibers in all injured mice, suggestive of degeneration (Fig. 8B).
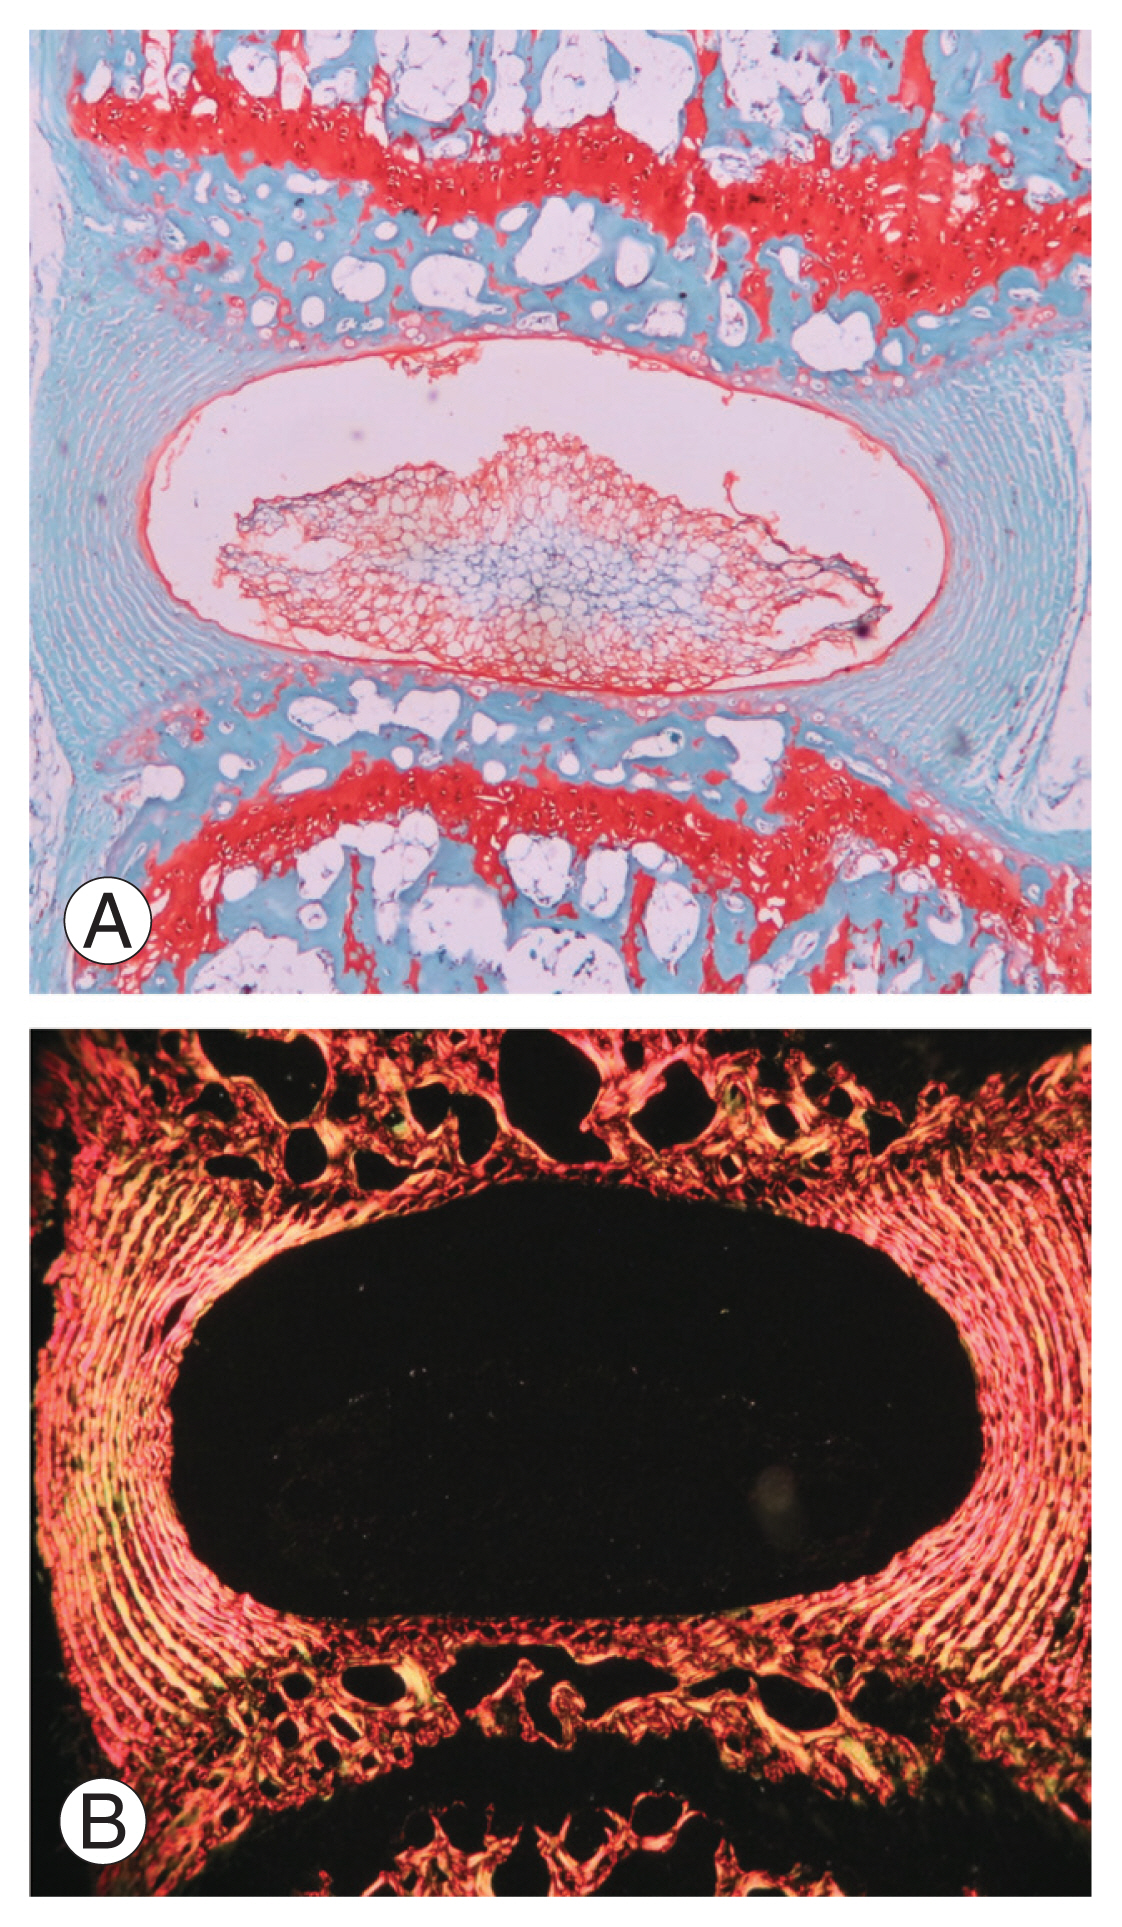
Histology sections through a normal disc stained with Safranin O (×40), a marker for cartilage (A). The normal architecture of the disc, with intact outer annulus fibrosus and inner nucleus pulposus (with endplates superiorly and inferiorly) are seen. (B) Sirius Red stained polarized light microscopic images (×40) of a normal disc showing orientation of collagen fibers in the annulus fibrosus.
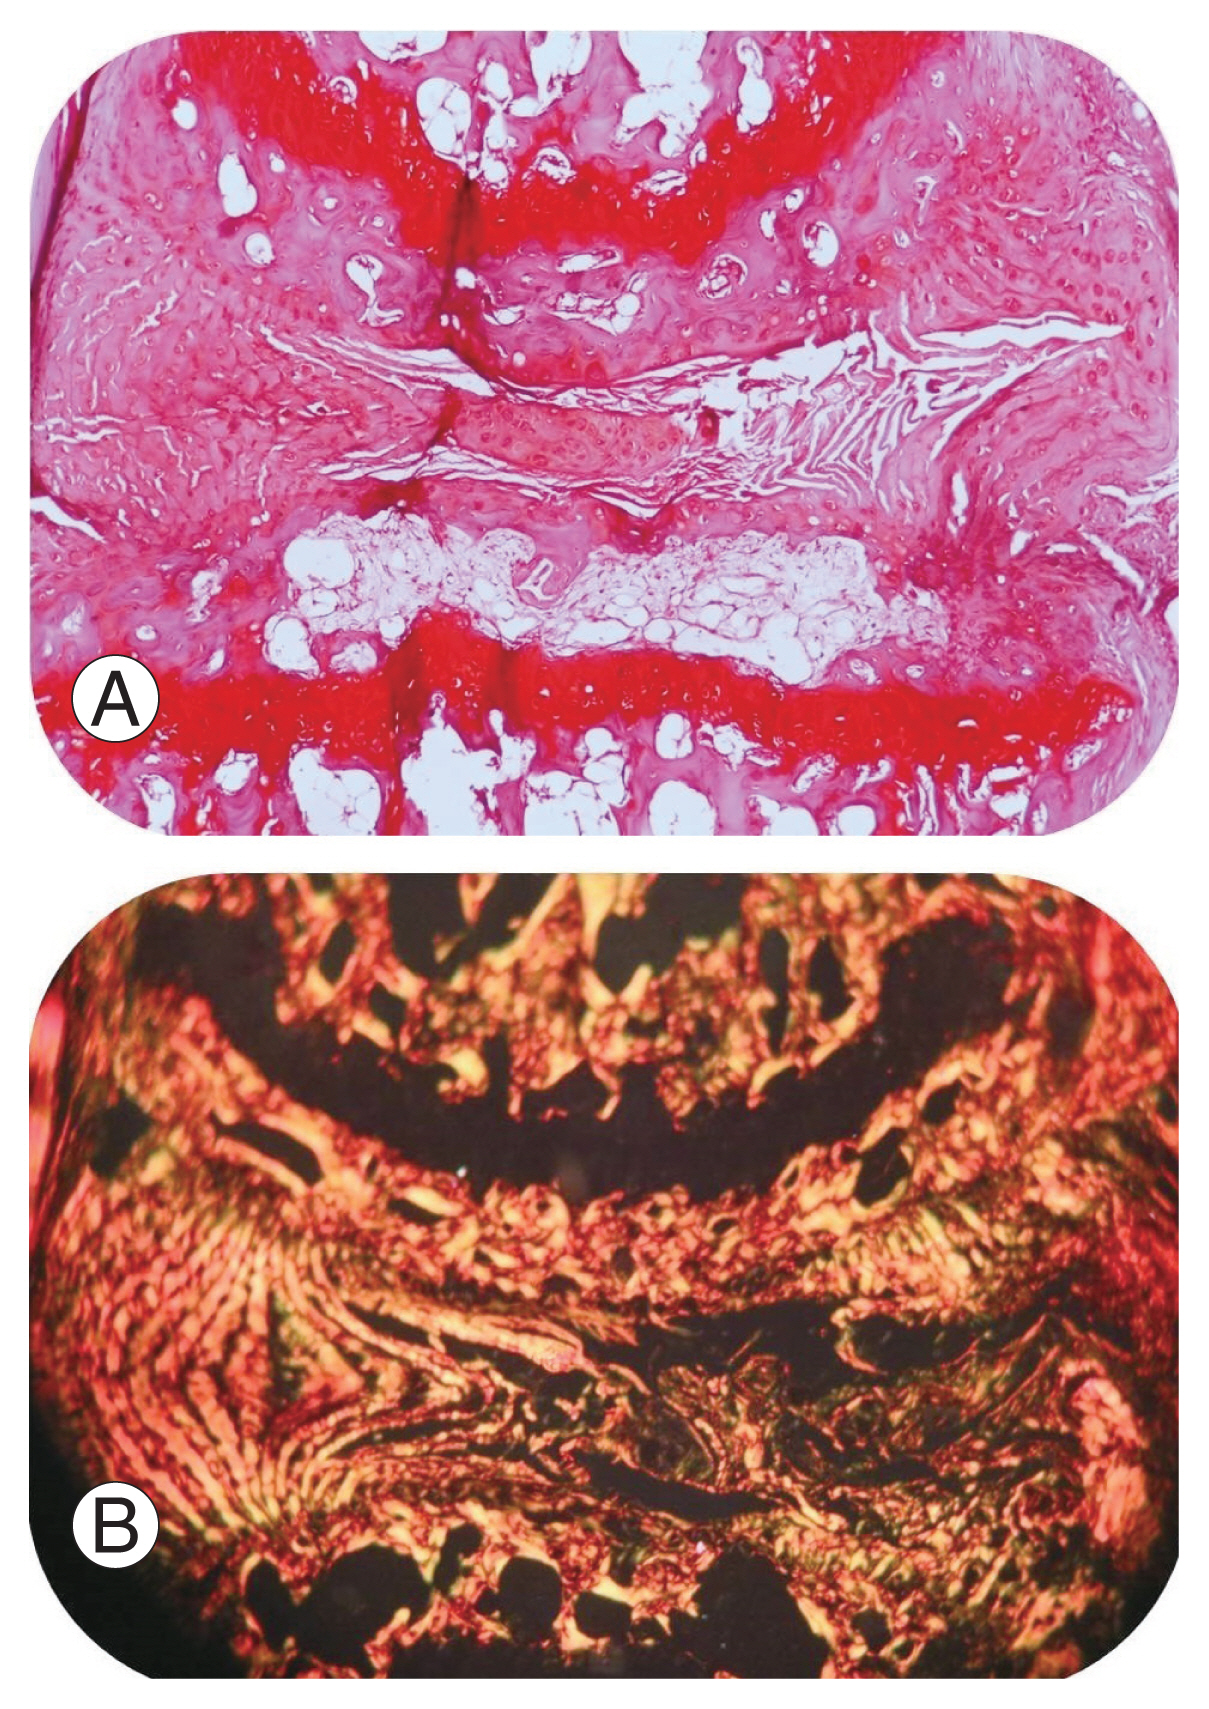
Safranin O stained (A, ×40) and polarized Sirius Red stained (B, ×40) histology sections of the disc at 6-week post-injury, showing severe disc degeneration with complete distortion of the nucleus pulposus and annulus fibrosus.
Discussion
1. Animal models
Several investigators have attempted to create various animal disc degeneration models [7,10–13]. As stated by Daly et al. [6] in her literature review, there is no ideal animal model that closely resembles human disc degeneration. In experimental settings, mouse and rat lumbar disc stand closest to the human intervertebral disc [7]. The second most similar is the mouse tail disc. We used mouse tails in our study as they were easy to handle and had minimal maintenance.
There are numerous disc degeneration techniques described in the literature [14–18]. Based on the mode of induction, models are primarily classified into spontaneous, gene-altered and structural [14–20]. Spontaneous models most closely resemble natural disc degeneration, but due to a long and unpredictable course, their use is limited [6]. Genetic models help us in evaluating only specific genes and proteins involved in a disease process. Due to their high cost, lack of tools for molecular analysis and the time involved in aging, their use is limited [19,20]. The structural models gained popularity by the advantage of inducing degeneration at the desired time point, low cost, and easy replicability [8]. Based on the modelling technique, the structural models are classified into mechanical and chemical.
1) Mechanical structural injury models
The mechanical models can be created by compression, instability, or structural injuries. Most commonly used are injury models, as we have control, and they can be created instantly. Structural disruption of the AF and NP by needle puncture and moreover, image-guided percutaneous injury, gained momentum due to their simple technique and low cost. A controlled needle injury induces slower and more progressive disc degeneration, which is said to more closely resemble human disc degeneration, and is thus more suitable for assessing the effectiveness of newer treatments [21,22]. However, they are considered inferior to the spontaneous model of degeneration, as the process is not a natural phenomenon, and thus may involve a different pathophysiology [6].
2) Chemical injury models
The various chemicals used for disc degeneration are chondroitinase ABC, chymopapain, Freund’s adjuvant, and 5-bromodeoxyuridine. Chondroitinase ABC and chymopapain cause loss of proteoglycan, a vital component of the disc material. The dose of injected chemical reagent can alter the degree of disc degeneration; therefore, a uniform dose needs to be injected. The chemical reagents require a needle in order to be injected into the disc space, which itself can cause some damage to the disc. Hence, not only the quantity of chemical injected but also the injection technique and needle size will alter the degeneration pattern and uniformity [19]. The study of the degenerative process and interpretation of a therapeutic application become difficult in such complex models.
2. Comparison of our technique with other methods of needle injury
This is the second study to describe a mouse tail disc degeneration model based on percutaneous needle puncture technique. Yang et al. [23], who first used needle puncture on mouse tails, employed an open dissection technique under a microscope. Han et al. [24] used needle puncture of the rat tail by a percutaneous technique, but the water and collagen content of discs did not change satisfactorily. Our technique is highly precise (Fig. 5), as the needle puncture injury was done using a tool delivering high accuracy and precision, unlike in a study of Han et al. [24], which injured manually. This tool was designed by us and consisted of a modified light microscope stage, through which we could get good precision using its x-axis (to choose the disc level), y-axis (centering to the target disc) (Fig. 1A), and z-axis movement controllers (controlled depth penetration of the needle) (Fig. 1B). Masuda et al. [9] used a rubber stopper to control the depth penetration while Han et al. [24] penetrated to a depth of 5 mm and rotated 360° for 30 seconds. Another rat tail percutaneous needle model created by Issy et al. [25] used ventral AF resistance as a guide for depth penetration. However, all of these studies were freehand techniques, which neither had a specific tool for holding the needle nor controlled penetration; hence, the chance of missing the disc was very high. Piazza et al. [26], in his free hand percutaneous technique mice coccygeal disc degeneration model, had at least one disc (10%) being missed out of 10. None of the other studies mentioned the accuracy and uniformity of their free hand technique [9,23–25]. In our model, we could achieve both 100%, as evident in CT and histology grade with the help of this three-axis–controlled novel tool and CT-guided marking (Fig. 1).
To prevent injury of the vertebral body and end plates, the needle diameter should be less than 0.3 mm (normal disc height range, 0.3–0.4 mm). For a universal effect of disc degeneration, the needle–disc height ratio should be more than 40% (Elliot et al. [27]). To achieve this, the closest size which we could obtain was a 32G needle with a diameter of 0.23 mm. Yang et al. [23] used a 31G needle (diameter, 0.26 mm) to puncture the discs. In our study, the average disc height ratio was 74%, and all degenerated discs had high Masuda grades.
3. Computed tomography findings of disc degeneration model
The disc diameter at coccygeal 4–5 was found to be 1.5 mm and its height was 0.3–0.4 mm. The study done by O’Connell et al. [7] also reported similar values. In our study, the change in DHI% in the model had decreased at 2 weeks, following which there was a gradual increase, reaching a peak at 6 weeks. The change in DHI% found by Yang et al. [23] in mice showed a significant decrease at 2 weeks, which remained stable until 6 weeks, following which there was further decrease. In the studies of Masuda et al. [9] (rabbit), Han et al. [24], and Issy et al. [25] (rat) also there was a significant reduction in DHI% in first 2 weeks and a gradual decline over the next 6 weeks. Our model showed equivalent results up to 2 weeks; however, there was an increase in DHI%. The initial decrease in DHI% can be explained by cell apoptosis and tissue necrosis caused by inflammatory mediators [28]. The subsequent increase in DHI% can be attributed to the deposition of fibrous connective tissue in the disc space, a view supported by the thin collagen fibers observed on polarized light microscopy in non-weight bearing discs.
4. Histology of disc degeneration model
Our observations of the disc degeneration process at 2-, 4-, and 6-week intervals demonstrate that the grade worsens over 6 weeks. The findings were concerned with annular tears, loss of cellularity, loss of NP matrix, and glycosaminoglycan content. Abundant fibrous connective tissue deposition was noted in the NP, as seen in the previous mouse study done by Yang et al. [23]. The degeneration results obtained in our study were uniform in all injured mice. This uniformity was the result of the standard novel tool and CT-guided technique deployed for penetrating the needle into the disc. Polarization microscopy in degenerated discs revealed concentric parallel thick fibers that remained intact for up to 6 weeks. After 6 weeks of degeneration, we could see new thin collagen fibers in the center of the disc. Similar polarized light microscopy results were observed by Issy et al. [25]. In degenerated discs, there was a disruption of the parallel concentric orientation of fibers in the AF, with replacement by serpentine formations and tears.
5. Limitations
The mouse tail disc model has its limitations, due to its altered biomechanical loading, absence of posterior elements, and different disc geometry as compared to human lumbar discs. Unlike human discs, mice discs possess notochordal cells; therefore, the response to degeneration may be different. CT is suboptimal for evaluation of soft tissue structure and ideally, magnetic resonance imaging is required for the best display of the disc. We acknowledge that animal micro-CT is expensive, but this technique can also be reproduced with the help of X-rays.
Conclusions
A simple mouse model of disc degeneration was created using a novel tool, and its advantage being high accuracy, easy reproducibility, and simple technique. This uniform model will provide a better understanding of the degenerated disc microenvironment for researchers to explore new therapies.
Notes
Conflict of Interest
No potential conflict of interest relevant to this article was reported.
Author Contributions
Manish Baldia: principal investigator, study design, data collection and analysis, and preparation of manuscript; Sunithi Mani: reading of CT scan and calculation of disc height index, manuscript review; Noel Walter: histology evaluation of surgical tissues and manuscript review; Sanjay Kumar: study design, help with animal experiments and manuscript review; Alok Srivastava: study design, critical analysis of data and technical help; and Krishna Prabhu: study design, critical analysis of data and final manuscript review.
Acknowledgements
We thank Mr. Parameshwaran and Dr. Suresh R. Devasahayam (Bio-engineering) for their contribution in designing the tool.