Responsiveness of Minimal Clinically Important Change for the Persian Functional Rating Index in Patients with Chronic Low Back Pain
Article information
Abstract
Study Design
A prospective, within-group cohort study of 46 patients with chronic low-back pain (CLBP).
Purpose
To assess the responsiveness of the Persian Functional Rating Index (PFRI) and to determine the minimal clinically important change (MCIC) of the PFRI in a cohort of patients with CLBP.
Overview of Literature
The FRI is an instrument for assessing pain and disability in patients with low-back pain. No study so far has examined the responsiveness of the PFRI.
Methods
Forty-six patients with CLBP with a mean age of 50.33±14.28 completed the PFRI, the Persian Roland–Morris Disability Questionnaire (PRMDQ), and a Visual Analog Scale (VAS) before and after 10 physiotherapy sessions. A Global Rating of Change Scale (GRCS) was completed after treatment.
Results
The changes in PFRI scores were statistically significant using the paired t-test (p<0.001). The PFRI revealed high effect sizes (range, 0.93–1.82). The PFRI showed significant correlations with the VAS (0.86), the PRMDQ (0.66), and the GRCS (0.45). The area under the receiver operator characteristic curve for the PFRI was good (0.76; 95% confidence interval, 0.56–0.95). The MCIC for PFRI was 10.63 points.
Conclusions
The results supported the responsiveness of the PFRI in patients with CLBP and showed the amount of change in PFRI scores perceived as worthwhile by the patients.
Introduction
Low-back pain (LBP) is a common and expensive musculoskeletal disorder globally [1,2]. The individual lifetime prevalence of LBP is high, even being up to 90% [3,4]. The patients with LBP complain of pain, dysfunction, and disability. LBP with no known and recognized pathology persisting for at least 3 months is defined as nonspecific chronic low-back pain (CLBP). CLBP can be quite disabling, with a significant financial burden to the patient’s family and society.
There are various treatment interventions effective in reducing pain and improving physical function in patients with CLBP [5]. However, to assess the effects of these interventions with regard to achieving clinical goals, it is important to use instruments with sound measurement properties, such as reliability, validity, and responsiveness to change.
There are several patient-reported outcome questionnaires (PROQs) commonly used as convenient instruments for assessing disability in patients with LBP [6]. Among the PROQ provided for assessing LBP-related disability, the Functional Rating Index (FRI), which is short and quick to score, was developed for LBP as well as neck pain [7]. A systematic review of the PROQs found the FRI to be suitable for assessing disability in patients with spinal pain [6]. The FRI was recently translated and cross-culturally adapted into Persian (Persian FRI [PFRI]) with excellent results for various psychometric properties of reliability and validity [8-11], consistent with the original English and other translated versions [12]. However, no study has so far determined the responsiveness of the PFRI in patients with CLBP (Table 1). Therefore, the purpose of the present study was to assess the internal and external responsiveness of the PFRI in patients with CLBP.

Responsiveness data for English and translated Functional Rating Index in populations with low-back pain
Materials and Methods
1. Design
A prospective, within-group cohort study design was used. The study was approved by the review board and the ethics committee, School of Rehabilitation, Tehran University of Medical Sciences (TUMS; approval no., IR.TUMS.FNM.REC.1395-888). All patients provided written informed consent prior to participation in the study.
2. Patients
Patients with nonspecific CLBP referred to physiotherapy clinics for treatment in Tehran, Iran participated in this study. The inclusion criteria were as follows: (1) age ≥18 years; (2) presence of CLBP for ≥3 months; and (3) willingness to participate in the study. Patients with previous spinal fractures, a history of spinal surgery, indicators of nerve root involvement (e.g., positive straight-leg raising test, radiation to foot), a concomitant diagnosis of rheumatoid arthritis, or malignancy and pregnant women were excluded.
3. Outcome measures
The following measures were used, with the Global Rating of Change Scale (GRCS) as an external standard criterion.
1) Functional Rating Index
This PROQ measures pain (two items) and functional status (eight items) in patients with CLBP or neck pain. It comprises 10 items rated on a 5-point scale (0 indicates no pain and an ability to function, whereas 4 indicates the worst possible pain and inability to function) [7]. The score range is between 0% (no disability) and 100% (severe disability), calculated as (total score/40)×100% [7]. The percent change of the PFRI is calculated using the formula Δ PFRI=(pre-FRI%−post-FRI%)/pre-FRI%. The FRI is a reliable and valid instrument for measuring disability in patients with CLBP and neck pain [6,7,12]. In this study, the PFRI was used, which is a reliable and valid instrument for patients with CLBP and neck pain in the general population [8,9] and athletes [10,11].
2) Roland–Morris Disability Questionnaire
The Persian Roland–Morris Disability Questionnaire (PRMDQ) is one of the most widely used back-specific PROQs for assessing physical disability in patients with CLBP [13]. It is recommended by expert panels as a reliable, valid, and responsive instrument for use in clinical settings and research [14]. It is short and simple and comprises 24 statements. Patients are asked to put a check mark next to each statement, if appropriate. The total number of items checked give the RMDQ score ranging from 0 (no disability) to 24 (maximum disability) [14]. The validated Persian version of the RMDQ, the PRMDQ, was used in this study [15].
3) Visual Analog Scale
The Visual Analog Scale (VAS) is a single-item, continuous scale for pain intensity assessment. It is a 10-cm line with endpoints labeled as ‘no pain at all’ on the left and ‘pain as bad as it could be’ on the right. The patient is asked to define his/her pain intensity by putting a mark on the line between the two endpoints. The distance between two endpoints is measured using a ruler to obtain the score [16]. The VAS is a reliable, valid, and responsive measure of pain level [17,18].
4) Global Rating of Change Scale
The GRCS is a reliable, 11-point rating outcome measure ranging from +5 (much better) to 0 (about the same) to –5 (much worse) and is used to classify patients according to the change in CLBP after physiotherapy treatment [19]. Using the GRCS, patients are asked to rate their status as improved, unchanged, or deteriorated.
4. Procedure
The patients enrolled in this study underwent baseline examination. Baseline characteristics, including age, sex, CLBP duration, height, and weight, were recorded. The outcome measures of the PFRI [8], PRMDQ [15], and VAS [16] were completed at the baseline and after 10 physiotherapy sessions. After treatment, patients were asked to rate the overall change in their CLBP since the beginning of physiotherapy using the GRCS [20].
G*Power ver. 3.1.3 (Heinrich-Heine-Universität Düsseldorf, Düsseldorf, Germany; http://www.gpower.hhu.de/) was used to calculate the sample size. According to the GRCS, two independent groups of patients, improved and unimproved, were considered to calculate the minimal clinically important change (MCIC) on the receiver operator characteristic (ROC) curve. Assuming an effect size of d=0.8, α=0.05, and power (1−β)=0.8, a total sample size of 42, with 21 patients in each group, was calculated. However, 46 patients were recruited in this study.
5. Statistical analysis
SPSS Statistics ver. 17.0 for Windows (SPSS Inc., Chicago, IL, USA) was used to analyze data. A p≤0.05 was considered statistically significant. The internal responsiveness of the PFRI, PRMDQ, and VAS was determined using the paired t-test and by calculating the standardized effect size (SES: mean change scores divided by standard deviation [SD] of the baseline score), standardized response means (SRM: mean change scores divided by SD of the change scores), and the Guyatt responsiveness index (GRI: mean change scores divided by SD of a change in patients whose condition remained the same) [21]. SESs of ≤0.20, 0.50, and ≥0.80 represented small, moderate, and large responsiveness, respectively [21]. The external responsiveness of the PFRI, PRMDQ, and VAS was calculated by the area under the ROC curve and correlation analyses [21]. The ROC was described in terms of sensitivity and specificity to distinguish patients who improved from those whose condition remained the same or worsened based on the GRCS; patients whose condition remained unchanged and those who worsened were combined as patients who did not improve. An area under the curve (AUC) of minimum 0.70 was considered adequate [22]. The AUC values were interpreted as follows: 0.97–1.00, excellent; 0.92–0.97, very good; 0.75–0.92, good; and 0.50–0.75, fair [23]. The point on the ROC curve nearest to the upper-left corner of the curve, representing the highest sensitivity and (1−specificity) was used to estimate the MCIC necessary to distinguish between improved and unimproved patients. The Pearson and Spearman’s rho correlation coefficients were computed on the basis of change scores to assess the external responsiveness of the measures. Correlation values were interpreted as follows: 0.81–1.00, excellent; 0.61–0.80, very good; 0.41–0.60, good; 0.21–0.40, fair; and 0.00–0.20, poor [7].
Results
Forty-six patients with LBP (41 females, 5 males) with a mean age of 50.33±14.28 years and a disease duration of 109±123.32 months participated in this study. After 10 physiotherapy sessions, patients were classified on the basis of the GRCS as ‘improved’ (n=39, 84.8%), ‘not changed’ (n=4, 8.7%), and ‘worsened’ (n=3, 6.5%). The number of unimproved patients was small (n=7), and thus, the internal and external responsiveness statistics were not calculated for this group.
The mean (SD) values of the PFRI, PRMDQ, and VAS at baseline and after treatment and change scores are shown in Table 2. There were significant changes in all outcome measures over the two pretest–posttest time points (p<0.001).

Mean of pre- and post-treatment, change scores, and responsiveness statistics of SES, SRM, and GRI for the PFRI, PRMDQ, and VAS (n=46)
The SES for the PFRI was 0.93, which was larger than the SES for the PRMDQ (0.55). However, the VAS had the largest SES (1.07). The PFRI produced the largest SRM (0.99), followed by the VAS (0.96), whereas the RMDQ generated the smallest SRM (0.63). The GRI was the largest for the PFRI (1.82), followed by the VAS (1.41), and smallest for the PRMDQ (0.97) (Table 2).
Table 3 shows that the AUC for the PFRI was good (0.76; 95% confidence interval [CI], 0.56–0.95; p=0.03), which was similar to the AUC for the VAS (0.79; 95% CI, 0.61–0.98; p=0.01) but higher than the AUC for the PRMDQ (0.73; 95% CI, 0.53–0.93; p=0.05). For a decrease in disability, the MCIC corresponded to 10.63 points for the PFRI (sensitivity, 85%; specificity, 57%), 1.5 points for the PRMDQ (sensitivity, 82.1%; specificity, 43%), and 1.25 points for the VAS (sensitivity, 90%; specificity, 57%). The ROC curves for the PFRI, PRMDQ, and VAS are depicted in Fig. 1.

Responsiveness statistics of AUC-ROC and correlation coefficients (r) for the PFRI, PRMDQ, and VAS (n=46)
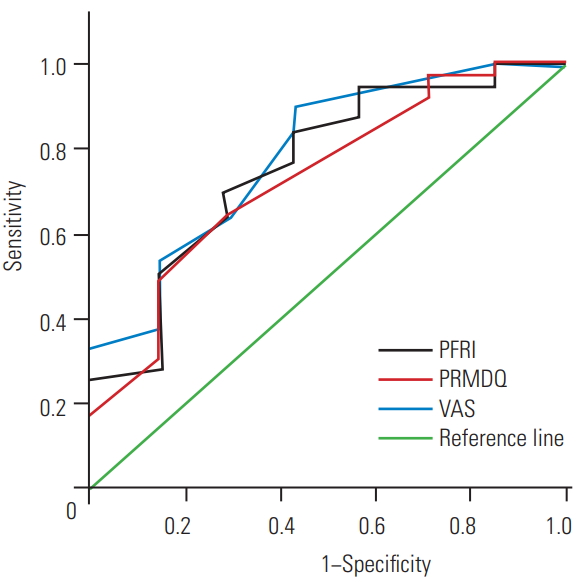
Receiver operator characteristic curves of the PFRI, PRMDQ, and VAS change scores using the external criterion of global rating change scale dichotomized as the improved and non-improved. PFRI, Persian Functional Rating Index; PRMDQ, Persian Roland-Morris Disability Questionnaire; VAS, Visual Analog Scale.
Spearman’s rho correlation coefficients suggested that both the PFRI and the VAS showed good correlation with the GRCS (PFRI: r=0.45, p=0.002; VAS: r=0.48, p=0.001). The correlation between the PRMDQ and the GRCS was fair (r=0.40, p=0.005). The PFRI change scores showed excellent (r=0.81) and very good (r=0.66) correlation with the VAS and the PRMDQ change scores, respectively (p<0.001) (Table 3).
Discussion
Outcome measures used in clinical settings or clinical trials must be reliable, valid, and responsive to change. A reliable instrument is the one that can produce the same results on repeated administration under similar conditions [22]. A valid instrument is the one that measures what it claims to measure [22]. The PFRI has been previously evaluated in Iranian patients with spinal disorders and showed satisfactory measurement properties of reliability and validity [8-11]. However, although the PFRI is a reliable and valid self-reported spinal-specific measure of pain and disability, its responsiveness in patients with CLBP has not been assessed.
Responsiveness, or sensitivity to change, refers to the ability of a measure to capture true changes in patients over time [24]. There are two approaches to assessing the responsiveness of measures [21]. Internal responsiveness refers to the ability of a measure to change in response to interventions over time with regard to the statistical significance of the change score. External responsiveness compares changes in a measure to a valid reference measure of health status [21]. External responsiveness is used to define the MCIC perceived as important by the patient.
In the present study, the responsiveness of the PFRI was examined in patients with LBP and compared with two frequently used outcome measures, the PRMDQ and the VAS. The findings showed that responsiveness of the PFRI in detecting changes following treatment was consistent with the original English FRI [7,12]. As such, the PFRI can be used to evaluate the pain and functional status after treatment. To the best of our knowledge, this is the first study that thoroughly evaluated the responsiveness of the FRI using the measures of internal and external responsiveness.
The results of the paired t-test showed significant changes in the responsiveness of the PFRI compared with the PRMDQ and VAS over time, measured at two time points—pre- and post-treatment. The t-value for the PFRI was greater than that for the PRMDQ and the VAS. This finding indicated a statistically significant mean change in the PFRI observed over time between pre- and posttreatment. This significant change in the PFRI mean response over time corroborates the PFRI as a responsive PROQ consistent with the English FRI (Table 1) [25].
In the present study, the responsiveness of the PFRI to physiotherapy was evaluated using different statistics. As expected, all internal responsiveness statistics (i.e., SES, SRM, and GRI) in line with the original English FRI provided the same large SES and responsiveness of the PFRI [7,26] (Table 1). However, the SESs for the PFRI were higher than those reported for the English [25] and the Brazilian–Portuguese FRI (Table 1) [27,28]. A review of the literature on the FRI revealed a range of 0.14–2.92 [26,29] for SES scores and of 0.25–1.30 [29] for SRM in various populations with spinal disorders [12].
Previous studies have reported that the responsiveness of English and translated versions of the FRI was similar to that of the RMDQ [12]. In this study, with the exception of the GRI, which was large for the PFRI, PRMDQ, and VAS, the SES and SRM for the PFRI were similar to those for the VAS (large) but were higher than those for the PRMDQ (moderate). Therefore, when comparing the PFRI with the PRMDQ, all internal responsiveness coefficients favored the PFRI. The magnitude of various SESs for the PFRI were >0.8, suggesting that any observed change in pain and disability following physiotherapy meaningfully improved the clinical status.
The reason for similar large internal responsiveness coefficients for both the PFRI and the pain VAS could be that the FRI included items that asked patients regarding the intensity and frequency of pain. In addition, the higher internal responsiveness coefficients for the FRI could be because of the multilevel scoring response options from 0 to 4 compared to the yes/no scoring format of the RMDQ [25].
Correlation coefficient analysis of change scores was used to observe how measurements on the PFRI were related to each of the comparative measurements on the PRMDQ, the VAS, and the external standard GRCS. The positive correlation coefficients found in this study indicated that all these instruments have a significant relationship with each other. In addition, the PFRI captured information regarding the PRMDQ, VAS, and GRCS, suggesting its good external responsiveness. Therefore, the PFRI, relative to comparative and external standard outcomes, can detect changes following physiotherapy in clinical settings.
Correlation analyses are useful because they show how different measures might be related and shed light on how changes in the PROQ predict those in another measure. Again, consistent with our internal responsiveness statistics, the PFRI change scores showed higher correlation with the VAS change scores than with the PRMDQ change scores. Questions on the intensity and frequency of pain, along with functional status, in the FRI may account for the excellent correlation between the PFRI and the pain VAS that was observed in this study. In addition, this excellent correlation between the PFRI and the pain VAS compared with the good correlation between the PRMDQ and the pain VAS confirmed the higher construct overlap between the FRI and the pain VAS. Correlation analyses were not conducted for the original English and translated versions of the FRI [6,12], except for the Brazilian–Portuguese FRI, which found very good significant correlation with the RMDQ (Table 1) [28], actually similar to that observed in this study.
The ROC curves indicated that the PFRI was more responsive to health changes than the PRMDQ. This finding was in agreement with a study that showed greater responsiveness of the English FRI than of the RMDQ [25]. Compared with the PRMDQ with a fair AUC, the AUC was good for both the PFRI and the pain VAS in this study, indicating a greater ability to distinguish between patients who improved and those who did not. The AUC found in this study was similar to that reported for the English FRI (0.74) [25] but higher than that reported for the Brazilian–Portuguese FRI (Table 1). However, a study on the English FRI administered to patients with LBP found a very good AUC (0.93) [26]. The possible reasons for discrepancies in the AUC values could be differences in design (prospective vs. retrospective), methods and approaches used, measure to judge changes occurring in patients, and sample size [24]. Studies have reported ROC scores for the FRI from 0.53 to 0.93 [12]. However, an interstudy comparison cannot be made because the recruited patients were affected by various spinal conditions.
The MCIC represents the amount of change in a health-related measure that is clinically meaningful as judged by patients. In this study, the cut-off point identified on the ROC curve was used to estimate the MCIC with the highest sensitivity and specificity. Sensitivity indicates the probability of the PFRI to correctly identify patients who demonstrated a change in their condition and improve. In contrast, specificity indicates the probability of the PFRI to correctly identify patients whose condition remain the same or worsen. In this study, the MCIC value for the PFRI was 10.63 points compared to 8.4 points reported for the English FRI (Table 1) [26]. This finding indicated that a change score of at least 10.63 points on the PFRI is clinically important for a patient undergoing physiotherapy being judged as showing meaningful improvements in pain and functional status. In this study, mean improvements on the PFRI, PRMDQ, and VAS exceeded the estimated MCICs, suggesting that the patients experienced worthwhile, meaningful changes in response to physiotherapy. However, a study on the frequently used LBP measures of the RMDQ, Oswestry Disability Index, Quebec Back Pain Disability Questionnaire, VAS, and Numerical Rating Scale proposed a 30% improvement from the baseline as a threshold to be considered a clinically meaningful improvement of pain and functional status in a patient [30]. In this study, the percentage improvement after physiotherapy on the VAS was the highest (37.62%), followed by the PFRI (31.32%), exceeding the recommended MCIC cut-off point. However, changes on the PRMDQ (25.93%) did not reach the threshold of 30% improvement. These findings suggested that the PFRI is more responsive than the PRMDQ. No further studies have estimated the MCIC for the FRI (Table 1).
This study had a few limitations. First, the sample of patients recruited was small, particularly when considering that patients were further divided into two groups, improved and unimproved. Second, the MCIC for the unimproved group was not calculated because the number of patients whose condition remained unchanged or worsened was very small. The MCIC for the unimproved group might be different from that for the improved group. It was estimated to have two equal-sized improved and unimproved groups. However, the trends observed in this study for a large SES of physiotherapy in improving the condition of patients with CLBP suggested that it is unlikely to have corresponding sizes of the unimproved and improved groups.
Conclusions
In conclusion, the PFRI is responsive to changes in patients with CLBP and can be recommended as a valid PROQ for measuring the comprehensive pain and functional status effect of physiotherapy on Persian-speaking patients with CLBP. However, further investigation is warranted to determine the responsiveness of the PFRI in patients with neck pain.
Notes
No potential conflict of interest relevant to this article was reported.
Author Contributions
Concept, idea and design: all authors; project manager: NNA, SN; providing participants: ZF; data collection: SK, PA; data analysis: NNA, SK; writing: NNA, SK, SN; review of manuscript for important intellectual content: all authors, and approval of final version of manuscript before submitting: all authors.
Acknowledgements
The authors are grateful to all patients for their participation in the current study and also the Research Deputy, Tehran University of Medical Sciences for supporting this research.