Lumbar Spinal Canal Stenosis Classification Criteria: A New Tool
Article information
Abstract
Study Design
Case-control study.
Purpose
To design a new tool for classifying lumbar spinal canal stenosis (CLSCS).
Overview of Literature
Grading of patients with lumbar spinal canal stenosis (LSCS) is controversial.
Methods
The Oswestry disability index (ODI) and the neurogenic claudication outcome score (NCOS) were recorded. Four parameters, which indicate the severity of LSCS disease, including Hufschmidt-grade, grading of magnetic resonance imaging, self-paced walking test, and stenosis ratio (SR) were employed. For the SR, quartile analysis was applied for classifying LSCS and the Hufschmidt-grade was modified into a 4-grade score. An initial score was assigned to each metric based on the severity of LSCS. Using the inverse-variance weighting method, the relative weights of these domains and their categories were determined. The score for all of the cases was obtained based on their weight by summing up the points of the four variables. Quartile analysis was used and a CLSCS score was proposed. Finally, intra- and interobserver reliability, and validity were assessed.
Results
A total of 357 patients were studied. The final CLSCS score for each case ranged from 4 to 16.5. Based on the quartile analysis, using the new criteria set, the CLSCS score was divided into four categories: CLSCS<7 (grade 0); 7≤CLSCS<10 (grade 1); 10≤CLSCS<13 (grade 2); and 13≤CLSCS≤16.5 (grade 3). The kappa values of for the CLSCS score indicated a perfect agreement. The CLSCS was correlated with the ODI and NCOS. All patients with grade 3 CLSCS were observed in the surgical group.
Conclusions
The CLSCS score can be helpful for classifying LSCS patients and in the decision-making process.
Introduction
A common cause of low back pain and disability associated with neural element compression is lumbar spinal canal stenosis (LSCS). LSCS is a condition in which the degenerative central canal narrows due to degenerative disc bulging, hypertrophied ligamentum flavum, and degenerative changes in the facet joint [1]. The symptoms of LSCS include pain in the groin, hips, and buttocks, and numbness or weakness in the legs and lower back. Symptoms usually worsen with walking or standing (claudication) [1]. The ability to classify LSCS patients is important for choosing the appropriate management. A wide range of clinical, electrodiagnostic, and radiological tests are currently used to define and classify LSCS. However, there is no generally accepted "gold standard" for the classification of LSCS and for the decision-making process in clinical practice, especially in borderline patients [23]. Hence, there is a need for consensus on the criteria for classifying LSCS so as to provide a decision-making tool that helps in deciding whether surgical or conservative management should be performed in LSCS. This study sought to develop a new quantitative tool based on the Hufschmidt-grade, the grading of magnetic resonance imaging (MRI), the self-paced walking test (SPWT), and the stenosis ratio (SR) to classify LSCS patients.
Materials and Methods
1. Patients and data collection
Cases of LSCS diagnosed at a single center were identified for this retrospective study, between February 2007 and April 2012, in a large teaching hospital in Tehran, Iran. The diagnosis of LSCS was established based on the clinical symptoms, neurological examination, and imaging studies-including plain radiography, MRI, and computed tomography (CT) of the lumbar spine. All of the patients had typical symptoms of LSCS, such as neurogenic intermittent claudication and leg pain and/or numbness. In all of the patients, the diagnosis was confirmed by more than one spine surgeon. The level(s) of stenosis were explored on the MRI or CT. There were no restrictions on patient choice with regard to level(s) of LSCS, age, or other characteristics. The exclusion criteria were prior lumbar spine surgery and congenital spine anomalies.
Demographics, including age, gender, and body weight, were recorded. The duration of symptoms (in months) and neurogenic claudication outcome score (NCOS) were recorded. The NCOS ranges from 0 to 100. Higher scores have been associated with a better clinical outcome.
2. Additional metrics
1) The SR
The SR is defined as the ratio of the cross-sectional area of the spinal canal on the axial MRI image at the disc level that is associated with greatest neurologic compression to the cross-sectional area at the next rostral pedicle level above [4]. It has been used to determine the severity of stenosis. The cross-sectional area was measured by the Hamanishi technique [5]. The calculations were performed by two independent surgeons and they were blinded to each other's results. The SRs were divided into quartiles of severity of lumbar stenosis.
2) The SPWT
The SPWT is a measure of walking capacity, which is the distance a person with LSCS is able to walk without support on a level surface at a self-selected speed before being forced to stop due to symptoms of LSCS [6]. The SPWT is presented as a feasible and reproducible criterion measure for use in LSCS and NC patients [78]. The SPWT was extracted from patients' case records and categorized as poor (less than 100 m), fair (between 100 m and 800 m), good (between 800 m and 1,600 m), and very good (more than 1,600 m) [9].
3) The grading of MRI
Lee et al. [10] described a 4-grade (0, 1, 2, and 3) classification of the severity of LSCS based on the degree of separation of the cauda equina on T2-weighted axial images, without measurement of the parameters. They defined grade 0, no lumbar stenosis without obliteration of the anterior CSF space; grade 1, mild stenosis with separation of all cauda equina; grade 2, moderate stenosis with some cauda equina aggregated making it impossible to visually separate them; and grade 3, severe stenosis with none of the cauda equina separated.
4) Hufschmidt-grade
Grading of LSCS presented by Hufschmidt and Bar [11] was categorized as follows: grade I; neurogenic intermittent claudication characterized by a reduced walking distance (caused by pain) and short term intermittent sensory and/or motor deficits that at rest might be unremarkable, but might worsen while walking, grade II; intermittent paresis refers to already persistent sensory deficits, loss of reflexes and intermittent paresis, and grade III; persistent, progressive paresis, accompanied by partial regression of pain. Grade I was broken down into grade 0 (symptoms after walking 100 m or more than 100 m) and grade 1 (symptoms after walking less than 100 m). The Hufschmidt-grade was, henceforth, modified from a 3- to a 4-grade scale.
5) The Iranian version of the ODI
This is a measure of functionality and contains 10 items. The possible score on the Oswestry disability index (ODI), ranges from 0 to 50, with higher scores indicating worse conditions. The psychometric properties of the Iranian version of the questionnaire are well documented [12].
Both subjective and objective parameters such as the Hufschmidt-grade, the grading of MRI, the SPWT, and the SR, were used to build the new quantitative tool.
3. Treatment
All of the patients had received surgery or conservative treatment for LSCS. All patients in the surgical group failed at least 6 months of conservative treatment, including oral analgesics, physiotherapy, and epidural steroids.
4. Statistical analysis
All statistical analyses were performed using the PASW ver. 18 (SPSS Inc., Chicago, IL, USA). The SR was grouped according to the severity of LSCS by performing quartile analysis with the SR 0.75<between≤1 (lowest quartile), 0.50<between≤0.75 (lower quartile), 0.25<between≤0.50 (higher quartile), and 0<between≤0.25 (highest quartile). For each of the four metrics (SR, Hufschmidt-grade, SPWT, and grading of MRI), an initial score of 1, 2, 3, and 4 was assigned to each metric based on the severity of LSCS [91011]. Then, for each parameter, we added together all patients' scores and calculated the mean score and the corresponding standard deviation. Consequently, the variance for each parameter was calculated. Finally, using the inverse-variance weighting method (weight=1/σ2; variance=σ), the relative weights of these domains and their categories were determined. Inverse-variance weighting was selected as it is typically used in statistical meta-analysis to combine the results from independent measurements and it is an appropriate method for creating a score. The score for all of the cases was obtained based on their weight by summing up the points of the four variables. Finally, the quartile analysis was used and a new classification for LSCS was proposed. For instance, for the SR, we first assigned a score of 1, 2, 3, and 4 based on the severity of LSCS in each case. Then, we added these scores for the whole sample size (n=357) to calculate the mean score and standard deviation. Later, the standard deviation was powered by 2 to estimate the variance. The weight for SR was derived from the above formula, and therefore, to calculate the weighted score for each case the initial score for each case multiplied it. The procedure was repeated for each parameter, and the addition of these weighted scores yielded the final score for each case ranging from 4 to 16.5.
5. Assessment of the intra- and interobserver reliability of the classification grading
In order to validate the classification, 83 patients with all types of disorders were randomly selected. Two independent observers classified each case twice within a 2-week interval to measure the intra- and inter-observer differences. The weighted Kappa coefficient was calculated for each spine surgeon based on his first and second data report and comparison of kappa between spine surgeons. Kappa values ranged between 0 and 1; the greater the kappa value, the higher the concordance rate. Kappa value of 0 to 0.20 indicated slight agreement, 0.21 to 0.40 indicated fair agreement, 0.41 to 0.60 indicated moderate agreement, 0.61 to 0.80 indicated substantial perfect agreement, and ≥0.81 was regarded as almost perfect agreement according to the interpretation by Landis and Koch [13].
6. Convergent validity
The correlation between the CLSCS and the ODI and NCOS was assessed using the Pearson's correlation coefficient and values of 0.40 or above were considered satisfactory (r≥0.81-1.0; excellent, 0.61-0.80; very good, 0.41-0.60; good, 0.21-0.40; fair, and 0.0-0.20, poor) [14].
7. Ethics
The research was approved by the Ethics Committee of Shahid-Beheshti University of Medical Sciences, Tehran, Iran.
Results
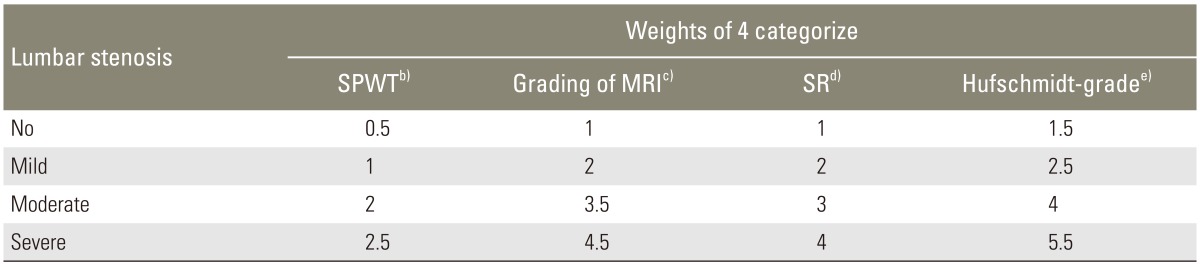
Demographics of the LSCS patients and their scores for the SR, Hufschmidt-grade, SPWT, grading of MRI, the ODI, and the NCOS are shown in Table 1. The SR was broken down to classify LSCS into quartiles: no lumbar stenosis (0.75<between≤1), mild stenosis (0.50<between≤0.75), moderate stenosis (0.25<between≤0.50), and severe stenosis (0<between≤0.25). The classification scheme for LSCS and the relative weights of these domains and their categories are shown in Table 2.

Baseline demographic data in patients with lumbar spinal canal stenosis (n=357)
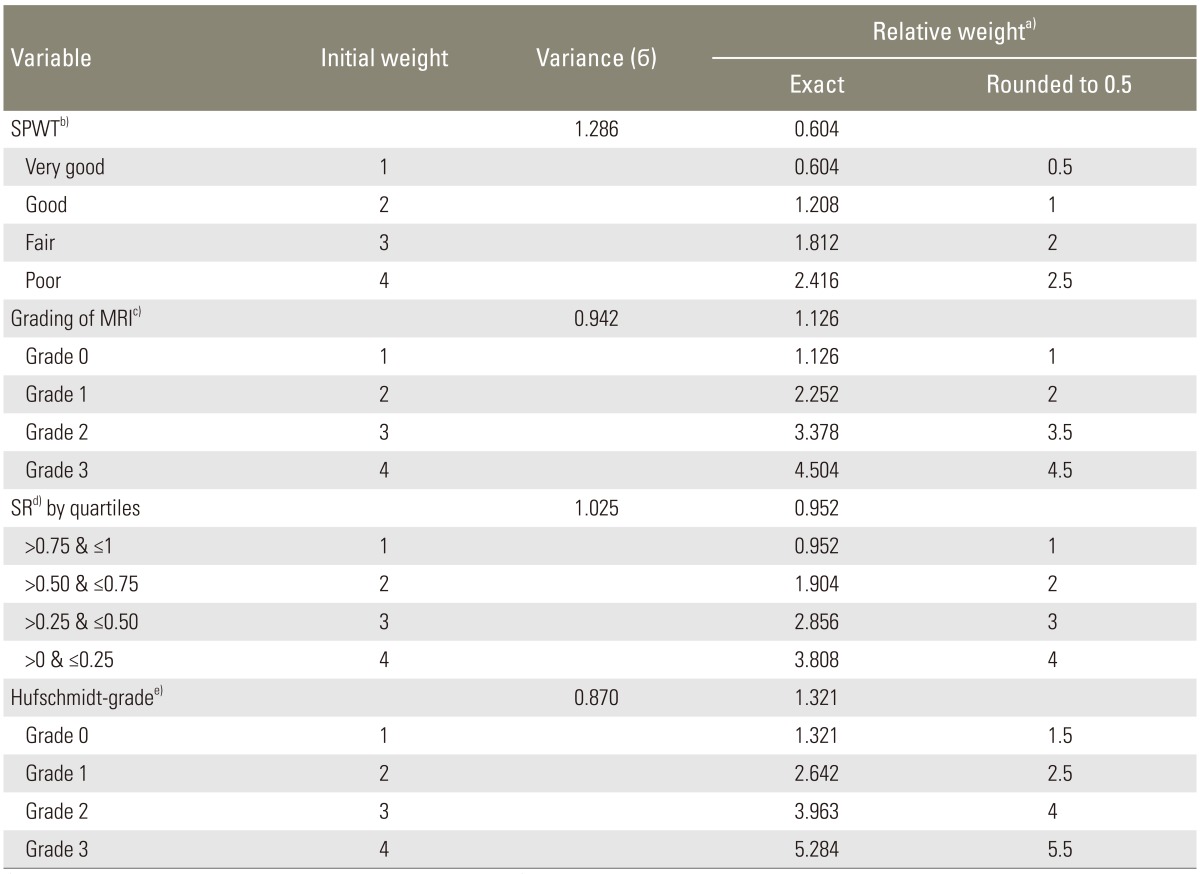
Classified of lumbar stenosis, for SPWT, grading of MRI, SR, and Hufschmidt-grade included in the study and theirs relative weight (n=357)
Based on the quartile analysis using the PASW statistics, the CLSCS score was divided into 4 categories: CLSCS<7 (grade 0=no lumbar stenosis); 7≤CLSCS<10 (grade 1=mild lumbar stenosis); 10≤CLSCS<13 (grade 2=moderate lumbar stenosis); and 13≤CLSCS≤16.5 (grade 3=severe lumbar stenosis). The score index for CLSCS was obtained by summing up the points of the four variables that are shown in Table 3.
Summary of CLSCS criteria and scorea)
The Kappa statistic was calculated for the CLSCS score and its domain, which are shown in Table 4. The kappa value for the CLSCS score for the intra-observer result was 0.82 (range, 0.81-0.93) and that for the inter-observer result was 0.84 (range, 0.82-0.96), indicating substantial perfect agreement. In addition, the CLSCS was strongly correlated with the ODI and NCOS, lending support to its good convergent validity (r=0.81, p<0.001; r=0.83, p<0.001, respectively).
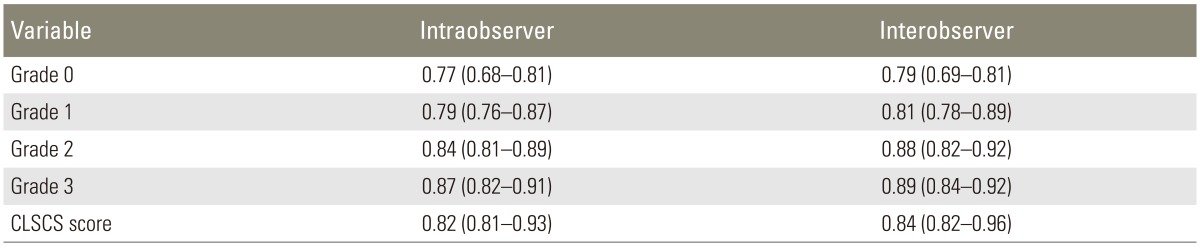
Inter- and Intra-observer CLSCS grading system (n=83 pairs of repeat evaluations)
In all, 171 out of the 357 patients underwent surgery and the remaining 186 patients received conservative treatment at the one-year follow-up from diagnosis. Overall, there were 32 patients who dropped out of the study or who were lost to follow-up. All patients in the surgical group failed at least 6 months of conservative treatment, including oral analgesics, physiotherapy, and epidural steroids. Treatments received within one year based on the CLSCS grade are shown in Table 5. Most of the patients (94.7%) who underwent surgery were identified as having grade-2 and grade-3 stenosis, while those who received conservative treatment were identified as having grade-0 and grade-1 stenosis (97.8%). This difference was statistically significant (p<0.001) (Table 5). All patients with grade-3 stenosis failed conservative treatment and were observed in the surgical group, and all patients with grade-0 stenosis were observed in the conservative group.
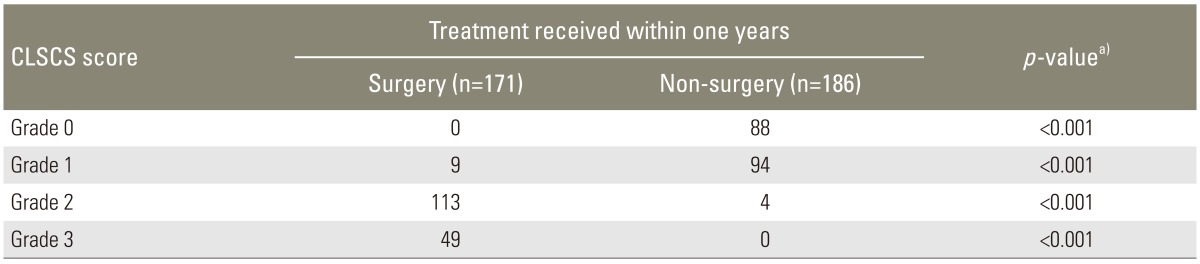
Treatment received within one years based on CLSCS grade (n=357)
Discussion
A new classification criterion is presented in this study for LSCS patients based on the four classification grading systems; the Hufschmidt-grade, the grading of MRI, the SPWT, and the SR. Our findings suggest that the CLSCS score is also generally reliable and valid for classifying these patients. Thus, the CLSCS score can be used in the decision-making process. Although the CLSCS score showed promise, the sample size was small, and therefore, the technique will need to be repeated in larger, multicenter datasets to convincingly show its classification power.
To date, no studies presenting a quantitative grading system for the classification of LSCS patients have been published. Several real-world datasets for LSCS classification such as the Hufschmidt-grade, the morphology grade, and the grading of MRI have been presented in the literature [101114]. The Hufschmidt-grade system is based on clinical symptoms and the other two systems are qualitative. Many studies have analyzed the relationship between dural sac cross-sectional area (DCSA) and the severity of symptoms in patients with LSCS, but its use for the classification of these LSCS patients remains controversial [1516]. However, in an effort to improve the currently available classification criteria for LSCS, we designed a quantitative grading system using both subjective and objective parameters. It seems that the CLSCS score may be a useful tool for clinical decision making in LSCS patients. Finally, one should note that the CLSCS score in our study was developed and validated in the same population. Therefore, the authors recommend prospective testing of the CLSCS score in future trials for external validation to confirm its classification power.
Our own experience in clinical practice shows that many patients who received surgery had a low or mild grade on the four classification grading systems; the Hufschmidt-grade, the grading of MRI, the SPWT, and the SR; hence, it is expected that these patients should not have undergone surgery. Similarly, we saw many patients with a moderate or high grade on the four classification grading systems who did not receive surgery; however, they should have undergone surgery. In addition, the new system is better than the DCSA, morphology grade, and the grading of MRI, in the decision-making process due to the new tool; a higher CLSCS score correlated significantly with surgical intervention and a lower CLSCS score correlated significantly with conservative management. In addition, although the morphology grade and the grading of MRI are easy and reliable methods, we think that the new proposed system takes a step forward in preventing mistakes in practice and in assisting in the management of patients with borderline LSCS [101114].
There are a variety of instruments for assessing the performance or functionality in LSCS patients. These include the ODI, the NCOS, and the Swiss spinal stenosis questionnaire. However, there are no existing standard cut-off points for the definition of severity of LSCS for the data acquired by these instruments for the assessment of classification in these patients. If standard cut-off points are subsequently made available, such instruments may be useful in making accurate preoperative assessments.
There are limitations to this study. First, we were unable to identify the most effective classification parameter. However, multicenter studies are needed to prospectively examine these factors to establish a more accurate surgical indication assessment strategy. Perhaps the main weakness of this study is the fact that we did not use an external validation tool. The degree of stenosis on imaging and then correlation of the presenting symptoms and the CLSCS score with the outcome is important information for the readers. These findings should be confirmed in future studies in order to further enhance the clinical relevance of data. Finally, multicenter trials are necessary for further refinement of this scale.
Conclusions
The new index, the CLSCS score is generally reliable and valid for classifying patients with LSCS. Thus, the CLSCS score can be used in the decision-making process with respect to surgical intervention in these patients. Future multicenter clinical trials are needed to confirm these findings.
Acknowledgments
The authors thank the staff of the Neurosurgery Unit at Imam-Hossain Hospital, Tehran, Iran.
Notes
Conflict of Interest: No potential conflict of interest relevant to this article was reported.