What Is the Effect of Spino-Pelvic Sagittal Parameters and Back Muscles on Osteoporotic Vertebral Fracture?
Article information
Abstract
Study Design
Case control study.
Purpose
To examine the effect of spino-pelvic sagittal parameters and back muscles on osteoporotic vertebral fracture.
Overview of Literature
Low bone mass is not the only important component of the risk on osteoporotic vertebral fracture; many other risk factors also contribute to skeletal fragility.
Methods
Seventy-two patients who had a lateral radiograph of the whole spine, magnetic resonance imaging of the lumbar spine, and bone densitometry, were enrolled. The spino-pelvic sagittal parameters (pelvic incidence, pelvic tilt [PT], sacral slope, thoracic kyphosis, lumbar lordosis), age, lumbar bone mineral density, and amount of back muscle around the lumbar spine were analyzed.
Results
There was higher sagittal imbalance of the spine in the vertebral fracture group (p=0.011). In spinopelvic parameters, the average of PT was 22.13° in vertebral fracture group and 13.70° in the non-fracture group (p=0.002). The amount of lower back extensor muscle in the vertebral fracture group was 2,170 mm2, which was lower than the non-fracture group (3,040 mm2, p=0.001). Multiple logistic regression analysis for the risk of osteoporotic vertebral fracture was significant in lumbar bone mineral density (odds ratio [OR], 0.313; 95% confidence interval [CI], 0.139-0.706, p=0.005) and the muscle ratio of extensor back muscle (OR, 0.902; 95% CI, 0.826-0.984; p=0.020).
Conclusions
These results suggest that osteoporotic vertebral fracture could be developed easily by weakness of extensor back muscle in sagittal imbalance of the spine with high pelvic tilt.
Introduction
Along with low bone mass, there are many other risk factors that contribute to skeletal fragility and the risk of osteoporotic vertebral fracture [1,2]. Checking bone mineral density is simple to perform and relatively objective for use as a diagnostic for developing treatment. However, it has limitations to predict and to understand osteoporotic vertebral fracture which has arisen from minor trauma or intrinsic back strain. Recently, variable risk factors, as well as bone mineral density, have been investigated for osteoporotic vertebral fracture. Particullarly the spino-pelvic parameters on spinal sagittal balance have been widely studied to help understand whether or not physical posture shows and causes certain pathologies of the spine in particular degenerative diseases [3,4,5,6,7].
Many studies have reported variances of thoracic kyphosis (TK), lumbar lordosis (LL) [8], and spinopelvic parameters on spinal sagittal balance [9,10,11,12], These studies show that these parameters are affected by age, sex, spinal fusion, and pelvic morphology [13,14]. However, the effect of spinopelvic parameters and strength of back muscles on osteoporotic vertebral fracture is not well known. We wondered whether osteoporotic vertebral fracture could be affected by abnormal spinopelvic parameters and weakness of back muscles. The age related change of sagittal balance resulted in decreasing of sacral slope accompanied with retroversion of the pelvis to compensate for the sagittal imbalance, and the extensor back muscle would be elongated and it would easily fatigue with repeated force. So we hypothesized that vertebral fracture could develop easily by weakness of extensor back muscle in sagittal imbalance.
We analyzed the correlation between spinopelvic parameters and osteoporotic vertebral fracture by comparing the parameters among a vertebral fracture group and a control group. In addition, we investigated the influence of fat infiltration of low back paravertebral muscles on osteoporotic vertebral fracture.
Materials and Methods
Between January and December in 2012, 72 patients who had lateral plain radiograph of the whole spine, magnetic resonance imaging (MRI) of the lumbar spine, and bone densitometry were enrolled. There were 21 males and 51 females, and they were divided into two groups; 38 patients in the vertebral fracture group and 34 patients in the non-fracture group. There was the mean age of 71.5 years old (range, 48-85 years old) in the vertebral fracture group and 55.0 years old (range, 27-78 years old) in the non-fracture group (Table 1). This study was performed with the approval of Institutional Review Board of Kwangju Christian Hospital.
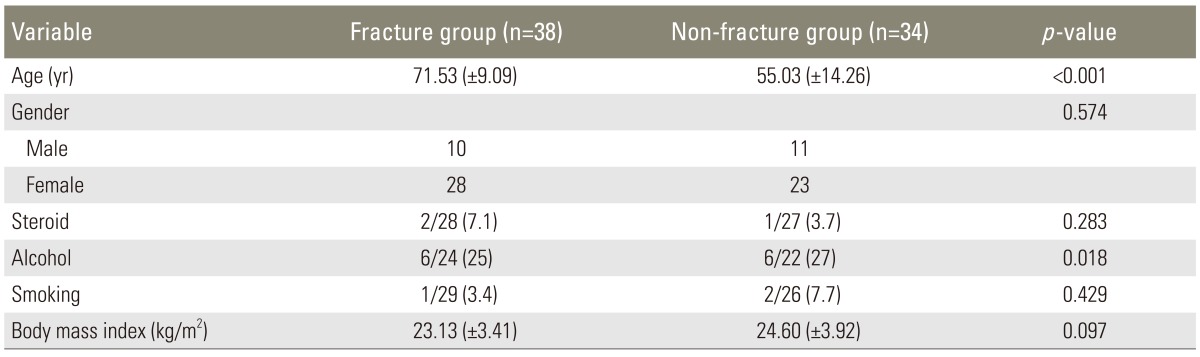
Dermographic data
Whole spine lateral X-ray including cervical spine and hip joints, was performed in all the patients in a standing position as the standard method. It was performed in an average of 5.1 months after development of the fracture in the vertebral fracture group. At this time, there was no specific influence of the fracture pain on a standing posture. Radiographic spinopelvic parameters, such as pelvic incidence, sacral slope, pelvic tilt, TK, LL, and the distance between the C7 plumb line and posterosuperior portion of S1, were measured on whole spine lateral radiograph [15]. Pelvic incidence was defined as the angle between the line connecting the hip axis and the midpoint of the superior endplate of S1 and the line perpendicular to it. Sacral slope was measured as the angle between the superior endplate of S1 and the horizontal plane. Pelvic tilt was measured as the angle between the line connecting the midpoint of the superior endplate of S1 and the hip axis, and the vertical plane. According to the Jackson's procedure [16], the angle of thoracic TK was measured from the superior endplate of T1 to the inferior endplate of T12. The angle of LL was measured from the inferior endplate of T12 to the superior endplate of S1 by the Cobb's method. To evaluate the global sagittal balance, the horizontal distance between the posterosuperior of S1 and the C7 plumbline was also measured, and sagittal balanced spine was defined within 50mm anteriorly and 20 mm posteriorly while sagittal imbalanced spine was defined beyond this range (Fig. 1A) [17].

A 73 year-old male patient. (A) In standing lateral X-ray, pelvic incidence [A] was 48°, pelvic tilt [B] was 11° and sacral slope [C] was 37°. The horizontal distance between the posterosuperial corner of S1 and the C7 plumbline [D] was 83 mm (imbalanced). (B) The paraspinal muscle of the lumbar (around L3) was weakened (amount of erector supine muscle: 2,037 mm2, 42.5%). (C) Lumbar BMD was -4.0 of T score. DXA, dual-energy X-ray absorptiometry; BMC, bone mineral content; BMD, bone mineral density; PR, peak reference; AM, age matched; WHO, World Health Organization.
For evaluation of paravertebral muscles, MRI images were obtained with 1.5-T Signa Excite GE (General Electric, Milwaukee, WI, USA) and the images were analyzed as DICOM files loaded in the Picture Archiving and Communication System (PACS) with PiView (Infinitt, Seoul, Korea). Pseudocoloring technique introduced by Lee et al. [18] were used to calculate the amount of paravertebral muscles and the degree of fatty infiltration at the third lumbar vertebrae. Pseudocoloring technique is one image analyzing tool which can calculate the ratio of fat out of total area of the paravertebral muscles by applying the previously obtained signal intensity of the fat to the histogram of regions of interest at the third lumbar vertebrae. Both sides, right and left, were calculated, and the mean value was used (Fig. 1B).
Bone mineral density was obtained using dual-energy X-ray absortiometry scan (Explorer, Hologic Co., Bedford, MA, USA).
For statistical analysis, SPSS ver. 12.0 (SPSS, Chicago, Il, USA) was used. Intergroup differences were determined with the use of the normality test for continuous variables, and then the independent T test for significance. Pearson chi-square was used to analyze correlation of all the variables and the χ squared test was used for cross tabulation analysis between fracture and sagittal balance. Univariate logistic regression analysis for each variable was used to identify fracture risk factors, and then multiple logistic regression analysis for the variables of p-value <0.25 was used to determine the relative risk and confidence interval. A p-value of <0.05 was considered significant.
Results
Of the spinopelvic parameters, pelvic incidence was higher in the vertebral fracture group (51.03°) than in the non-fracture group (43.35°), which was statistically significant (p=0.007). Pelvic tilt was 22.13° in the vertebral fracture group and 13.71° in the non-fracture group and there was large pelvic tilt in vertebral fracture group (p=0.002). Sacral slope was lower in the vertebral fracture group (28.8°) than in the non-fracture group (30.1°), but there was no statistical significance (p=0.499). There was also no significant difference in TK and LL between the groups. On the other hand, the distance between C7 plumb line and S1 posterosuperior portion revealed significant statistical difference; 66.32 mm in the vertebral fracture group and 22.76 mm in the non-fracture group (p=0.001) (Table 2). Of the 72 patients, 44 patients (18 of the vertebral fracture group versus 26 of the non-fracture group) showed balanced sagittal spine while 28 patients (20 of the vertebral fracture group versus 8 of the non-fracture group) showed imbalanced sagittal spine, there was higher sagittal imbalance of the spine in the vertebral fracture group (p=0.011).
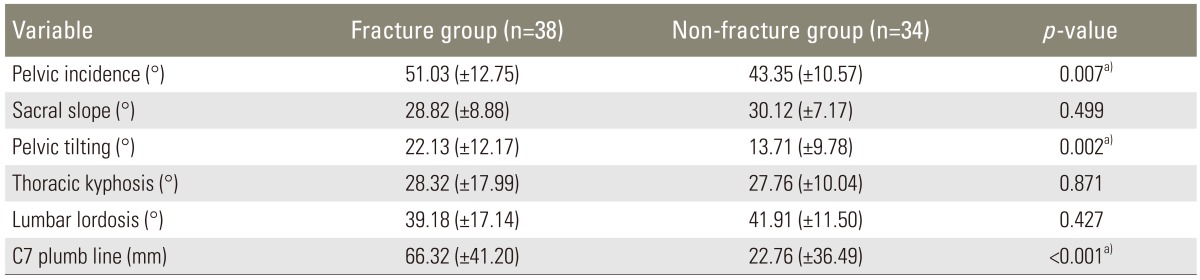
Comparison of the spinopelvic parameters
For evaluation of the fatty infiltration at low lumbar paravertebral muscles, the amount of erector spinae muscle calculated with MRI revealed 2,170 mm2 in the vertebral fracture group and 3,040 mm2 in the non-fracture group, which was statistically significant (p=0.001). The ratio of the muscle, calculated by subtracting fatty infiltration from 100, was 51.05% in the fracture group and 61.72% in the non-fracture group, which was also statistically significant (p=0.001). The amount of flexor muscles, the psoas muscle, and the quadratus lumborum, also revealed significant differences between the two groups; 1,515 mm2 in the vertebral fracture group and 2,110 mm2 in the non-fracture group (p=0.001), however, there was no statistical significance in the ratio of muscle (75.75% and 79.66%, respectively; p=0.216) (Table 3).
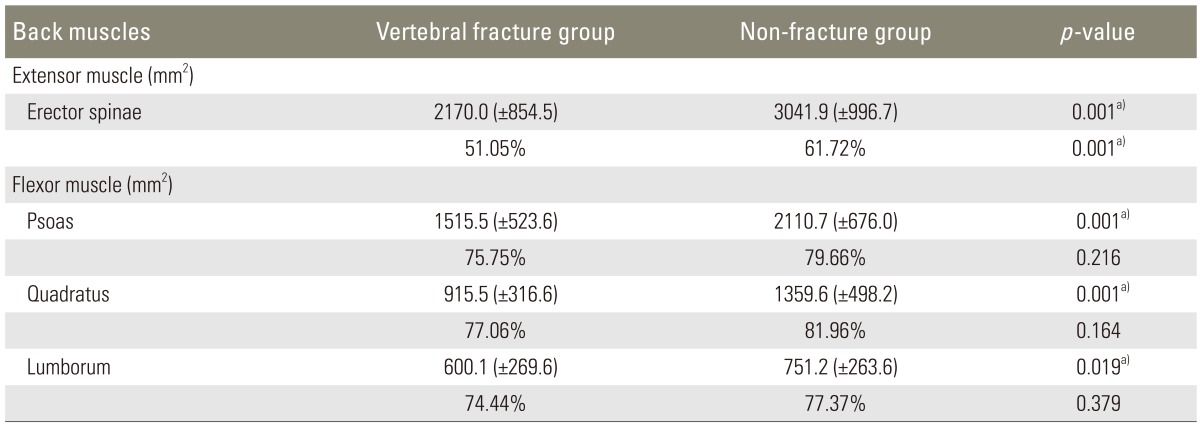
Comparison of the area and fat infiltration ratio of the back muscles
Bone mineral density, (mean of lumbar spine T-score 2.94) in the vertebral fracture group was significantly lower than in the non-fracture group (T-score, 0.92). We attributed this result to differences in the ages of the two groups (p=0.001).
In statistical analysis of variables, there was linear relationship between spinopelvic parameters and patient's factors (Table 4). Univariate logistic regression analysis for each variable was used to identify fracture risk factors (Table 5), and then multiple logistic regression analysis for the variables of p-value <0.25 was used to determine the relative risk and confidence interval. Multiple logistic regression analysis showed significance in lumbar bone mineral density (T-score) (odds ratio [OR], 0.313; 95% confidence interval [CI], 0.1390.706; p=0.005) and muscle ratio of extensor back muscle (OR, 0.902; 95% CI; 0.8260.984; p=0.020), but there was no significance in the other variables (Table 6).
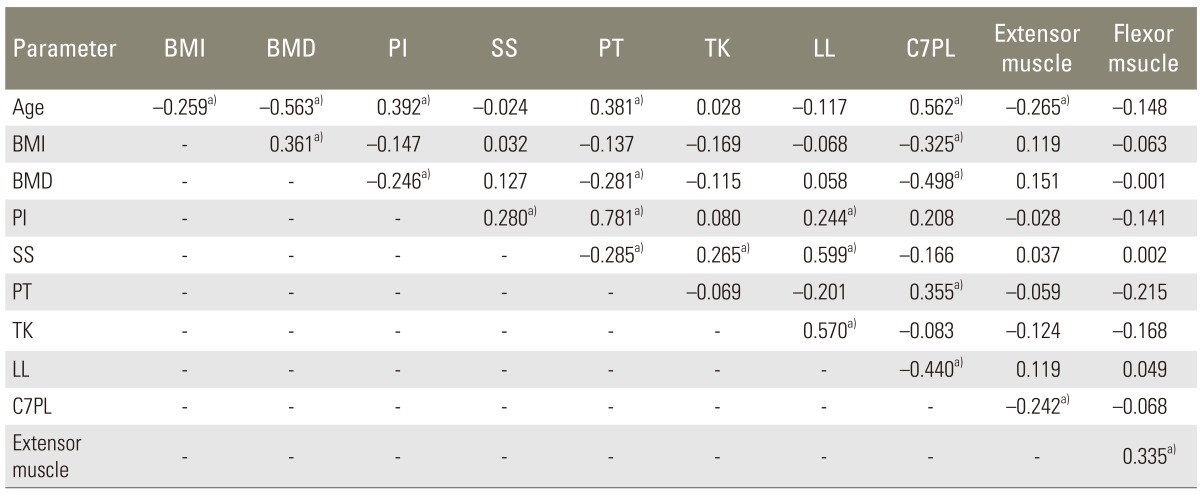
Correlations of the spinopelvic parameters
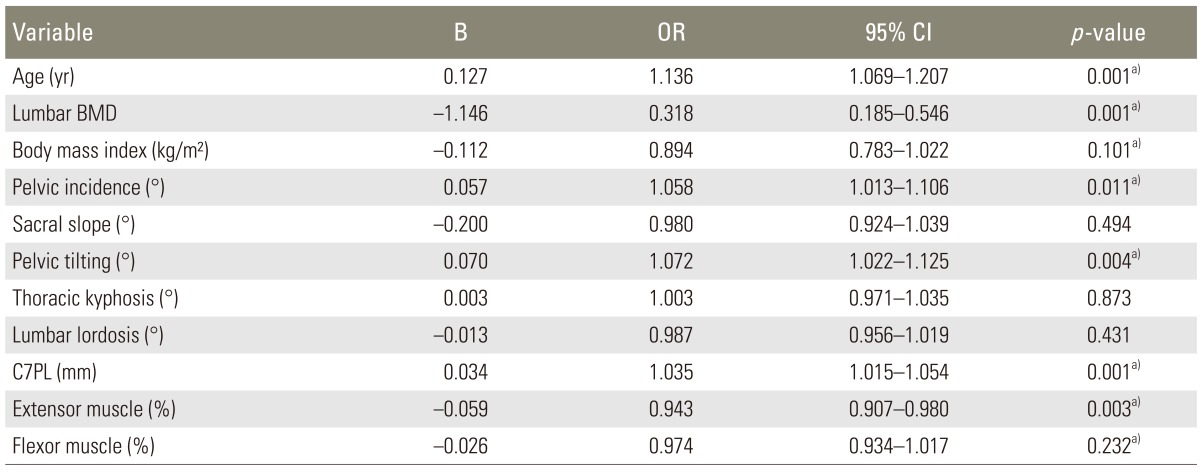
Univariate logistic regression analysis for osteoporotic vertebral fracture

Mulitple logistic regression analysis for osteoporotic vertebral fracture
Discussion
Thoracic/lumbar angle ratio (T/L ratio) increases with age as the reduction of LL, results in sagittal imbalance of the spine. Generally, there is an increase in the TK angle and lumbar hyperlordosis to maintain sagittal balance of the spine [19,20]. In addition, Imagama et al. [21] reported that sagittal balance of the spine was maintained in individuals with good range of motion of the thoracic and lumbar spine and strong back muscle.
According to our results, there was higher sagittal imbalance of the spine in the vertebral fracture group (p=0.011). In the elderly, decreases in the LL angle and sacral inclination angle due to aging-related changes, such as osteophyte formation or disc degeneration, resulted in an increased T/L ratio, causing a posture with the head bent forward. Generally, an increase in the TK angle causes lumbar hyperlordosis to maintain sagittal balance in high pelvic incidence. However, a decrease of LL with aging results in sagittal imbalance. For other issue of sagittal balance, Roussouly and Pinheiro-Franco [22] reported a relationship between LL and paravertebral muscles. The contact force was described as the sum of gravity and the force on back extensor muscles, and the contact force increased with age because the effect of gravity increases as the reduction of LL induces forward bending of the trunk and retroversion of the pelvis. Furthermore, the force on the extensor muscles may increase as a counter force to the increased gravity, which causes increased loading on the extensor muscles. Age-related changes of the spine and weakness of the back extensor muscles cause a posture with the trunk bent forward. As the thoracic spine of the elderly is limited in compensating and cannot bear decreased LL, the presence of TK may lead to posture with the trunk bent forward, which would eventually cause sagittal imbalance.
Change of pelvic tilt is considered an important index to estimate the balance and the degree of compensation of the pelvis in pathologic condition. In this study, the mean pelvic tilt in the vertebral fracture group was 22.12°, which indicated more retroversion than 13.7° of the non-fracture group. Lee et al. [23] reported mean pelvic tilt of 21° in the normal group and 38.4° in the group with sagittal imbalance; this was quite different than our study, but high pelvic tilt was shown in the sagittal imbalanced group in both studies. We think that anterior tilting of the trunk is compensated for with an increase of pelvic tilt to the change of sagittal balance, which is accompanied with retroversion of pelvis.
According to this presented study, back extensor muscle in the vertebral fracture group was significantly lower (2,170 mm2), than in the non-fracture group (3,040 mm2, p=0.001). And the ratio of muscle also showed significant difference; 51.05% in the vertebral fracture group versus 61.72% in the non-fracture group. There are many risk factors that contribute to osteoporotic vertebral fracture. The back extensor muscles take an important role in preventing osteoporotic vertebral fracture. Some studies reported high correlation between osteoporotic vertebral fracture and weakness of back extensor muscles [24,25,26,27,28,29]. In fact, there is a linear correlation between the incidence rate of the fracture and bone mineral density, but vertebral fractures could occurr in osteopenia, defined by World Health Organization, as well as in osteoporosis. Therefore, it is not enough to predict osteoporotic vertebral fracture with only bone mineral density. Our results of multiple logistic regression analysis revealed muscle ratio of the extensor back muscle as a risk factor for osteoporotic vertebral fracture.
And we concluded that spinopelvic parameters may have an effect on muscles with age as a serial sequence, we analyzed the factors related to compensation of the pelvis. We tried to elucidate the role of paravertebral muscles in maintaining spinal sagittal balance. Consequently, the change of sagittal balance with age resulted in retroversion of the pelvis and an increase of pelvic tilt. An increased T/L ratio allows the C7 plumb line to stay behind the vertical line passing through the center between the femoral heads as well as the gravity line to fall between the two feet (Fig. 1). At the same time, the back extensor muscles can act as a posterior tension band contributing to restoring LL. Under a posture with the trunk bent forward and sagittal imbalance, the insufficient vertebral fracture could be developed easily from minor trauma or intrinsic strain such as dynamic motion, especially at osteoporotic vertebra. These results suggest that it is important for the elderly to maintain sagittal balance with constant exercise to keep good spinal range of motion and strength of back extensor muscle.
This study has some limitations. First, there was nonhomogenous demographic data, particularly the ages of the study group and the control group. Second, it was a retrospective study Third, the number of patients was too small to evaluate multifactorial risks. Fourth, there was a possibility of the change of variables, such as pelvic tilt, sacral slope, TK, LL, and sagittal balance resulting from influence of the fracture itself because lateral plain radiograph of the whole spine was taken at average of 5.1 months after the fracture. However, despite these limitations, this study identifies potential areas for future research. To achieve more reliability, prospective cohort study is needed to investigate the risk factors of osteoporotic vertebral fracture as a general population in the future.
Conclusions
These results suggest that osteoporotic vertebral fracture can be developed easily with weakness of the extensor back muscle in sagittal imbalance of the spine with high pelvic tilt. So it is important for the elderly to maintain sagittal balance with constant exercise to keep good spinal range of motion and strength of the back extensor muscle.
Notes
Conflict of Interest: No potential conflict of interest relevant to this article was reported.