Evaluation of Sagittal Spine-Pelvis-Lower Limb Alignment in Elderly Women with Pelvic Retroversion while Standing and Walking Using a Three-Dimensional Musculoskeletal Model
Article information
Abstract
Study Design
In vivo biomechanical study using a three-dimensional (3D) musculoskeletal model for elderly individuals with or without pelvic retroversion.
Purpose
To evaluate the effect of pelvic retroversion on the sagittal alignment of the spine, pelvis, and lower limb in elderly females while standing and walking.
Overview of Literature
Patients with hip–spine syndrome have concurrent hip-joint and spine diseases. However, the dynamic sagittal alignment between the hip joint and spine has rarely been investigated. We used a 3D musculoskeletal model to evaluate global spinopelvic parameters, including spinal inclination and pelvic tilt (PT).
Methods
A total of 32 ambulant females (mean age=78 years) without assistance were enrolled in the study. On the basis of the radiographic measurement for PT, participants were divided into the pelvic retroversion group (R-group; PT≥20°) and the normal group (N-group; PT<20°). A 3D musculoskeletal motion analysis system was used to analyze the calculated value for the alignment of spine, pelvis, and lower limb, including calculated (C)-PT, sagittal vertical axis (C-SVA), pelvic incidence, lumbar lordosis, T1 pelvic angle (C-TPA), as well as knee and hip flexion angles while standing and walking.
Results
While standing, C-PT and C-TPA in the R-group were significantly larger than those in the N-group. Hip angle was significantly smaller in the R-group than in the N-group, unlike knee angle, which did not show difference. While walking, C-SVA and C-TPA were significantly increased, whereas C-PT decreased compared with those while standing. The maximum hip-flexion angle was significantly smaller in the R-group than in the N-group. There was a significant correlation between the radiographic and calculated parameters.
Conclusions
The 3D musculoskeletal model was useful in evaluating the sagittal alignment of the spine, pelvis, and leg. Spinopelvic sagittal alignment showed deterioration while walking. C-PT was significantly decreased while walking in the R-group, indicating possible compensatory mechanisms attempting to increase coverage of the femoral head. The reduction in the hip flexion angle in the R-group was also considered as a compensatory mechanism.
Introduction
Adult spinal deformity has been associated with multiple musculoskeletal complaints, including back pain, difficulty in maintaining posture, muscle fatigue, and walking difficulty because of trunk imbalance. Patients presenting with spine disease occasionally have concurrent hip-joint disease, known as hip-spine syndrome. For example, posterior pelvic tilt (PT) in patients with decreased lumbar lordosis because of the hip–spine syndrome decreases the acetabular covering of the femoral head [1]. However, as the morbidity of both conditions is increased with age, whether spine disease and osteoarthritis of the lower extremities are correlated or are coexistent remains unclear.
Investigation of the normal spinal sagittal alignment in elderly individuals without osteoarthritis of the lower extremities or spine disease may help to determine the correlation between the two conditions. A previous study measured lateral standing roentgenograms of the whole spine in 99 consecutive asymptomatic Greek subjects (average age=52.7±15 years), concluding that thoracic kyphosis increased significantly with age, and that total lumbar lordosis and PT were not age-related [2]. However, consideration of only the static condition in lateral standing roentgenograms of the whole spine is not reflective of actual posture or movement. Currently, the analysis of the cooperative movement of the spine, pelvis, and leg with standard roentgenograms during activities such as walking remains challenging. Thus, it may be beneficial to investigate the motion of spinopelvic sagittal alignment as well as lower extremities in elderly individuals with the aid of mathematical models, so as to clarify the compensatory mechanism involved.
Previous studies have investigated the kinematics of gait in healthy subjects [34]. Recently, the methods of studying human motion have rapidly advanced, because of the development of 3D motion analysis systems. These systems can record and analyze the movement of each segment of the human body in the sagittal, frontal, and transverse planes [567]. Gait analysis using these systems is a valuable tool in the assessment of gait disturbances and in the objective evaluation of treatment [8910]. However, few reports have described gait analysis with a focus on subjects with pelvic retroversion.
The objectives of the current study were to compare the following, using a 3-dimentional (3D) musculoskeletal model of elderly individuals: (1) the sagittal alignment of spine, pelvis, and leg between subjects with and without pelvic retroversion; (2) changes in the alignment while standing and walking.
Materials and Methods
The ethics committee of our institute approved the study protocol. All subjects provided written informed consent before participating in this study.
1. Subjects
Thirty-two elderly females able to walk without assistance were enrolled in the study. The mean age was 78 years (range, 68–88 years). Whole-spine lateral radiographs in the fists-on-clavicle position were evaluated for the angles of the pelvic tilt (PT), sagittal vertical axis (SVA), pelvic incidence (PI), lumbar lordosis (LL), and T1 pelvic angle (TPA). Patients were assigned to either the pelvic retroversion group (R-group; PT ≥20°) or the normal group (N-group; PT<20°) [11]. Exclusion criteria were as follows: (1) spinal fusion, total hip arthroplasty, or total knee arthroplasty; (2) severe osteoarthritis of the hip or knee; (3) previous surgical treatments or injuries to the locomotor system resulting in persistent deformities of the lower extremities and/or the trunk.
2. Data collection
Kinematic data were acquired for all cases using a 3D motion analysis system (VICON MX system, VICON Oxford Metrics, UK), capturing the positions of multiple markers on body surface with eight infrared cameras (MX-T40, VICON Motion Systems) operating at 100-Hz frequency. A total of 35 reflective markers were attached to the forehead, occiput, 7th cervical vertebra, 10th thoracic vertebra, superior border of the sternum, xiphoid process, acromia, center of the right scapula, lateral epicondyles of the humeri, styloid processes of the ulnae, styloid processes of the radii, second metacarpal bones, anterior superior iliac spines, posterior superior iliac spines, midpoints of the femoral shafts, lateral points of the knees, midpoints of the tibial shafts, lateral malleoli, second metatarsal heads, and heels (Fig. 1). Initially, data were obtained while the subjects remained motionless in the upright standing position for approximately 10 seconds with their arms at the sides of the body (static standing). Subsequently, the subjects were instructed to walk at their own pace along a 10-m walkway for approximately 5 minutes as practice. Data for the position of each skin markers were captured. A single gait cycle of kinematic data was recorded for each trial.
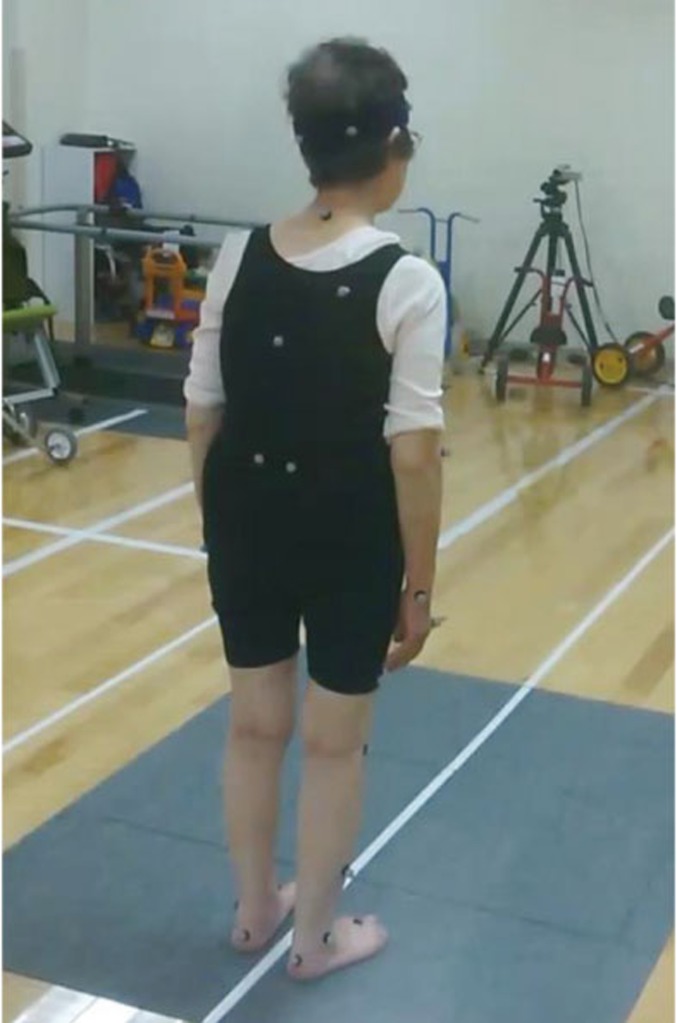
Thirty-five markers are placed on the limbs and trunk.
3. The original 3D musculoskeletal model
A 3D musculoskeletal model produced from whole-body computed tomography (CT) and magnetic resonance imaging (MRI) scans of a 31-year-old healthy man (height, 1.74 m; weight, 78.5 kg) was used [12]. Skeletal structures of the bone were visualized from the CT images, and reconstructed into a 3D bone model. Similarly, muscle structures were visualized from whole-body MRI scans, and reconstructed into a 3D muscular model. These morphological data were reconstructed using the equivalent impedance characteristics analysis system (EICAS, Toyota Central R&D Labs, Japan) to produce the musculoskeletal model [13]. Intra-abdominal pressure and physiological trunk range of motion were incorporated into the model as internal biological forces (Fig. 2).
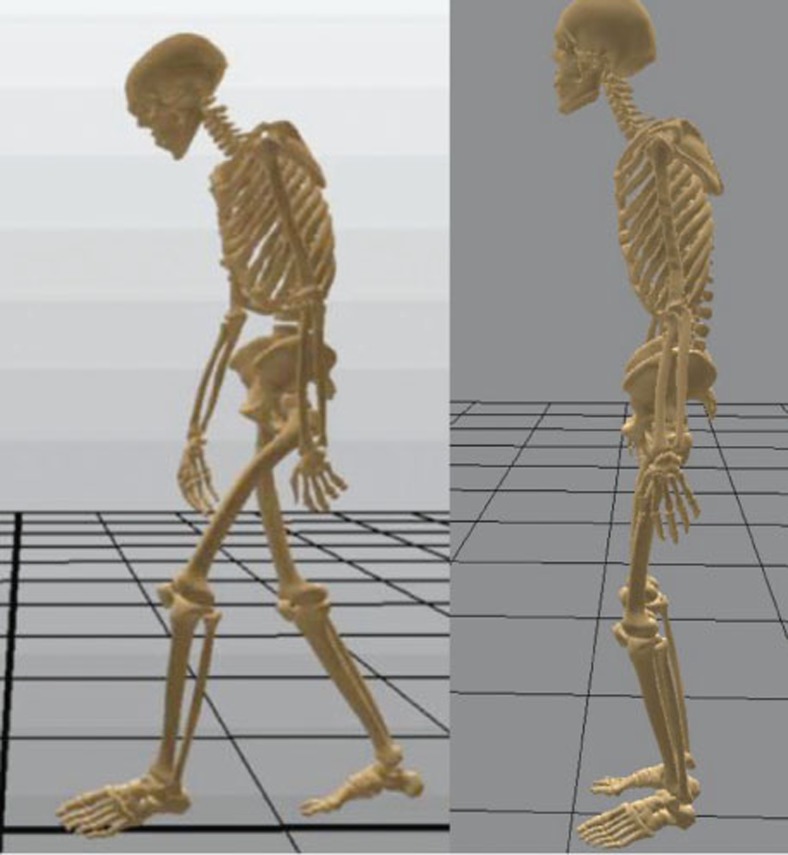
Three-dimensional musculoskeletal model.
4. Data analysis
Data obtained from each subject using VICON were input into the musculoskeletal model, and subsequently, the parameters of sagittal alignment for the spine, pelvis, and legs were calculated after adjusting for height. This analysis was described in detail in a previous study by Yoshikawa et al. [14], analyzing trunk motion while standing in the upright and forward bending position with this model.
Calculated parameters were evaluated as C (calculated)-SVA, C-PT, C-PI-LL, and C-TPA in static standing and walking. The data were calculated as the average values during a single gait cycle of walking and during static standing for 10 seconds. The hip and knee joint angles while standing and walking were calculated using the Euler angle method, which represents 3D rotations for flexion/extension according to the recommendations of the International Society of Biomechanics [1516]. Hip and knee angle while static standing were shown as “hip-flexion angle” and “knee-flexion angle,” and the maximum extension and flexion angles of the hip and knee while walking were also evaluated.
5. Statistical analysis
The results were expressed as mean±standard deviation. All statistical analyses were performed using the SPSS ver. 12 (SPSS Inc., Chicago, IL, USA). Parametric and nonparametric tests were used as appropriate to assess continuous variables for significant differences between groups. Unpaired Student's t-test and paired t-test were used to compare variables between the two groups, and between standing and walking, respectively. Correlations between the radiographic and calculated parameters were analyzed using Pearson's correlation coefficient. A p-values of <0.05 were considered statistically significant.
Results
Of the 32 patients enrolled, 12 and 20 patients were assigned to the N-group and R-group, respectively. The demographic data of both groups are shown in Table 1. There were no significant differences between the groups except for body height. Radiographic data are shown in Table 2. The R-group demonstrated significantly larger PT, PI-LL, and TPA.
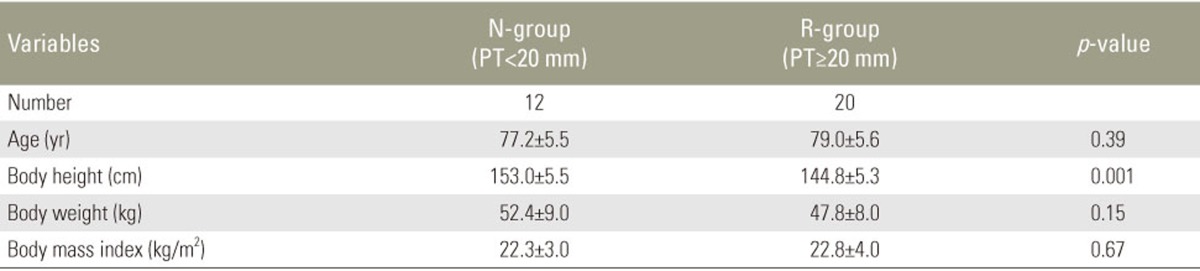
Comparison of demographic data
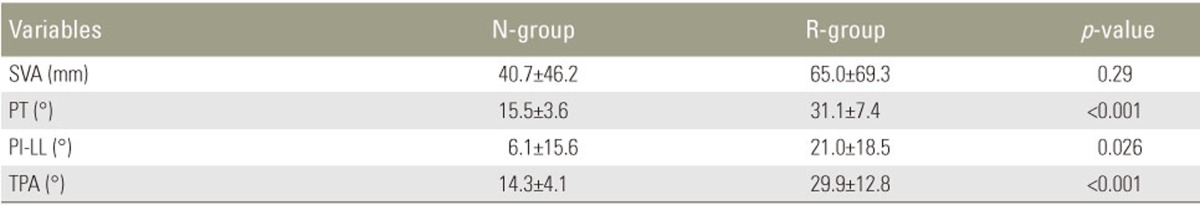
Comparison of radiographic parameter of spine and pelvis
The analysis for calculated parameters between the N- and R-groups during static standing and walking is presented in Fig. 3. There was no significant difference in C-SVA between the groups for both standing and walking, whereas C-SVA significantly increased while walking in both groups (Fig. 3A). C-PT while standing in the R-group was significantly larger than in the N-group, and no significant difference was reported between the groups while walking. C-PT in the R-group significantly decreased while walking compared with while standing, whereas no change was found in the N-group (Fig. 3B). Similarly, no significant difference in C-PI-LL was found between the groups, and also between standing and walking (Fig. 3C). There was a significant difference between the groups in C-TPA while standing, but no difference was found while walking. C-TPA in the N-group was significantly increased after walking; however, no change was reported in the R-group (Fig. 3D).
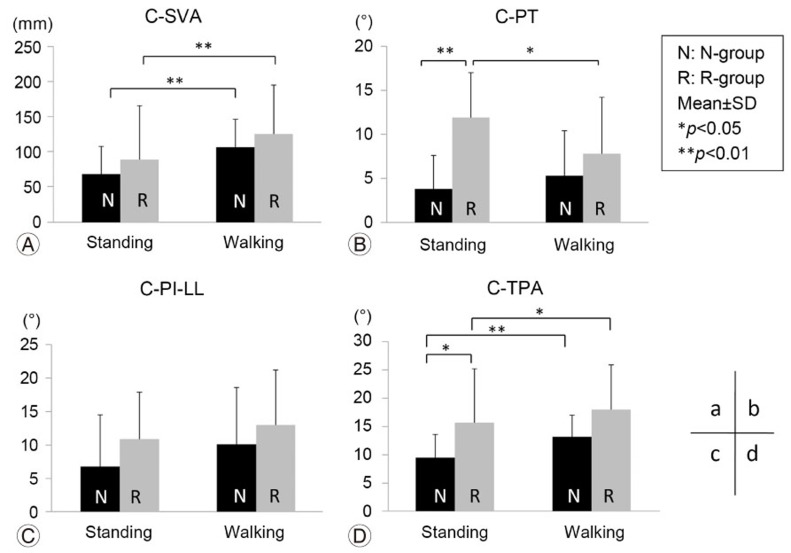
(A–D) Comparison of calculated sagittal parameters. N-group, normal group; R-group, pelvic retroversion group; SD, standard deviation; -SVA, sagittal vertical axis; C-PT, calculated-pelvic tilt; C-PO-LL, calculated-pelvic incidence-lumbar lordosis; C-TPA, calculated T1 pelvic angle.
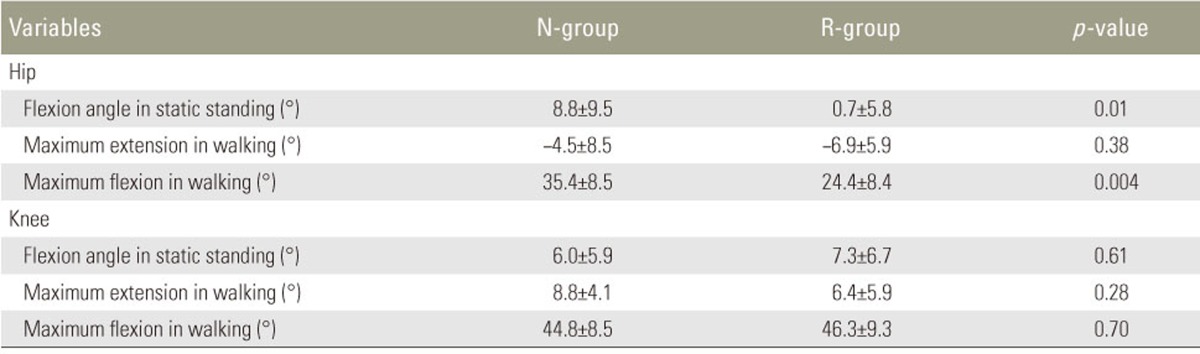
The comparison of hip and knee angles during static standing and walking is presented in Table 3. Hip angle in the standing position and maximum hip-flexion angle while walking were significantly smaller in the R-group than in the N-group (p=0.01 and p=0.004, respectively). No significant differences in maximum hip extension while walking, knee-flexion angle, as well as maximum knee extension and flexion angle while walking were found between the groups (Table 4).
Comparison of joint angle in static standing and walking
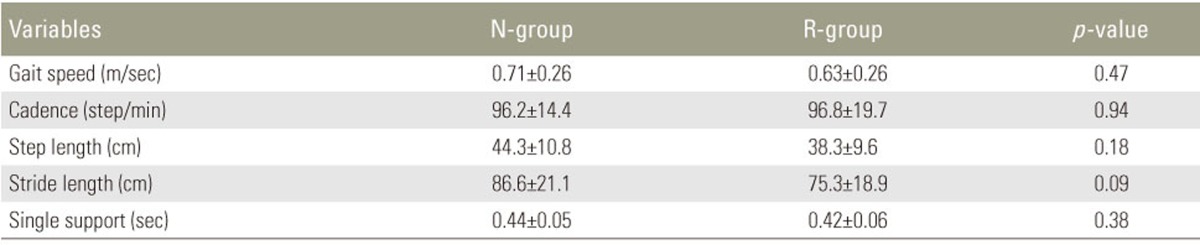
Comparison of walking parameters
Because the radiographic sagittal parameters for the spine and pelvis were different from the calculated parameters, the correlation between the two different methodologies were analyzed. A significant correlation between radiographic parameters and calculated parameters in all spinopelvic parameters was revealed (Table 5, Fig. 4).
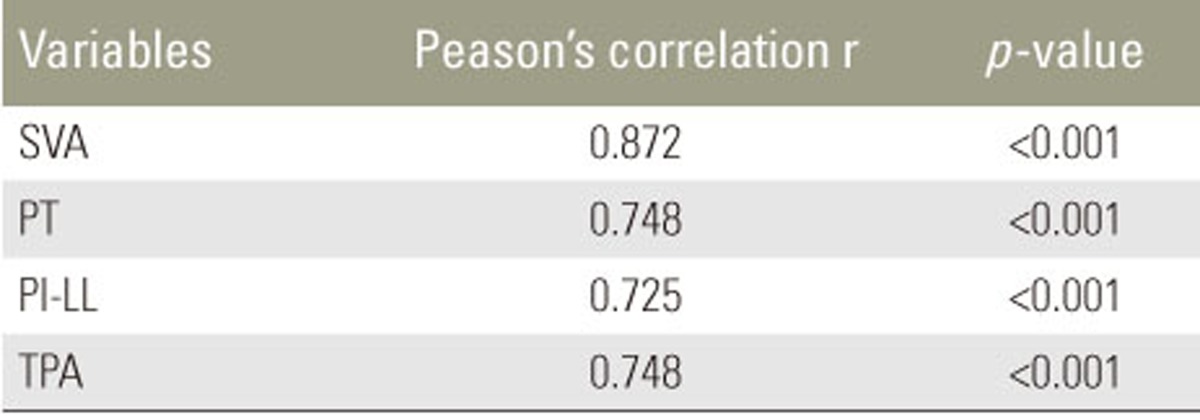
Correlation between radiographic and calculated spino-pelvic parameters

Correlation between radiographic and calculated PT. PT, pelvic tilt.
Discussion
In the present study, changes in the sagittal alignment of the spine, pelvis, and leg while standing and walking were analyzed using a 3D musculoskeletal model. Significant differences were found between the groups for C-PT and C-TPA while standing, which is similar to the results of radiographic data. However, the data for the sagittal alignment of the spine and pelvis calculated with this model differed from actual radiographic data. The reasons for the discrepancies between the two methods may be because of the gaps between the skin markers and the actual skeletal structures. In addition, these differences may be caused by the position of the upper extremities i.e., fistson-clavicle position, while the subjects were relaxed with arms at sides in a static standing position during motion analysis. However, the data derived from this model were strongly correlated with the radiographic parameters, validating this methodology. This model may be used for analysis in the absence of radiography.
Sagittal imbalance by increased spinal kyphosis or pelvic posterior tilt during static standing is a critical factor affecting patient quality of life [1718]. A previous study measured spinopelvic parameters on standing lateral radiographs and assessed sagittal modifiers. The investigators reported that pelvic incidence, minus lumbar lordosis, SVA, and PT are correlated, especially in pelvic retroversion patients with greater SVA as compensation [11]. In this study, radiographic PT was used to categorize kyphotic patients into the N- and R-groups, and radiographic SVA and C-SVA assessments demonstrated no significant difference between the groups. SVA is generally used as a simple and useful measurement for the evaluation of sagittal spinal deformity. However, the absence of difference in SVA between the groups may be because of the large variation of data. Moreover, SVA may be dependent on the posture or compensation. On the other hand, significant differences were identified between the groups both in radiographic TPA and C-TPA while standing. TPA, the angle between the hips–T1 line and hips–S1 endplate line, is a novel spinopelvic parameter assessing the combined effect of trunk inclination and pelvic retroversion [19]. The severe deformity threshold for TPA was 20°. In 17 out of the 20 subjects in the R-group TPA values were high. Therefore, TPA measurement may be useful to evaluate global sagittal alignment, especially in patients with pelvic retroversion without considering the compensation.
Sagittal parameters of the spine and pelvis significantly changed while walking compared with static standing in both groups. In the N-group, C-SVA, and C-TPA significantly increased after walking, however, no change was found in C-PT and C-PI-LL. In contrast, in the R-group, C-SVA, and C-TPA significantly increased while walking compared with standing, and C-PT significantly decreased while walking. C-PT was the only parameter showing no difference while walking in the N-group. This finding indicated that compensation of the alignment while walking occurred only by increasing SVA without movement of the pelvis. The significant decrease of pelvic retroversion in the R-group suggested compensation as an attempt to cover the femoral head.
Patients with kyphosis attempt to maintain the upright position while standing and walking using certain compensatory mechanisms. One of these compensations is pelvic retroversion, as mentioned above. Kyphosis patients tilt their pelvis posteriorly, while hyperextending the hip joint. The present results showed a smaller hip-flexion angle in the standing position and smaller flexion angle while walking in the R-group, indicating the compensation of hip joint for pelvic retroversion. An insufficient compensation by the pelvis and hip may lead to increased bending of the knee joint. However, there was no significant difference in the knee angle between standing and walking. In this clinical setting, pelvis retroversion and hip extension may sufficiently function as a compensatory mechanism.
Since Offierski and MacNab [1] first reported the hip-spine syndrome, it is widely accepted that the hip and spine correlate with each other. PT retroversion is thought to occur because of aging. The increase in pelvic retroversion occurs because of multiple contributing factors, including spinal kyphosis, decreased paravertebral muscle strength, and collapse of the pelvic support mechanism.
Pelvic retroversion is responsible for primary hip osteoarthritis or rapidly destructive coxarthropathy. Coxarthrosis cases with lumbar kyphosis have osteoporosis, progress rapidly, and are most common in elderly individuals. The acetabular femoral head covering changes with posture, and the main load becomes the anterior aspect of the acetabulum [20]. Thus, stress is concentrated at the front of the femoral head, and cartilage degeneration may progress when the center of gravity is shifted forward by kyphosis. Spinal kyphosis patients presenting with posterior PT with decreased lumbar lordosis have decreased acetabular femoral head covering and may experience forward dislocation of total hip arthroplasty [21]. In the present study, C-PT in the R-group was significantly decreased while walking. However, C-PT in the N-group did not change, indicating the possible compensatory mechanisms trying to increase coverage of the femoral head while walking. Thus, evaluation of alignment of the spine with the pelvis as well as the lower limbs both while standing and walking is important for preoperative planning of hip replacement.
The present study had some limitations. Patients were analyzed only while walking short distances in the initial phase of walking. First, patients with large SVA can maintain an upright standing position for a short time using compensatory mechanisms. However, persistent standing or walking may lead to the collapse of the compensatory mechanism. The global sagittal alignment with pelvic retroversion worsened over time after initiation of walking [22]. However, even with the short period of preparation before data collection, we reported significant changes in walking compared with standing. Second, artifact of reflective markers may be the cause of discrepancies between the radiographic and calculated results. Reflective markers on the body surface may not captured minor changes of PT. Although a strong correlation between calculated and radiographic parameters was revealed, further study is warranted to obtain more accurate calculated data compatible with radiographic measurements.
Conclusions
The 3D musculoskeletal model was useful in evaluating sagittal alignment of the spine, pelvic, and leg. Sagittal alignment of the spine and pelvis deteriorated while walking. C-PT was significantly decreased while walking in the R-group, indicating possible compensatory mechanisms attempting to increase coverage of the femoral head while walking. Decreasing the hip-flexion angle in the R-group was also considered as a compensatory mechanism.
Notes
Conflict of Interest: No potential conflict of interest relevant to this article was reported.