Asian Spine J Search

CLOSE


Asian Spine J > Volume 18(3); 2024 > Article
Xue, Sun, Wang, Liu, He, Wei, and Xi: Value of Hounsfield units measured by chest computed tomography for assessing bone density in the thoracolumbar segment of the thoracic spine

Abstract

Study Design

A retrospective study.

Purpose

To investigate the correlation between Hounsfield unit (HU) values measured by chest computed tomography (CT) and dual-energy X-ray absorptiometry (DXA) T-scores. HU-based thoracolumbar (T11 and T12) cutoff thresholds were calculated for a cohort of Chinese patients.

Overview of Literature

For patients with osteoporosis, the incidence of fractures in the thoracolumbar segment is significantly higher than that in other sites. However, most current clinical studies have focused on L1.

Methods

This retrospective study analyzed patients who underwent chest CT and DXA at our hospital between August 2021 and August 2022. Thoracic thoracolumbar segment HU values, lumbar T-scores, and hip T-scores were computed for comparison, and thoracic thoracolumbar segment HU thresholds suggestive of potential bone density abnormalities were established using receiver operating characteristic curves.

Results

In total, 470 patients (72.4% women; mean age, 65.5±12.3 years) were included in this study. DXA revealed that of the 470 patients, 90 (19%) had osteoporosis, 180 (38%) had reduced osteopenia, and 200 (43%) had normal bone mineral density (BMD). To differentiate osteoporosis from osteopenia, the HU threshold was established as 105.1 (sensitivity, 54.4%; specificity, 72.2%) for T11 and 85.7 (sensitivity, 69.4%; specificity, 61.1%) for T12. To differentiate between osteopenia and normal BMD, the HU threshold was 146.7 for T11 (sensitivity, 57.5%; specificity, 84.4%) and 135.7 for T12 (sensitivity, 59.5%; specificity, 80%).

Conclusions

This study supports the significance of HU values from chest CT for BMD assessment. Chest CT provides a new method for clinical opportunistic screening of osteoporosis. When the T11 HU is >146.7 or the T12 HU is >135.7, additional osteoporosis testing is not needed unless a vertebral fracture is detected. If the T11 HU is <105.1 or the T12 HU is <85.7, further DXA testing is strongly advised. In addition, vertebral HU values that fall faster than those of the T11 and L1 vertebrae may explain the high incidence of T12 vertebral fractures.

Introduction

Osteoporosis is a systemic bone disease characterized by the loss of bone mass and destruction of bone microstructures. With economic development and social progress, people’s lifestyles have changed dramatically, including bad habits, such as smoking, drinking, lack of physical activity, and staying up late, which are significant triggers for osteoporosis. Patients with osteoporosis, particularly the older population, have a much higher risk of fractures and other problems compared to the general population [1]. With the aging of the population, osteoporosis has become one of the most significant diseases affecting people’s lives, and its incidence is increasing annually. According to statistics [2], in 2015, the incidence of osteoporosis in people aged >50 years in China reached 27.96%.
At present, dual-energy X-ray absorptiometry (DXA) is considered the gold standard for detecting osteoporosis [3]. However, because of the effects of vessel wall calcification, articular process hyperplasia, and degenerative bone spurs, DXA-measured values are high, resulting in false negatives. Quantitative computed tomography (CT) can accurately distinguish the cancellous bone for the early diagnosis of osteoporosis. However, its application in clinical practice is limited because of the high cost of equipment, complex post-processing analysis, and high radiation exposure [4].
Many studies have shown that the Hounsfield unit (HU) values of the bone trabecula obtained by a routine CT can be used to assess osteoporosis [5], such as in the lumbar spine [68], cervical spine [9,10], thoracic spine [11], femur [12], pelvis [13], and ulna [14]. In clinical practice, chest CT [15], a widely used and highly accessible test, can be used for lung cancer screening and chronic obstructive pulmonary disease detection. Osteoporosis can be predicted using the HU value of the spine measured by chest CT without additional cost and radiation exposure.
The thoracolumbar segment is susceptible to fractures because of the loss of rib stabilization, change in the spinal curvature (from posterior convexity of the thoracic spine to anterior convexity of the lumbar spine), which causes stress concentration, and change in the direction of the facet joints (from the coronal plane of the thoracic spine to the sagittal plane of the lumbar spine), which increases rotational load. In patients with osteoporosis, the incidence of fractures in the thoracolumbar segment is significantly higher than that in other sites, with T11, T12, and L1 as the most susceptible vertebrae [16]. However, most current clinical studies have focused on L1, with a few opting for T12 replacement because of L1 fractures, and a few involving T11. Therefore, in the present study, chest CT was selected for opportunistic screening of osteoporosis in a Chinese population to obtain optimal HU values for predicting the thoracolumbar segment (T11 and T12) of the thoracic spine in patients with osteoporosis, osteopenia, and normal bone density.

Materials and Methods

Patient population

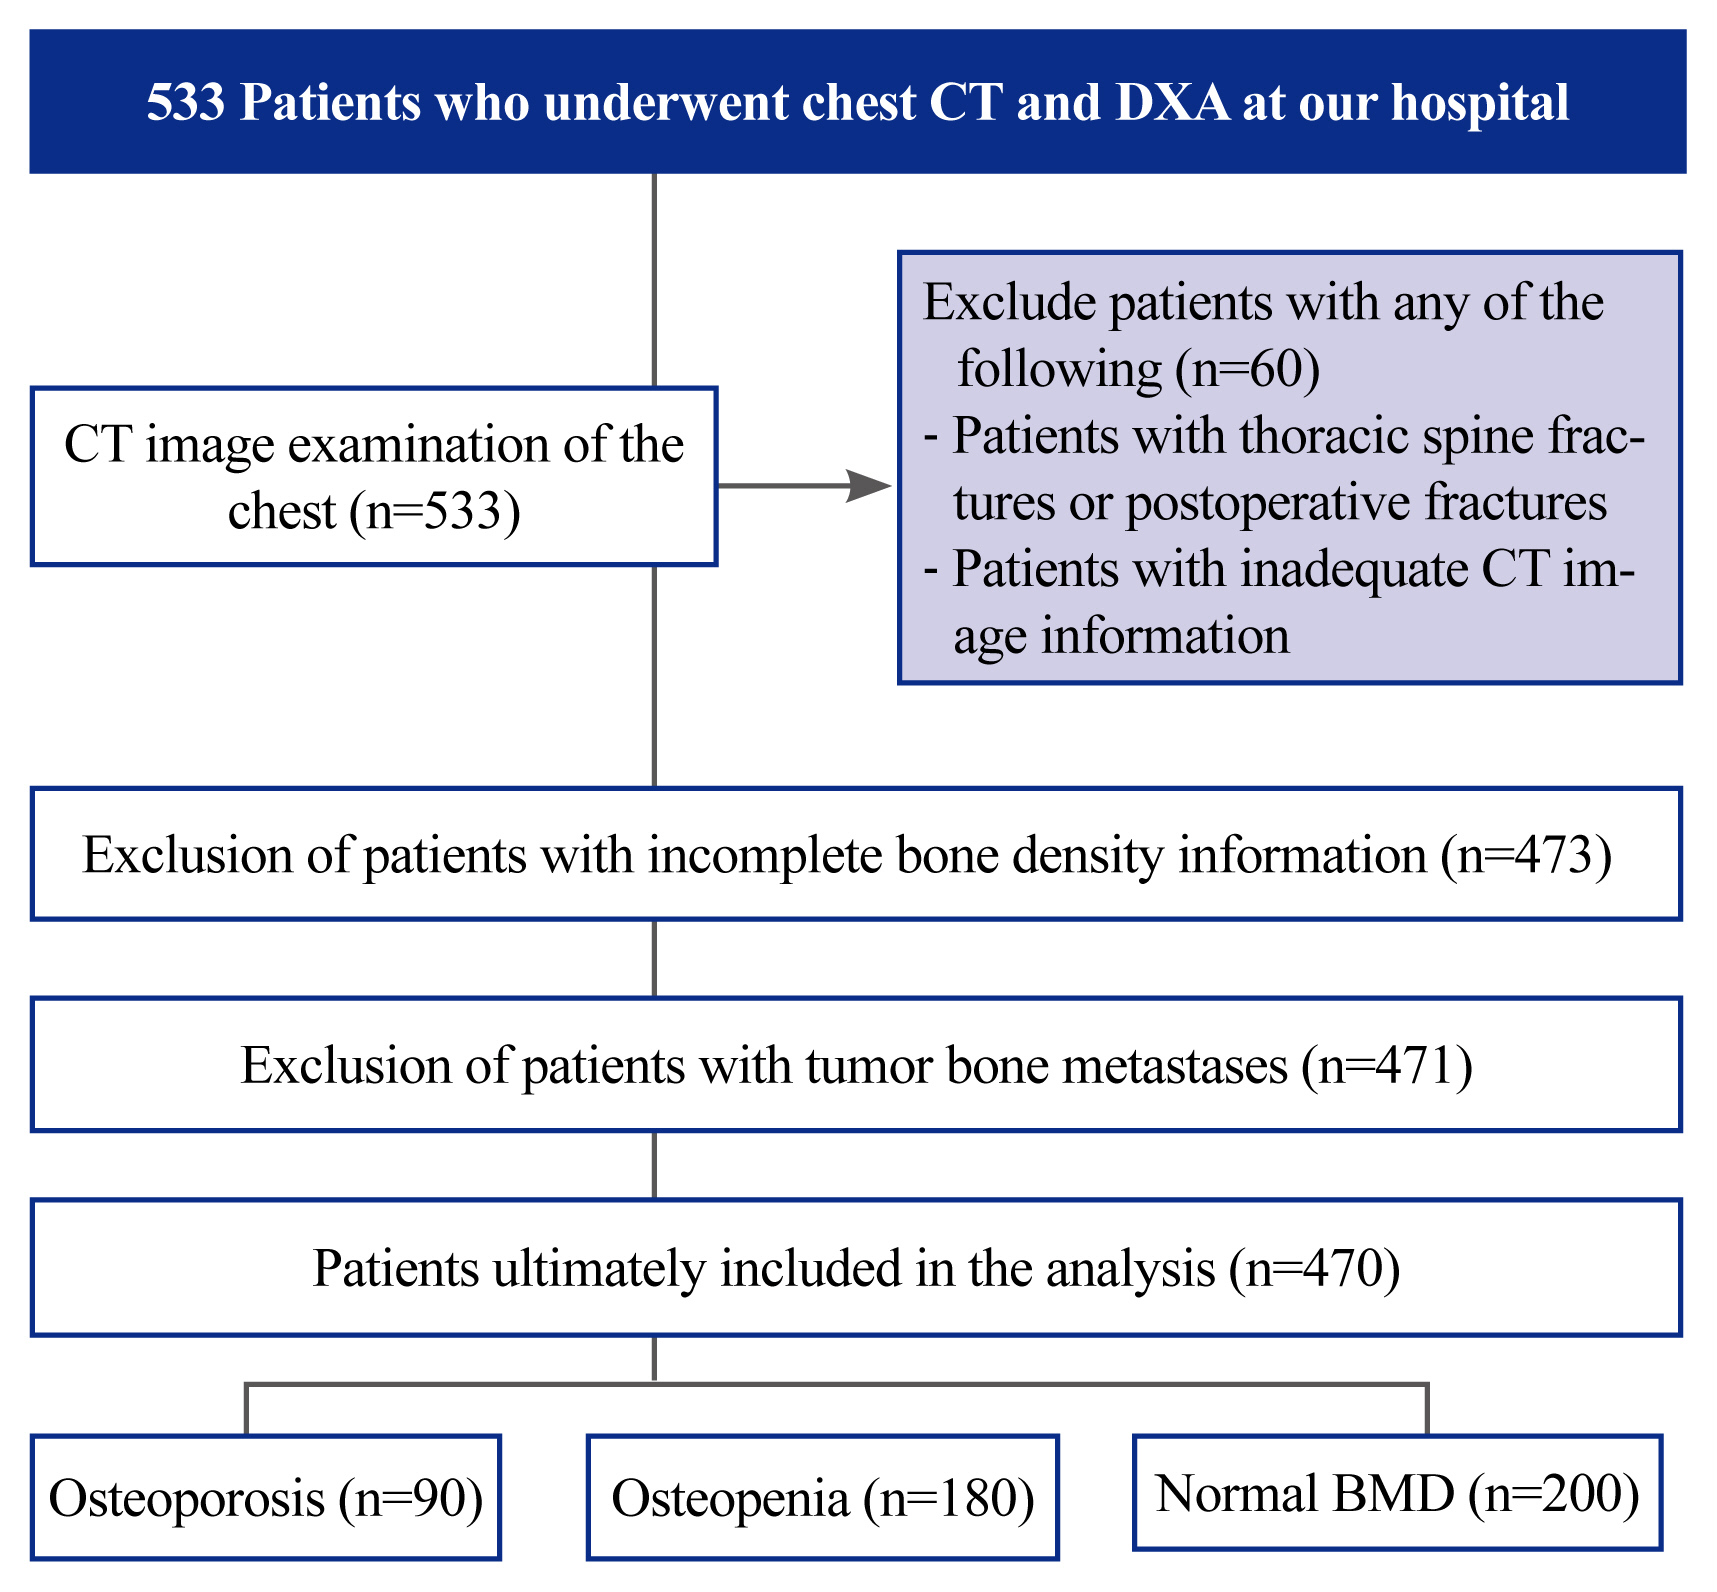
Patients who attended inpatient or outpatient clinics at the Jiangsu Provincial Hospital of Integrative Medicine between August 1, 2021, and August 31, 2022, were retrospectively analyzed. All patients underwent chest CT and DXA. All patient information and image data are visible only to the authors. Moreover, 533 patients underwent chest CT and DXA. The patient screening flow chart is shown in Fig. 1. In addition, 39 patients had thoracic spine fractures and underwent internal fracture fixation. The CT images of 21 patients contained only T11 and above images, and T12 was not scanned. One patient presented with tumor bone metastasis. DXA information was incomplete in two patients. Thus, 63 patients were excluded, and the remaining 470 patients were included in the analysis (Fig. 1).
All data collection and analysis conducted in this study were in accordance with the ethical standards of the institutional and/or national research committee and with the 1964 Helsinki Declaration and its later amendments or comparable ethical standards. For this type of study, formal consent is not required. The study protocol was approved by the Institutional Review Board of Affiliated Hospital of Integrated Traditional Chinese and Western Medicine, Nanjing University of Chinese Medicine (2022-LWKY-020). The Institutional Review Board waived the need for written informed consent from the patients because of the retrospective design of this study.

Dual-energy X-ray absorptiometry and computed tomography data acquisition

DXA

All patients underwent DXA of the lumbar spine (L1–L4) and hip. DXA measurements were performed using GE Medical Systems-LUNAR (GE Healthcare, Madison, WI, USA). Osteoporosis was diagnosed when the T-score on either lumbar or hip DXA was low, as lumbar and hip DXA results were considered. According to the criteria of the World Health Organization [17], osteoporosis was defined as a T-score of ≤–2.5, osteopenia as −2.5< T-score ≤–1.0, and normal BMD as a Tscore of >–1.0.

Chest CT

Chest CT examinations were mainly performed on the following two machines: GE 64-row 64-layer (Light-speed VCT; GE Healthcare) CT or Neusoft Medical Systems 64-row 128-layer (NeuViz 128 Precision CT; Neusoft Medical Systems, Lima, Peru) CT. The patient was placed head first, and chest CT was performed. The CT scanning parameters were as follows: tube voltage, 120 kV; automatic milliampere-second technique tube current; collimation, 64×0.625 mm; pitch, 0.9 to 1; rotation time, 0.5 seconds; and field of view, 500 mm. The CT scan data were transferred to the workstation and reconstructed with standard algorithms with reconstruction layer thicknesses of 1.25 (GE VCT) and 1 mm (NeuViz 128 CT), displaying a field of view of 380 mm. All chest CT aminations were performed without a venography. The scanner was calibrated daily to ensure accurate vertebral CT attenuation numbers.
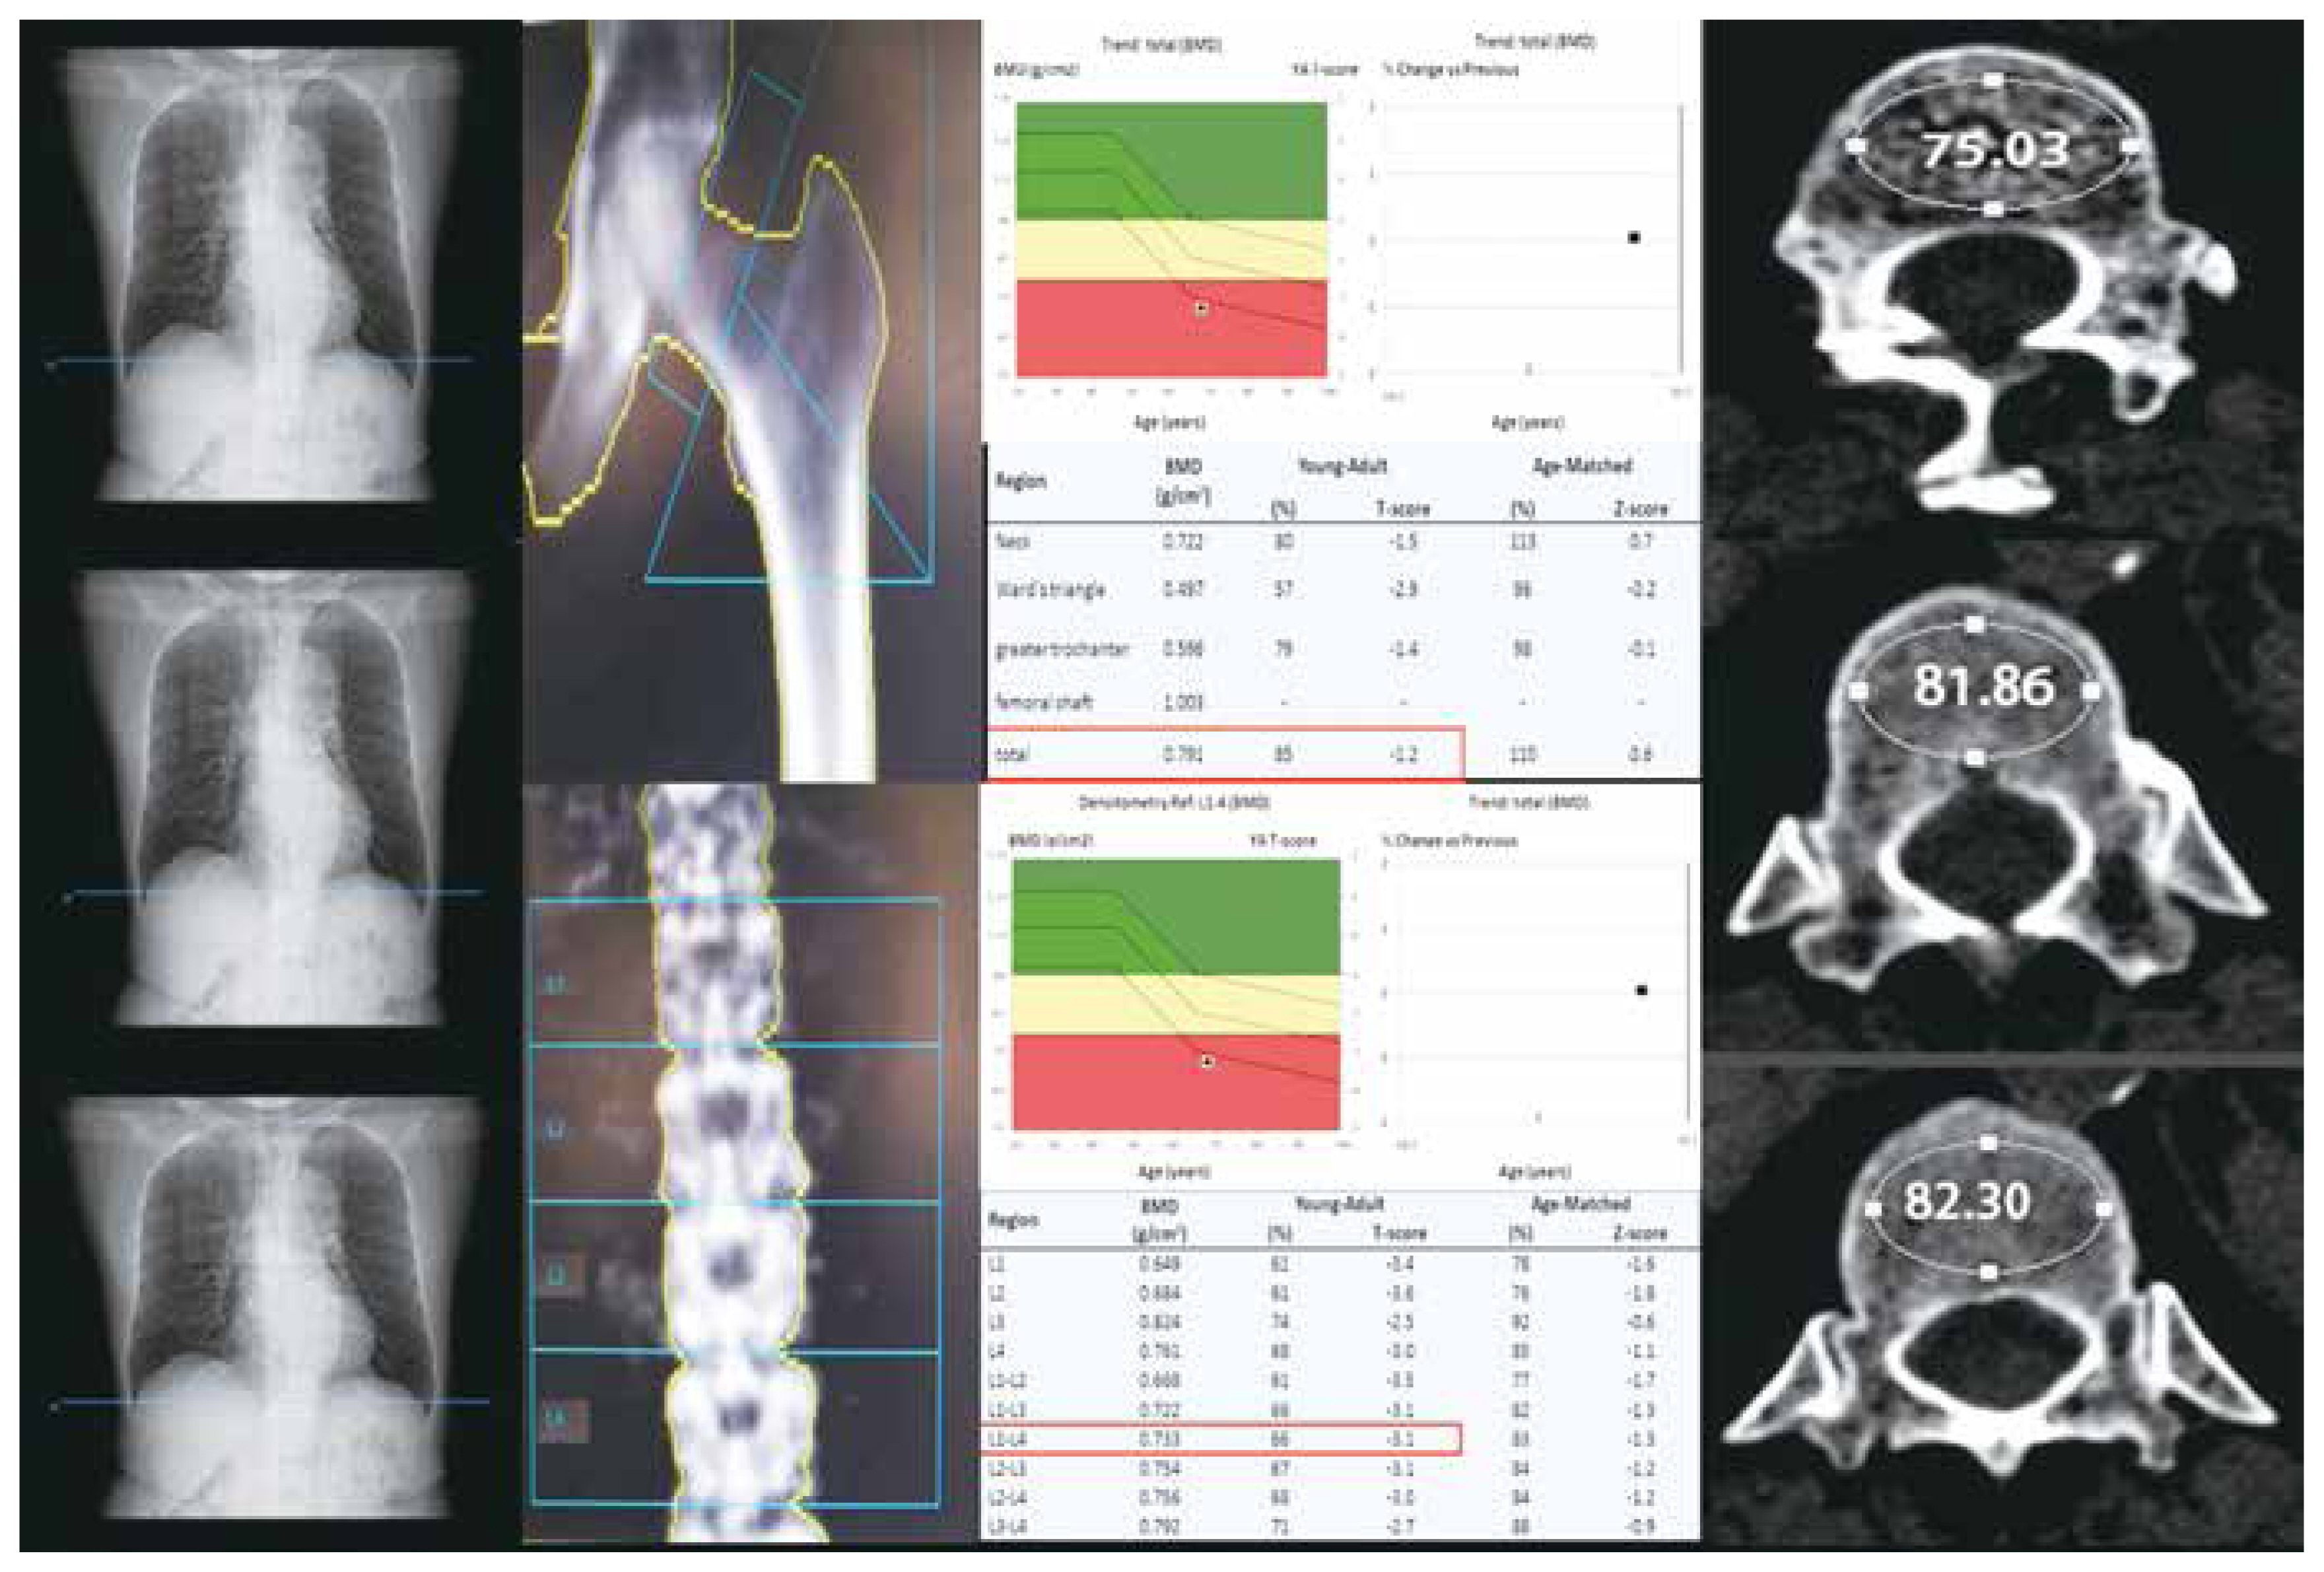
The HU values of the thoracic spine were measured using the authors’ picture archiving and communication system. First, the sagittal plane of the CT image was selected to determine the measurement position. A circular region of interest (ROI) was then drawn on the corresponding vertebral trabecular axial position to make it as large as possible. However, it excluded the cortical bone of the vertebral body, surrounding venous plexus, and trophoblastic foramen. Finally, the HU values of the three parts near the upper, middle, and lower endplates were measured and then averaged (Fig. 2). All measurements were conducted by a physician who was unaware of the DXA results. Another author randomly selected 20 patients for the comparisons of measurements.

Statistical analysis

Descriptive statistics, including means and 95% confidence intervals (CIs), were employed for continuous variables related to patient demographics. The HU values for the three BMD subgroups (normal, osteopenia, and osteoporosis) were expressed as medians. The Spearman correlation coefficient was employed to calculate the correlation between the HU value, BMD, and T-score [18]. To determine statistical differences, a rank-sum test was used to compare the HU values of T11 and T12 with the DXA-measured T-scores. Sensitivity, specificity, and area under the receiver operating characteristic (ROC) curve (AUC) were calculated for the three groups. The maximum value of the Youden index was used as the threshold for selecting the best HU in the ROC curve. All data were collected and stored in standard spreadsheets (Microsoft Excel; Microsoft Corp., Redmond, WA, USA). All statistical results were obtained using IBM SPSS Statistics for Windows ver. 25.0 (IBM Corp., Armonk, NY, USA).

Results

A total of 470 patients were enrolled in the study; 340 were women (72.4%) and 130 were men (27.6%). The average age was 65.5±12.3 years, the average height was 1.62±0.08 m, the average weight was 62.9±11.0 kg, the mean BMD of the lumbar spine was 1.02 g/cm2 (range, 0.56–1.92 g/cm2), the mean T-score was −0.89 (range, −4.6 to 6.2), the mean hip BMD was 0.89 g/cm2 (range, 0.52–1.81 g/cm2), and the mean T-score was −0.38 (range, −3.3 to 4.9). Male patients had significantly higher BMD and T-scores than female patients. The mean HU values of T12 and T11 were 121.8±53.5 and 129.5±57.4, respectively. The mean HU values were significantly higher in male patients than in female patients (Table 1).
Table 2 shows the correlation between the HU values of T11 and T12 and BMD and T-scores in the lumbar spine and hip. A significant positive correlation was observed between HU values and T-scores in the thoracic spine (r=0.576, p<0.01). The correlation between the HU values and total hip was significantly stronger than that of the lumbar spine for both T-scores and BMD.
All patients were classified into the following groups according to the T-scores provided by the DXA test: osteoporosis group (n=90, 19.1%), osteopenia group (n=180, 38.3%), and normal BMD group (n=200, 42.6%). Statistical analysis revealed statistically significant differences in the median T11 and T12 HU values in all three groups (p<0.01).
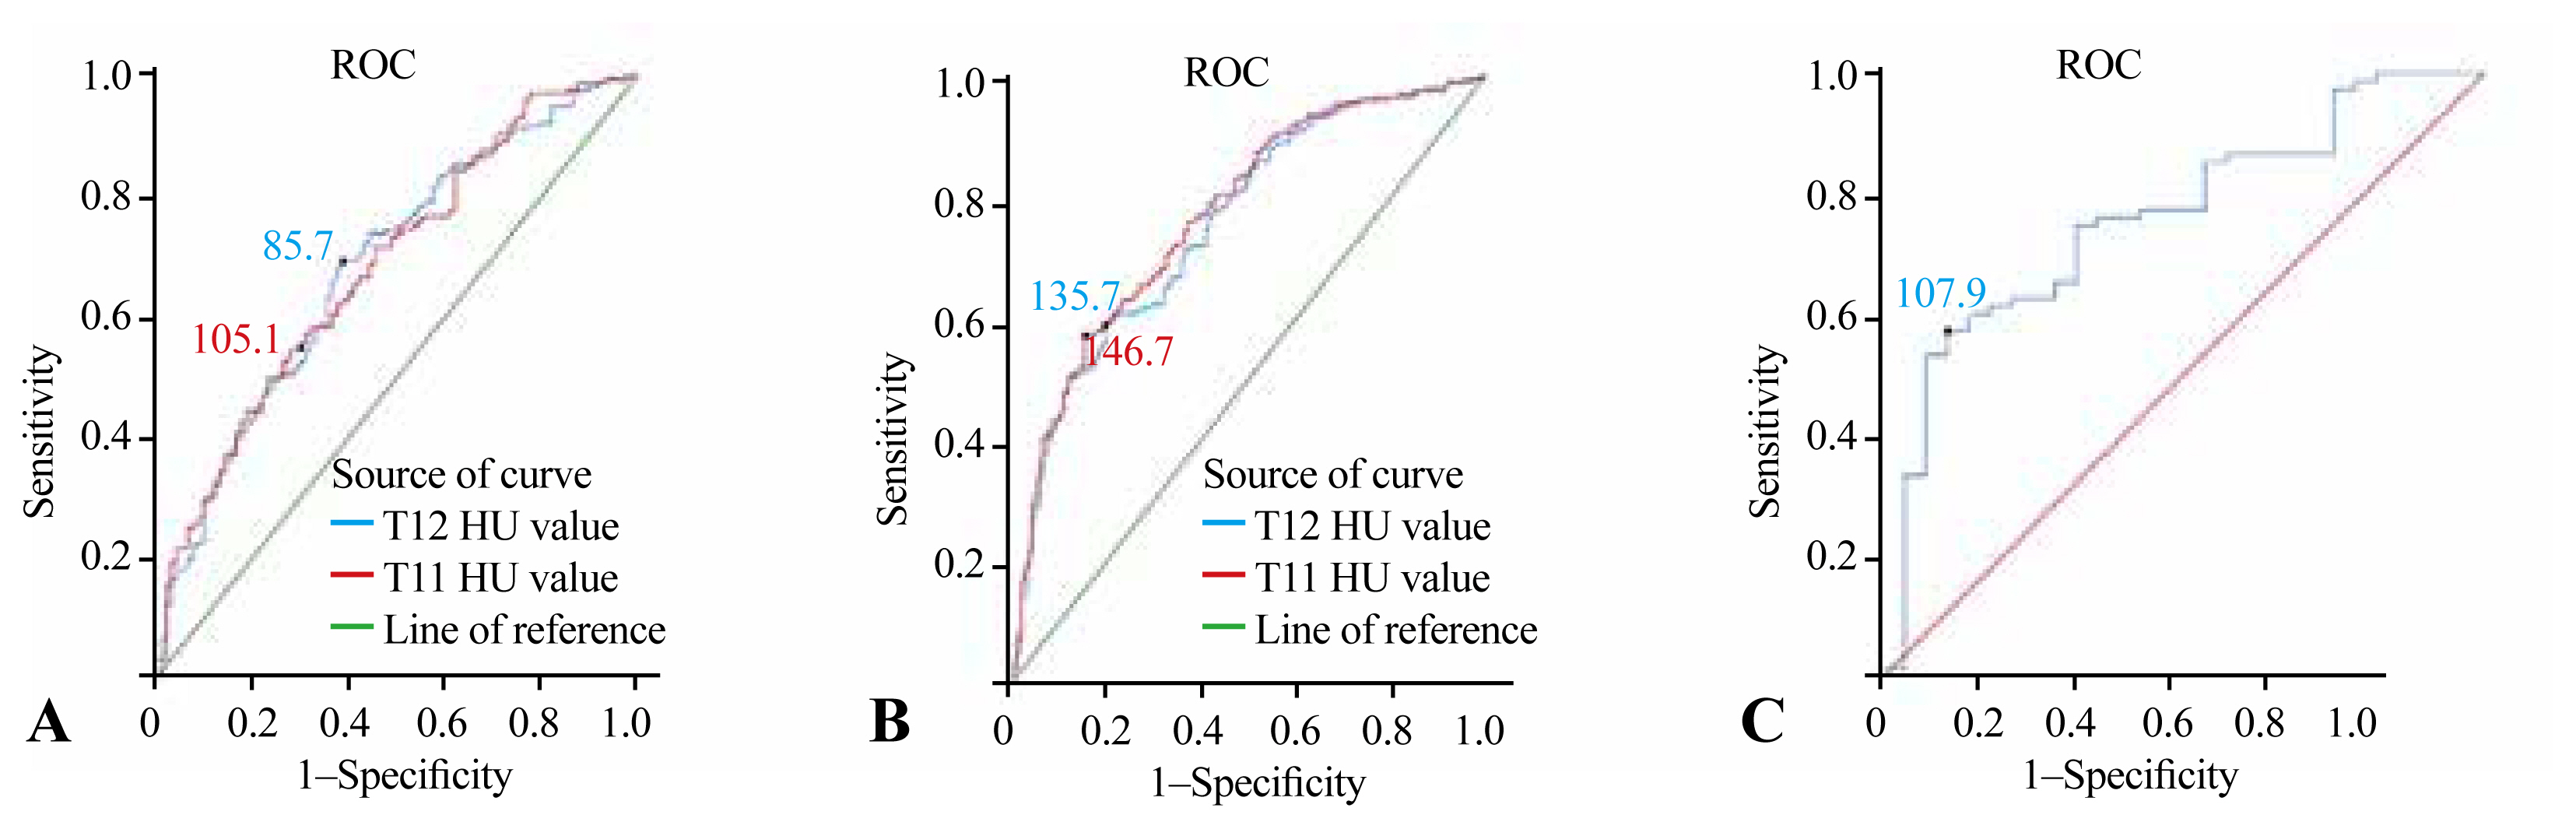
Fig. 3A shows that the HU values of T11 and T12, which represented the best ratio between sensitivity and specificity for distinguishing osteoporosis from osteopenia, were 105.1 and 85.7, respectively. When the HU value of T11 was ≤105.1, 65 of 169 patients were found to have osteoporosis. The AUC was 0.682 (95% CI, 0.615–0.748), with a sensitivity of 54.4% and specificity of 72.2%. When the HU value of T12 was ≤85.7, osteoporosis was found in 55 of the 120 patients. The AUC at this site was 0.683 (95% CI, 0.616–0.750), with a sensitivity of 69.4% and specificity of 61.1% (Tables 3, 4).
Fig. 3B shows that the HU values of T11 and T12, which represented the best ratio between sensitivity and specificity for distinguishing osteopenia from normal BMD, were 146.7 and 135.7, respectively. When the HU value of T11 was ≥146.7, 115 of 146 patients were found to have normal BMD. The AUC was 0.769 (95% CI, 0.722–0.816), with a sensitivity of 57.5% and specificity of 84.4%. When the HU value of T12 was ≥135.7, 119 of 162 patients were found to have normal BMD. The AUC at this site was 0.756 (95% CI, 0.708–0.804), with a sensitivity of 59.5% and specificity of 80% (Tables 3, 4).
In the calculation of the thoracic spine HU value by chest CT, some chest CT images were found to contain L1. Therefore, the HU values of L1 were also measured. Because there were only 103 patients, they were divided into two groups: osteoporosis and non-osteoporosis groups. Fig. 3C shows the HU value of L1 at 107.9, which represents the best ratio between sensitivity and specificity to distinguish the osteoporosis group from the non-osteoporosis group. The AUC at this site was 0.761 (95% CI, 0.708–0.804), with a sensitivity of 57.3% and specificity of 89.3%.
Seven studies have reported HU thresholds for osteoporosis testing, such as T12 or L1, from different ethnic and geographic populations. The sensitivity and specificity of the study population and the current use of HU thresholds are presented in Table 5 [1925].

Discussion

This study investigated the opportunistic assessment of the patient’s entire bone mass using vertebral HU values provided by chest CT, calculated the HU value threshold, and determined whether the patient required further examination related to osteoporosis to improve the early detection rate of clinical factors and reduce the risk of fractures.
Chest CT is a commonly used method in daily examinations. Thoracic spine HU values can be measured by chest CT. T11 and T12 are at the turning point of the thoracolumbar spine. These are more similar to the BMD of the lumbar spine. To measure the HU values of L1, previous investigators mostly used abdominal CT [23,26]. In L1 fractures, T12 is used instead of L1. In contrast, most abdominal CT images did not include the level of the thoracic spine. Therefore, the prediction of osteoporosis by thoracic spine HU values is significant. Few studies have evaluated T12, and no study has yet proposed an optimal HU threshold of T11 to predict osteoporosis. Therefore, 470 patients who underwent chest CT were included in this study, and the HU values of T11 and T12 were measured separately for the study.
The researchers represented the entire vertebral body by measuring the HU values of a single oval ROI vertebra. The vertebral body has a three-dimensional structure; therefore, a single ROI may lead to questionable accuracy and reproducibility of measurements [20]. Therefore, in this study, three locations of the same vertebral body were measured, i.e., near the upper middle plate, middle plate, and lower endplates, and the HU value of the whole vertebral body was represented by the mean of three measurements. Cohen et al. [21] found no statistically significant difference in HU values measured in axial and sagittal vertebral bodies. Therefore, in the present study, the axial position closer to the ellipse was chosen for the HU value measurement.
The DXA T-score is now a common way to diagnose osteoporosis. Compared with BMD, the T-score is more accurate for the diagnosis of osteoporosis [25]. Other indicators have been developed to assess osteoporosis, such as the trabecular bone score (TBS). The TBS, which is primarily applied to the lumbar spine, is a texture index used to assess pixel-by-pixel grayscale changes in DXA images of the lumbar spine. Compared with DXA, the TBS reflects the three-dimensional characteristics of the bone to a certain extent and can provide information on bone microstructure and strength and additional information on fractures [27,28]. Using multivariate regression techniques, some researchers have revealed that the TBS is less affected by degenerative changes in the spine than the BMD. The comparison of the TBS with vertebral HU values revealed that both performed similarly in assessing patients’ osteoporosis risk, suggesting that the TBS was able to ignore the effect of spinal degenerative changes on the vertebral BMD [29]. However, differences in the DXA scan acquisition modes, differences between bone densitometer builders, and scanner resolution influence the TBS [30]. Previous studies have shown a correlation between lumbar HU values and DXA T-scores [8]. The present study confirmed that thoracic spine HU values also positively correlated with the T-score. Therefore, the criterion for evaluating the osteoporosis status of patients in this study was based on the minimum T-score at the lumbar spine or hip.
Using ROC curves, the optimal HU thresholds of the T11 and T12 to distinguish osteoporosis from osteopenia were 105.1 and 85.7, respectively. The sensitivity of the HU threshold of T12 was higher than that of T11 in detecting osteoporosis (69.4% versus 54.4%). The correlation between T12 and DXA findings was higher than that of T11. Therefore, the diagnostic value of T12 is higher than that of T11. Other study reported that the HU threshold of T12 to distinguish osteoporosis from non-osteoporosis was 104, which was quite different from the HU value of T12 in this study [19]. This may be due to the specific distinction between osteoporosis and osteopenia in this study and the reduction of the range of cases, resulting in smaller HU values. In addition, BMD values vary among ethnic groups. A study showed the highest mean lumbar spine BMD among African–Caribbeans and African–Americans and the lowest among Hong Kong Chinese [31].
The optimal HU values of the T11 and T12 to distinguish osteopenia from normal BMD were 146.7 and 135.7, respectively. This is similar to the findings of Kim et al. [18] and Kim et al. [24]. Osteoporosis was found in only three of 146 patients (2%) if the HU value was ≥146.7. When using an HU value of ≥135.7, osteoporosis was found in only seven of 162 patients (4%). Therefore, when the vertebral body is greater than these two thresholds, the patient does not need to undergo additional DXA unless the patient has a fracture. In contrast, only nine of 119 patients (8%) with an HU value of <85.7 had normal BMD. Consequently, such patients are highly suspected of having abnormal bone density, and DXA is recommended. A comparison with other populations revealed that the thresholds determined to distinguish osteoporosis from osteopenia were lower than those in other regions. The HU values of the thoracolumbar spine in other areas were between 99 and 146. The HU threshold of T12 reported by Buckens et al. [19] is similar to the HU threshold of T11 in the present study. When the thresholds for distinguishing osteopenia from normal BMD were compared with those of other researchers, they were similar in Chinese, Korean, and American studies but higher than those reported by Israeli and Dutch researchers. Therefore, the threshold values obtained in the present study are consistent with those of the Asian population.
Osteoporotic vertebral compression fractures are common and account for approximately 40% of all osteoporotic fractures [32]. The risk of fracture of the thoracolumbar junctional vertebrae is significantly higher than that of the other vertebrae. The most susceptible vertebrae are T11, T12, and L1, with T12 having the highest incidence of vertebral fractures [16,33,34]. In this study, the HU values of L1 were assessed by chest CT in 103 patients, and the optimal HU value for tabulating the distinction between osteoporosis and non-osteoporosis was 107.9, which was similar to the results of a previous study [6]. Comparing the HU thresholds of the three vertebrae, the HU thresholds of T11 and L1 to distinguish osteoporosis were similar, and the differences when compared with the threshold of T12 were 18.4 and 22.2, respectively. Therefore, a faster decline in the HU value of T12 among the three vertebral bodies may explain the high incidence of T12 fractures.
This study has some limitations. Significantly more women than men were analyzed. This can be attributed to the significantly higher average life expectancy of women than of men and the significantly higher prevalence of osteoporosis in postmenopausal women than in men. We attempted to mitigate the effects of sex imbalance through random grouping. In the future, sex control can be strengthened to explore the differences in HU values between sexes. All clinical factors (smoking, diabetes, race, and anti-osteoporosis treatment) were not considered in this study; thus, further research is required. This study may have been subjected to selection bias because medical conditions were not considered. Therefore, a relatively large number of consecutive patients (n=470) was included. All HU values are subject to measurement errors because of factors such as differences in CT equipment and semiautomatic measurements. To address equipment differences, screening is conducted only after validation of the machine’s effect. The TBS was not included in the indicators of patient records because it is mainly used in the lumbar spine. The correlation between the TBS and thoracic spine HU values can be further explored in the future to expand the use of the TBS.

Conclusions

The HU value obtained from chest CT showed a correlation with the relevant evaluation value obtained by DXA. This indicates that the HU values measured by chest CT have potential for use in BMD assessment. When the HU value of T11 is >146.7 or that of T12 is >135.7, additional osteoporosis testing is not required unless a vertebral fracture is detected. If the HU value T11 is <105.1 or that of T12 <85.7, further DXA testing is necessary. We recommend the inclusion of the thoracic spine HU values in the report at the time of chest CT examination. It helps increase the detection rate of osteoporosis and helps patients who may benefit from further DXA testing. Moreover, the higher incidence of T12 fractures may be explained by the more rapid decline in vertebral HU values compared to the upper and lower vertebral bodies.

Notes

Conflict of Interest

No potential conflict of interest relevant to this article was reported.

Funding

This study was supported by Project of National Clinical Research Base of Traditional Chinese Medicine in Jiangsu Province, China (JD2022SZXMS07), Scientific Research Project of Jiangsu Provincial Health Commission (M2022095), and the Seventh Batch of National Chinese Medicine Experts’ Academic Experience Inheritance Work Project (22QGSC6).

Author Contributions

Conception and study design: CX, ZX. Data acquisition and analysis of data: GS, NW, XL, GH. Drafting of the manuscript: CX. Obtaining funding: YW, ZX. Critical revision: YW, ZX. Final approval of the manuscript: all authors.

Fig. 1
Patient inclusion/exclusion flow chart. A total of 533 patients who underwent chest computed tomography (CT) and bone density examination in our hospital were included. Of these, 470 patients with incomplete imaging, bone density information, and those who had fractures, fractures after internal fixation, or tumor bone metastases were excluded. The patients were divided into three groups according to their T-scores: osteoporosis group, bone loss group, and osteopenia group. DXA, dual-energy X-ray absorptiometry; BMD, bone mineral density.
asj-2023-0438f1.jpg
Fig. 2
Hounsfield unit (HU) measurements at three different locations in the same vertebral body of the patient; bone mineral density (BMD) and T-scores of the patient’s lumbar spine and hip. Both sides of the Figure show the process of measuring the HU value of the patient’s T12 vertebral body 3 times. Using our own picture archiving and communication system (PACS) system, we first selected the sagittal position of the computed tomography (CT) image to determine the measurement location. Then, we drew a circular area (region of interest) on the corresponding vertebral trabecular axis to make it as large as possible, but excluding the vertebral cortical bone, surrounding venous plexus, and trophoblastic foramen. Finally, the HU values were measured at the proximal superior endplate, middle, and proximal inferior endplate, which were 75.03, 81.86, and 82.30, respectively, with a mean value of 79.73. The middle of the Figure shows the dual-energy X-ray absorptiometry (DXA) test results of the patient’s total hip and lumbar spine. The results were obtained from our bone densitometer. The patient’s hip T-score was −1.2; the lumbar spine T-score was −3.2; −3.2 was used as the patient’s final T-score. The CT images and bone density images were exported from our hospital PACS system and later synthesized by Photoshop.
asj-2023-0438f2.jpg
Fig. 3
Receiver operating characteristic (ROC) curve of Hounsfield unit (HU) values at T11, T12, and L1. (A) shows the area under ROC curve (AUC) were 0.682 (95% confidence interval [CI], 0.615–0.748) and 0.683 (95% CI, 0.616–0.750), respectively. The HU values for T11 and T12 to distinguish osteoporosis from osteopenia were 105.1 and 85.7, respectively. (B) represents ROC curve of HU values at T11 and T12 showed that the AUC was 0.769 (95% CI, 0.722–0.816) and 0.756 (95% CI, 0.708–0.804), respectively. The HU values of T11 and T12 to distinguish osteopenia from normal bone mineral density (BMD) were 146.7 and 135.7, respectively. (C) shows the AUC of the ROC line was 0.761 (95% CI, 0.660–0.862). Its HU value of L1 to distinguish osteoporosis from non-osteoporosis was 107.9. Using IBM SPSS ver. 25.0 software (IBM Corp., Armonk, NY, USA). (A) represents the HU values of the thoracic lumbar segment of the thoracic spine in the osteoporosis and osteopenia groups were imported, and the ROC curve analysis was run to calculate the HU values corresponding to the specificity and sensitivity in the data of both groups, and to calculate the Yordon index. The HU values corresponding to the maximum Jorden index were taken as the optimal thresholds for differentiating osteoporosis from osteopenia at 105.1 and 85.7, respectively, corresponding to area under the curve of 0.682 and 0.683. Using the IBM SPSS ver. 25.0 software, (B) represents the HU values of the thoracic lumbar segment of the thoracic spine in the bone-reduced and normal BMD groups were imported, and the ROC curves were run to calculate the HU values corresponding to the specificity and sensitivity in the data of the two groups, and to calculate the Yordon index. The HU value corresponding to the maximum Jorden index was taken as the best threshold to distinguish between osteopenia and normal BMD, which was 105.1 and 85.7, respectively, corresponding to area under the curve of 0.682 and 0.683. The L1 HU values of 103 patients were counted. Because of the small number of patients, they were divided into only two groups: osteoporotic and non-osteoporotic groups. Using IBM SPSS ver. 25.0 software, (C) represents that ROC curve analysis was performed to calculate the HU values corresponding to the specificity and sensitivity of the data in the two groups, and to calculate the Youden index. The AUC was 0.761 (95% CI, 0.708–0.804), with a sensitivity of 57.3% and specificity of 89.3%.
asj-2023-0438f3.jpg
Table 1
Baseline characteristics of the study population
Characteristic Total (n=470) Male (n=130) Female (n=340)
Average age (yr) 65.4±12.3 64.8±13.0 65.7±12.0
Average height (m) 1.62±0.08 1.70±0.06 1.59±0.05
Average weight (kg) 62.9±11.0 70.6±11.2 59.9±9.4
Average BMI (kg/m2) 24.0±3.4 24.3±3.3 23.8±3.5
Mean interval between CT and DXA (day) 16.9±34.5 11.8±31.1 18.8±35.5
Mean T-score from L1–L4 −0.89±1.73 −0.32±1.81 −1.12±1.65
Mean L1–L4 BMD values (g/cm2) 1.02±0.22 1.14±0.22 0.98±0.2
Mean hip T-score −0.38±1.29 0.28±1.3 −0.63±1.2
Mean hip BMD values (g/cm2) 0.89±0.17 0.98±0.17 0.86±0.15
T12 HU value 121.8±53.5 129.2±52.3 119±53.8
T11 HU value 129.5±57.4 137.2±53.9 126.6±58.5

Values are presented as mean±standard deviation. The basic information such as height, weight, age, gender, BMI, as well as the interval between CT and DXA examinations, lumbar spine and hip T-score and bone mineral density values, and thoracic spine thoracolumbar segment HU values of the included patients were recorded. The IBM SPSS ver. 25.0 software was used to calculate the mean values of all patients’ recorded information and the mean values of different genders.

BMI, body mass index; CT, computed tomography; DXA, dual-energy X-ray absorptiometry; BMD, bone mineral density; HU, Hounsfield unit.

Table 2
The pearson correlation coefficients of BMD, T-score, and HU value
Hip-BMD (g/cm2) L-BMD (g/cm2) Mean T-score from L1–L4 Hip T-score
T12 HU value 0.572** 0.497** 0.503** 0.576**
T11 HU value 0.564** 0.493** 0.496** 0.568**

The correlation between the mean lumbar and hip BMD and T values and the mean thoracic thoracolumbar segment HU values were calculated in 470 patients by using Spearman’s correlation coefficient with IBM SSPS ver. 25.0 software. The results showed statistically significant differences between the BMD and T-score of the lumbar spine and hip and the HU values of the thoracic spine and thoracolumbar segment. All r-values were positive, suggesting a positive correlation between BMD and T values and HU values. Among them, a significant positive correlation was shown between HU values and T values in the thoracic spine (r=0.576, p<0.01), and the correlation between HU and total hip was significantly stronger than that in the lumbar spine for both T-score and BMD.

BMD, bone mineral density; HU, Hounsfield unit.

** p<0.01; At the 0.01 level (two-tailed), the correlation is significant.

Table 3
Statistical table of the number of patients grouped by the optimal threshold of HU
Classification HU value DXA-based T-score grouping Total (n=470)
Osteoporosis (n=90) Osteopenia (n=180) Normal BMD (n=200)
T11 ≤105.1 65 82 22 169
105.1–146.7 22 70 63 155
≥146.7 3 28 115 146
T12 ≤85.7 55 55 9 119
85.7–135.7 28 89 72 189
≥135.7 7 36 119 162

The thresholds for differentiating osteoporosis, osteopenia, and normal BMD in the thoracic lumbar segment of the thoracic spine were calculated based on the receiver operating characteristic curve. Using an Microsoft Excel spreadsheet (Microsoft Corp., Redmond, WA, USA), all patients were ranked from lowest to highest HU value size, and the number of each group classified by the optimal HU threshold was counted. When the T11 HU value was ≤105.1, 65 of 169 patients were found to have osteoporosis. When the T12 HU value was ≤85.7, osteoporosis was found in 55 out of 120 patients. When the T11 HU value was ≥146.7, 115 of 146 patients had normal BMD. when the T12 HU value was ≥135.7, 119 of 162 patients had normal BMD.

HU, Hounsfield unit; DXA, dual-energy X-ray absorptiometry; BMD, bone mineral density.

Table 4
Calculated values of the AUC and diagnostic performance of T11 and T12 mean bone attenuation
AUC (95% CI) Optimal threshold (HU) Sensitivity, % (n/N) Specificity, % (n/N) Positive predictive value, % (n/N) Negative predictive value, % (n/N)
T11
 Osteoporosis 0.682 (0.615–0.748) 105.1 54.4 72.2 44.2 79.7
 Normal BMD 0.769 (0.722–0.816) 146.7 57.5 84.4 80.4 84.4
T12
 Osteoporosis 0.683 (0.616–0.750) 85.7 69.4 61.1 50.0 78.1
 Normal BMD 0.756 (0.708–0.804) 135.7 59.5 80.0 76.8 64.0

The thresholds for differentiating osteoporosis, osteopenia, and normal BMD in the thoracolumbar segment of the thoracic spine were calculated according to the ROC curve, and the sensitivity and specificity of the thresholds were recorded. Positive and negative predictive values were calculated by counting the number of each group according to the calculation formula combined with Table 4. Positive predictive value=number of true positive cases/(number of true positive cases+number of false positive cases); negative predictive value; negative predictive value=number of true negative cases/(number of true negative cases+number of false negative cases). T11 HU values had the highest specificity and negative predictive value for predicting normal BMD. Optimal thresholds were used to detect osteoporosis and normal BMD.

ROC, receiver operating characteristic; AUC, area under the ROC curve; CI, confidence interval; HU, Hounsfield unit; BMD, bone mineral density.

Table 5
Comparison table of the results of studies using HU value to distinguish osteoporosis in different populations
Study time Study population No. of included patients Prevalence of osteoporosis (%) Vertebrae The best HU threshold for distinguishing osteoporosis AUC Sensitivity (%) Specificity (%) Positive predictive value (%) Negative predictive value (%)
Buckens et al. [19] (2015) Netherlands 302 27.0 T12 104 0.74 62.0 79.0 - -
Netherlands 302 27.0 L1 99 0.74 62.0 79.0 - -
Kim et al. [20] (2016) Korea 232 25.6 T4, T7, T10, L1 (T12) 136.2 (male) 0.886 95.0 77.6 59.4 97.8
Korea 232 32.5 T4, T7, T10, L1 (T12) 137.9 (female) 0.867 96.0 64.4 56.5 97.1
Cohen et al. [21] (2021) Israel 246 27.0 L1–L4 121 0.764 74.0 61.0 41.0 87.0
Zou et al. [22] (2018) China 334 61.4 L1 110 0.86 60.8 88.5 - -
Jain et al. [23] (2020) USA 313 10.9 L1 135 - 71.0 60.0 - -
Kim et al. [24] (2019) Korea 180 - L1–L3 146 0.96 94.3 87.5 97.6 74.5
Li et al. [25] (2018) China 109 56.9 L1–L5 136 0.86 90.3 72.3 81.2 85.0

Seven published studies reporting HU thresholds for osteoporosis testing such as T12 or L1 from different ethnic and geographic populations were summarized. Sensitivity and specificity of study populations and current use of HU thresholds were counted in an Microsoft Excel spreadsheet (Microsoft Corp., Redmond, WA, USA) and compared across all studies in terms of population, number of patients, vertebral HU values, sensitivity, and characteristics. If the thresholds determined to distinguish osteoporosis from osteopenia were lower than in other regions. The thoracolumbar HU values in other regions ranged from 99 to 146. If the thresholds determined by differentiating between osteopenia and normal BMD were compared with other researchers, it was found that the thresholds obtained in the Chinese, Korean, and American studies were similar and higher than those in the Israeli and Dutch studies. It can be seen that the threshold values obtained in this study are consistent with Asian populations.

HU, Hounsfield unit; BMD, bone mineral density.

References

1. Xia W, Liu Q, Lv J, et al. Prevalent vertebral fractures among urban-dwelling Chinese postmenopausal women: a population-based, randomized-sampling, cross-sectional study. Arch Osteoporos 2022;17:120.
crossref pmid pmc pdf
2. Chen P, Li Z, Hu Y. Prevalence of osteoporosis in China: a meta-analysis and systematic review. BMC Public Health 2016;16:1039.
crossref pmid pmc pdf
3. Lenchik L, Weaver AA, Ward RJ, Boone JM, Boutin RD. Opportunistic screening for osteoporosis using computed tomography: state of the art and argument for paradigm shift. Curr Rheumatol Rep 2018;20:74.
crossref pmid pmc pdf
4. Zou D, Muheremu A, Sun Z, Zhong W, Jiang S, Li W. Computed tomography Hounsfield unit-based prediction of pedicle screw loosening after surgery for degenerative lumbar spine disease. J Neurosurg Spine 2020;32:716–21.
crossref pmid
5. Zaidi Q, Danisa OA, Cheng W. Measurement techniques and utility of Hounsfield unit values for assessment of bone quality prior to spinal instrumentation: a review of current literature. Spine (Phila Pa 1976) 2019;44:E239–44.
pmid
6. Pinto EM, Neves JR, Teixeira A, et al. Efficacy of Hounsfield units measured by lumbar computer tomography on bone density assessment: a systematic review. Spine (Phila Pa 1976) 2022;47:702–10.
crossref pmid
7. Kim KH, Kim TH, Kim SW, et al. Significance of measuring lumbar spine 3-dimensional computed tomography Hounsfield units to predict screw loosening. World Neurosurg 2022;165:e555–62.
crossref pmid
8. Choi MK, Kim SM, Lim JK. Diagnostic efficacy of Hounsfield units in spine CT for the assessment of real bone mineral density of degenerative spine: correlation study between T-scores determined by DEXA scan and Hounsfield units from CT. Acta Neurochir (Wien) 2016;158:1421–7.
crossref pmid pdf
9. Han K, You ST, Lee HJ, Kim IS, Hong JT, Sung JH. Hounsfield unit measurement method and related factors that most appropriately reflect bone mineral density on cervical spine computed tomography. Skeletal Radiol 2022;51:1987–93.
crossref pmid pdf
10. Liang X, Liu Q, Xu J, Ding W, Wang H. Hounsfield Unit for assessing bone mineral density distribution within cervical vertebrae and its correlation with the intervertebral disc degeneration. Front Endocrinol (Lausanne) 2022;13:920167.
crossref pmid pmc
11. Wang P, She W, Mao Z, et al. Use of routine computed tomography scans for detecting osteoporosis in thoracolumbar vertebral bodies. Skeletal Radiol 2021;50:371–9.
crossref pmid pdf
12. Kilinc RM, Acan AE, Turk G, Kilinc CY, Yeniceri IO. Evaluation of femoral head bone quality by Hounsfield units: a comparison with dual-energy X-ray absorptiometry. Acta Radiol 2022;63:933–41.
crossref pmid pdf
13. Inagaki N, Tanaka T, Udaka J, Akiyama S, Matsuoka T, Saito M. Distribution of hounsfield unit values in the pelvic bones: a comparison between young men and women with traumatic fractures and older men and women with fragility fractures: a retrospective cohort study. BMC Musculoskelet Disord 2022;23:305.
crossref pmid pmc pdf
14. Wagner SC, Dworak TC, Grimm PD, Balazs GC, Tintle SM. Measurement of distal ulnar Hounsfield units accurately predicts bone mineral density of the forearm. J Bone Joint Surg Am 2017;99:e38.
crossref pmid
15. Xiongfeng T, Cheng Z, Meng H, et al. One novel phantomless quantitative computed tomography system for auto-diagnosis of osteoporosis utilizes low-dose chest computed tomography obtained for COVID-19 screening. Front Bioeng Biotechnol 2022;10:856753.
crossref pmid pmc
16. Gao C, Xu Y, Li L, et al. Prevalence of osteoporotic vertebral fracture among community-dwelling elderly in Shanghai. Chin Med J (Engl) 2019;132:1749–51.
crossref pmid pmc
17. Prevention and management of osteoporosis. World Health Organ Tech Rep Ser 2003;921:1–164.
pmid
18. Kim YS, Lee S, Sung YK, Lee BG. Assessment of osteoporosis using pelvic diagnostic computed tomography. J Bone Miner Metab 2016;34:457–63.
crossref pmid pdf
19. Buckens CF, Dijkhuis G, de Keizer B, Verhaar HJ, de Jong PA. Opportunistic screening for osteoporosis on routine computed tomography?: an external validation study. Eur Radiol 2015;25:2074–9.
crossref pmid pdf
20. Kim YW, Kim JH, Yoon SH, et al. Vertebral bone attenuation on low-dose chest CT: quantitative volumetric analysis for bone fragility assessment. Osteoporos Int 2017;28:329–38.
crossref pmid pdf
21. Cohen A, Foldes AJ, Hiller N, Simanovsky N, Szalat A. Opportunistic screening for osteoporosis and osteopenia by routine computed tomography scan: a heterogeneous, multiethnic, middle-eastern population validation study. Eur J Radiol 2021;136:109568.
crossref pmid
22. Zou D, Li W, Deng C, Du G, Xu N. The use of CT Hounsfield unit values to identify the undiagnosed spinal osteoporosis in patients with lumbar degenerative diseases. Eur Spine J 2019;28:1758–66.
crossref pmid pdf
23. Jain RK, Lee E, Mathai C, et al. Using opportunistic screening with abdominal CT to identify osteoporosis and osteopenia in patients with diabetes. Osteoporos Int 2020;31:2189–96.
crossref pmid pdf
24. Kim KJ, Kim DH, Lee JI, Choi BK, Han IH, Nam KH. Hounsfield Units on lumbar computed tomography for predicting regional bone mineral density. Open Med (Wars) 2019;14:545–51.
crossref pmid pmc
25. Li YL, Wong KH, Law MW, et al. Opportunistic screening for osteoporosis in abdominal computed tomography for Chinese population. Arch Osteoporos 2018;13:76.
crossref pmid pdf
26. Abbouchie H, Raju N, Lamanna A, Chiang C, Kutaiba N. Screening for osteoporosis using L1 vertebral density on abdominal CT in an Australian population. Clin Radiol 2022;77:e540–8.
crossref pmid
27. Leslie WD, Johansson H, Kanis JA, et al. Lumbar spine texture enhances 10-year fracture probability assessment. Osteoporos Int 2014;25:2271–7.
crossref pmid pdf
28. Hans D, Goertzen AL, Krieg MA, Leslie WD. Bone micro-architecture assessed by TBS predicts osteoporotic fractures independent of bone density: the Manitoba study. J Bone Miner Res 2011;26:2762–9.
crossref pmid pdf
29. Hayden AC, Binkley N, Krueger D, Bernatz JT, Kadri A, Anderson PA. Effect of degeneration on bone mineral density, trabecular bone score and CT Hounsfield unit measurements in a spine surgery patient population. Osteoporos Int 2022;33:1775–82.
crossref pmid pdf
30. Rajan R, Cherian KE, Kapoor N, Paul TV. Trabecular bone score: an emerging tool in the management of osteoporosis. Indian J Endocrinol Metab 2020;24:237–43.
crossref pmid pmc
31. Nam HS, Shin MH, Zmuda JM, et al. Race/ethnic differences in bone mineral densities in older men. Osteoporos Int 2010;21:2115–23.
crossref pmid pmc
32. Oktenoglu T, Hekimoglu M, Aydin AL, Sasani M, Cerezci O, Ozer AF. Kyphoplasty with posterior dynamic stabilization in the surgical treatment of unstable thoracolumbar osteoporotic vertebral compression fractures. Turk Neurosurg 2021;31:924–30.
crossref pmid
33. Li Y, Yan L, Cai S, Wang P, Zhuang H, Yu H. The prevalence and under-diagnosis of vertebral fractures on chest radiograph. BMC Musculoskelet Disord 2018;19:235.
crossref pmid pmc pdf
34. Herrera A, Mateo J, Gil-Albarova J, et al. Prevalence of osteoporotic vertebral fracture in Spanish women over age 45. Maturitas 2015;80:288–95.
crossref pmid
TOOLS
Share :
Facebook Twitter Linked In Google+ Line it
METRICS Graph View
  • 0 Crossref
  •   Scopus
  • 232 View
  • 18 Download
Related articles in ASJ


ABOUT
ARTICLE CATEGORY

Browse all articles >

BROWSE ARTICLES
EDITORIAL POLICY
FOR CONTRIBUTORS
Editorial Office
Department of Orthopedic Surgery, Asan Medical Center, University of Ulsan College of Medicine
88, Olympic-ro 43-gil, Songpa-gu, Seoul 05505, Korea
Tel: +82-2-3010-3530    Fax: +82-2-3010-8555    E-mail: asianspinejournal@gmail.com                
Korean Society of Spine Surgery
27, Dongguk-ro, Ilsandong-gu, Goyang-si 10326, Korea
Tel: +82-31-966-3413    Fax: +82-2-831-3414    E-mail: office@spine.or.kr                

Copyright © 2024 by Korean Society of Spine Surgery.

Developed in M2PI

Close layer
prev next