Development and internal validation of machine-learning models for predicting survival in patients who underwent surgery for spinal metastases
Article information

Abstract
Study Design
A retrospective study.
Purpose
This study aimed to develop machine-learning algorithms for predicting survival in patients who underwent surgery for spinal metastasis.
Overview of Literature
This study develops machine-learning models to predict postoperative survival in spinal metastasis patients, filling the gaps of traditional prognostic systems. Utilizing data from 389 patients, the study highlights XGBoost and CatBoost algorithms̓ effectiveness for 90, 180, and 365-day survival predictions, with preoperative serum albumin as a key predictor. These models offer a promising approach for enhancing clinical decision-making and personalized patient care.
Methods
A registry of patients who underwent surgery (instrumentation, decompression, or fusion) for spinal metastases between 2004 and 2018 was used. The outcome measure was survival at postoperative days 90, 180, and 365. Preoperative variables were used to develop machine-learning algorithms to predict survival chance in each period. The performance of the algorithms was measured using the area under the receiver operating characteristic curve (AUC).
Results
A total of 389 patients were identified, with 90-, 180-, and 365-day mortality rates of 18%, 41%, and 45% postoperatively, respectively. The XGBoost algorithm showed the best performance for predicting 180-day and 365-day survival (AUCs of 0.744 and 0.693, respectively). The CatBoost algorithm demonstrated the best performance for predicting 90-day survival (AUC of 0.758). Serum albumin had the highest positive correlation with survival after surgery.
Conclusions
These machine-learning algorithms showed promising results in predicting survival in patients who underwent spinal palliative surgery for spinal metastasis, which may assist surgeons in choosing appropriate treatment and increasing awareness of mortality-related factors before surgery.
Introduction
Cancer is among the leading causes of death worldwide. According to estimates from the World Health Organization in 2019, cancer is the second leading cause of death before the age of 70 years in 112 of 183 countries [1]. The spine is one of the most common sites of bone metastases, with a prevalence of up to 50% [2], and spinal metastases were observed in 5%–10% of patients with cancer [3].
Improvements in cancer treatment have increased the survival of patients with metastatic disease and the rate of metastatic epidural spinal cord compression (MESCC). Surgical intervention is often undertaken to reduce pain, stabilize the spine, or address neurologic deficits and has shown better results than conservative treatment [4,5]. Specifically, the combination of surgical intervention and radiotherapy is superior to radiotherapy alone, particularly in patients with MESCC [6,7].
The estimation of life expectancy using the neurologic, oncologic, mechanical, and systemic (NOMS) framework is an important aspect of systemic assessment for patients with spinal metastasis [8] and plays a useful guiding role in deciding for or against surgical interventions [9]. Appropriate surgical strategies are determined based on the estimation of postoperative survival, and previous studies have reported many prognostic scoring systems, such as the revised Tokuhashi score [10], Baur score [11], Tomita score [12], and Skeletal Oncology Research Group (SORG) [13]. However, these tools have been reported to have decreased accuracy over time and underestimate survival because each prognostic scoring system has its suitable and specific population study [14,15], as well as changes in the disease and patient’s characteristics, improving results of concurrent therapy, and presence of mortality and/or survival-related factors that are not included in these predictive tools [16-18].
To improve the accuracy of prediction, this study aimed to develop predictive tools using machine learning. These tools will consider several mortality-related factors, including patient characteristics, disease characteristics, laboratory investigations, and nonsurgical interventions. With the ability to continuously self-learn, these tools will be able to maximize their effectiveness in handling complex data.
Materials and Methods
Guideline
This study followed the Transparent Reporting of a Multivariable Prediction Model for Individual Prognosis or Diagnosis guidelines [19].
Source of data
Data were obtained from the medical database of the Department of Orthopedic Surgery. Consecutive patients who underwent spinal surgery between January 2004 and December 2018 were retrospectively identified.
Participants
Consecutive patients who underwent surgery (spinal decompression, fusion, or instrumentation) for spinal metastases between January 2004 and December 2018 were enrolled. The inclusion criteria were as follows: (1) diagnosis of spinal metastasis identified using International Classification of Diseases, 10th revision, Thai Modification codes (ICD 10-TM) C79.5 and C79.8; (2) age ≥18 years; and (3) history of surgery for spinal metastasis identified using International Classification of Diseases, 9th revision, Clinical Modification procedure with extension codes (ICD 9-CM) 03.0, 03.4, 03.09, 81.0, and 81.00–81.08 for surgical procedure.
Ethics approval
This study was approved by the Siriraj Institutional Review Board (SIRB) (COA no., Si401/2020; SIRB protocol no., 195/2563 [IRB1]). Informed consent was obtained from all individual participants included in the study.
Outcome and predictive variables
The primary outcome of this study was survival at postoperative days 90, 180, and 365. In the selection of preoperative predictors, established scoring systems [10-13,20,21] were used, and recent studies that have highlighted prognostic factors for patients with spinal metastasis were referred [16,18,22]. The previously reported factors are shown in Fig. 1. Our goal was to construct a predictive framework that not only aligns with recognized scoring models but also integrates emerging survival-related factors, some of which have been traditionally overlooked.
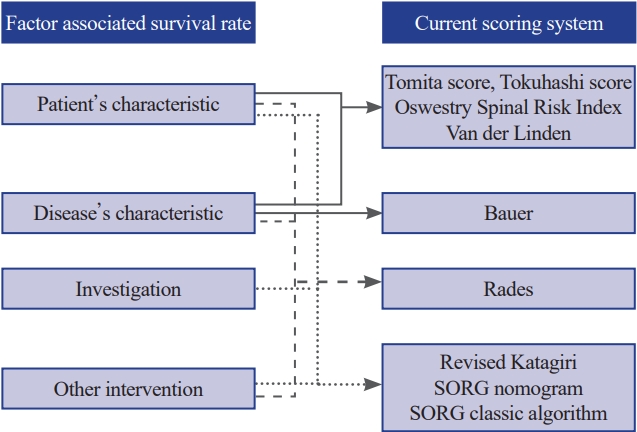
Categorized factors associated survival rate from previous studies. SORG, Skeletal Oncology Research Group.
Variables
These variables were categorized into four groups:
Patient characteristics
These included age (years), sex, body mass index (kg/m2), Charlson comorbidity index (CCI) in addition to metastatic cancer [23], American Society of Anesthesiologists (ASA) physical status classification, Frankel grade classification, Eastern Cooperative Oncology Group (ECOG) performance status, Karnofsky’s performance status (KPS), and history of smoking. These were included based on their established relevance in previous scoring systems such as the revised Tokuhashi score and SORG algorithms, and their known effect on survival as suggested by recent literature.
Disease characteristics
These included the primary site of cancer (if presented, or unknown primary tumor), primary tumor histology, level of spinal metastases (cervical, thoracic, lumbar, sacrum, or combination of regions), presence of myelopathy, symptomatic neurological compression level (upper or lower of the cervical, thoracic, lumbar spines, and sacrum), presence of solid-organ metastasis, and time from clinical presentation (pain or neurological deficit) to surgery (days). These factors are critical because they directly relate to the tumor biology and the patient’s clinical presentation, which can be significant indicators of survival outcomes.
Laboratory investigations
These include hemoglobin (g/dL), platelet–lymphocyte ratio, albumin (g/dL), alkaline phosphatase (ALP, IU/L), creatinine (mg/dL), and serum calcium levels (mg/dL). These markers provide insight into the patient’s physiological state and correlate with postoperative survival rates.
Other interventions
Notably, preoperative chemotherapy was considered because of its potential effect on patient outcomes, reflecting both the treatment landscape and recent findings on the interplay between systemic therapy and surgical interventions.
Missing data
The numbers of missing data were as follows; CCI, 7 (1.8%); ECOG performance status, 8 (2%); ASA classification, 4 (1%); KPS, 4 (1%); Frankel grade classification, 7 (1.8%); exact time from clinical presentation to surgery, 133 (34.2%); body mass index, 87 (22.3%); hemoglobin, 13 (3.3%); albumin level, 28 (7%); ALP, 37 (9.5%); platelet–lymphocyte ratio, 77 (19.8%); serum calcium, 103 (26%); and primary tumor histology, 84 (22%).
Preprocessing
In cases where preoperative data were unavailable, multiple imputations with chained equations were utilized [24]. To reduce the influence of different variable units and quantity levels, numerical variables were scaled to a standard deviation of 1 and a mean of 0, and dummy encoding was employed for categorical variables. Outliers whose laboratory values were 3 standard deviations from the average laboratory value at our hospital were eliminated.
Algorithm training and validation
The following algorithms were selected: extreme gradient boosting, logistic regression, linear discriminant analysis, random forest classifier, naive Bayes, gradient boosting classifier, quadratic discriminant analysis, AdaBoost classifier, CatBoost classifier (https://catboost.ai/), light gradient boosting machine, extra trees classifier, K neighbors classifier, and decision tree classifier. All models were created with Python ver. 3.9 (Python Software Foundation, Wilmington, DE, USA) using the Scikit-learn library ver. 1.0.1 (https://scikit-learn.org/stable/whats_new/v1.0.html#version-1-0-1) under an open-source simplified BSD (Berkeley Software Distribution) license.
In the training dataset, manual parameter tuning, grid search, and random search were conducted to identify the optimal hyperparameters that provided the highest accuracy in a five-fold internal cross-validation of each model. The dataset was randomly divided into the training and testing datasets at an 80:20 ratio. Model training was conducted using the training dataset with performance validation by five-fold cross-validation. A class weighting strategy was also used to ensure that the trained model would take each class into equal account despite class imbalance.
The performances of the algorithms were evaluated using the testing dataset by evaluating and comparing the area under the receiver operating characteristic (ROC) curve (AUC), F1-score, accuracy, and calibration loss among models [25,26]. The performance of a classification model was also assessed using a confusion matrix that compares the actual values (from the testing dataset) with the predicted values. However, these metrics include tradeoffs, such as the tradeoff between precision and recall; thus, the optimal model for deployment was selected using the AUC. The contribution of each variable to the prediction model was evaluated using the Shapley Additive Explanations (SHAP) values. Each point on the chart represents one SHAP value for a prediction and feature. Red and blue indicated higher and lower values of a feature, respectively.
The most accurate predictive models of each period will be explained in detail in the performance assessment section.
Results
Participants
In total, 389 patients with 90-, 180-, and 365-day mortality rates of 71 (18%), 160 (41%), and 174 (45%) postoperatively were identified, respectively. Moreover, 167 (43%) were female. The median age was 57 years (interquartile range, 40.5–73.5 years). The baseline characteristics of the study population are shown in Table 1.
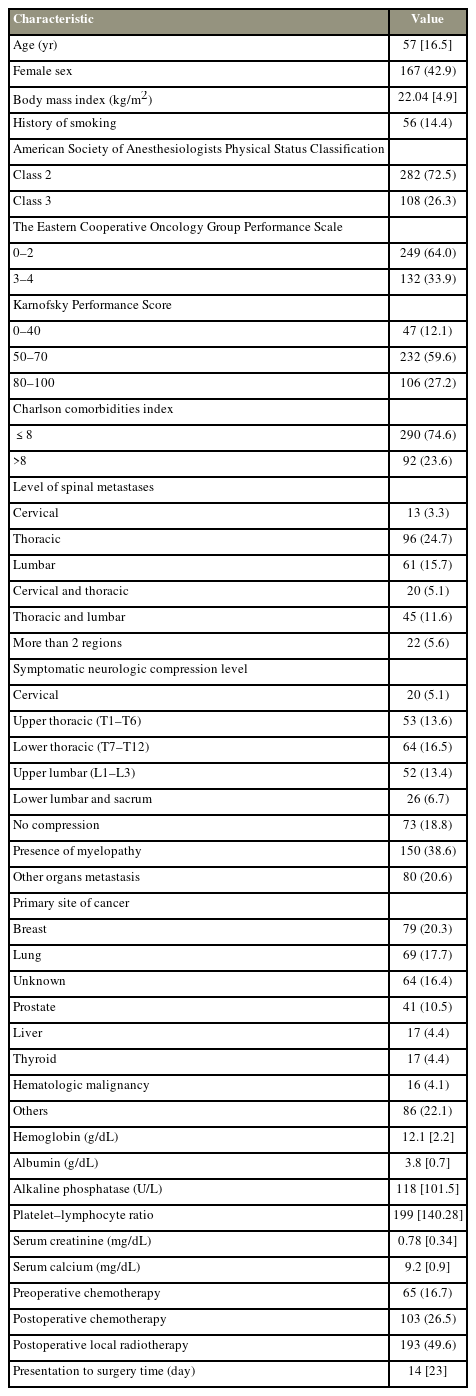
Characteristics of patients (n=389)
Model development and performance for survival prediction
365-day survival prediction
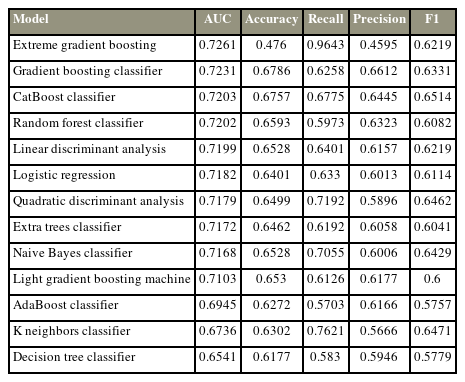
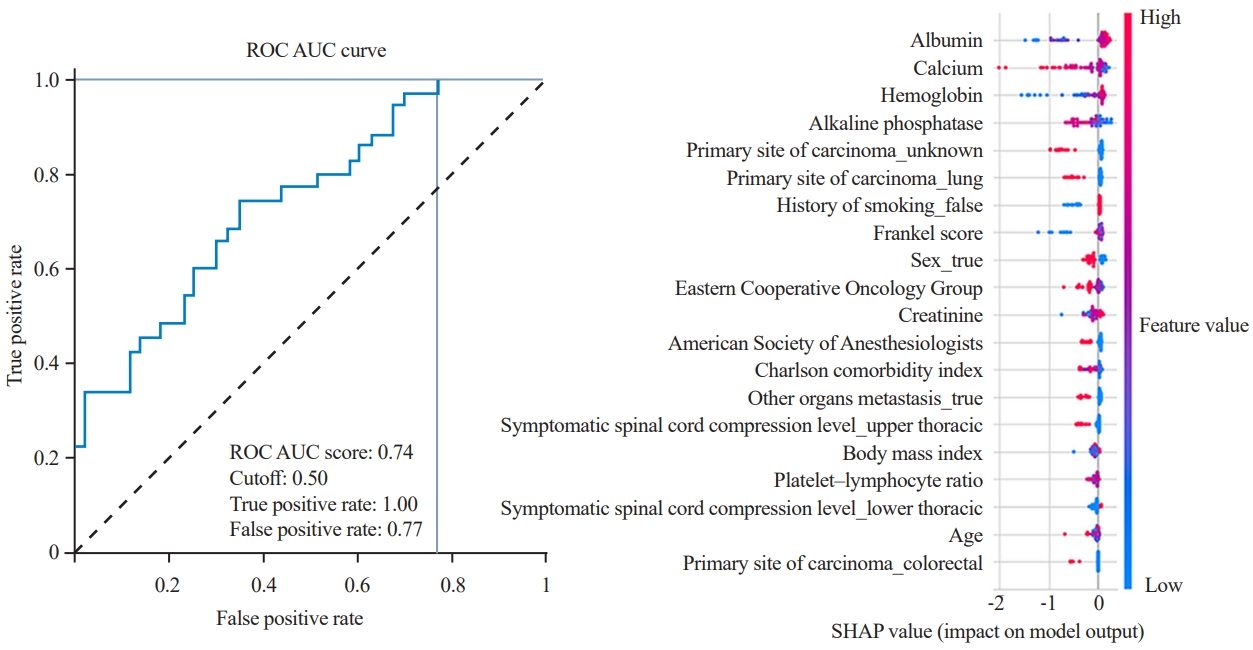
Most algorithms achieved fair to good performance in the internal validation or training datasets (ROC AUC, 0.632–0.731) (Table 2). XGBoost (https://xgboost.ai/) was chosen as the final model with an AUC of the testing dataset of 0.693, accuracy of 0.564, precision of 0.508, recall of 0.857, and F1 score of 0.638. Albumin was the most influential factor in 365-day survival prediction. A higher serum albumin level, lower ALP levels, and lower platelet–lymphocyte ratio positively affected the survival chance. The ROC curve of the XGBoost algorithm and the SHAP value are shown in Fig. 2.
Comparison of the model performance in cross-validation of the dataset for 365-day survival prediction
Characteristics of XGBoost model for 365-day survival prediction: receiver operating characteristic (ROC) curve and Shapley Additive Explanations (SHAP) value summary graph and their impact on the prediction. AUC, area under the receiver operating characteristic curve.
180-day survival prediction
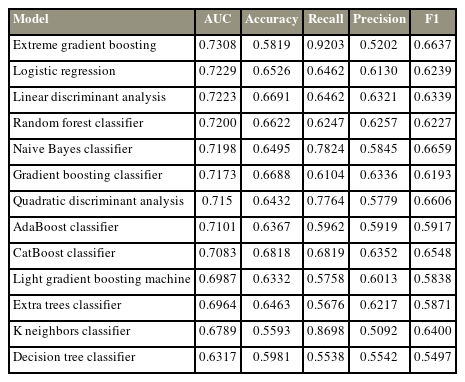
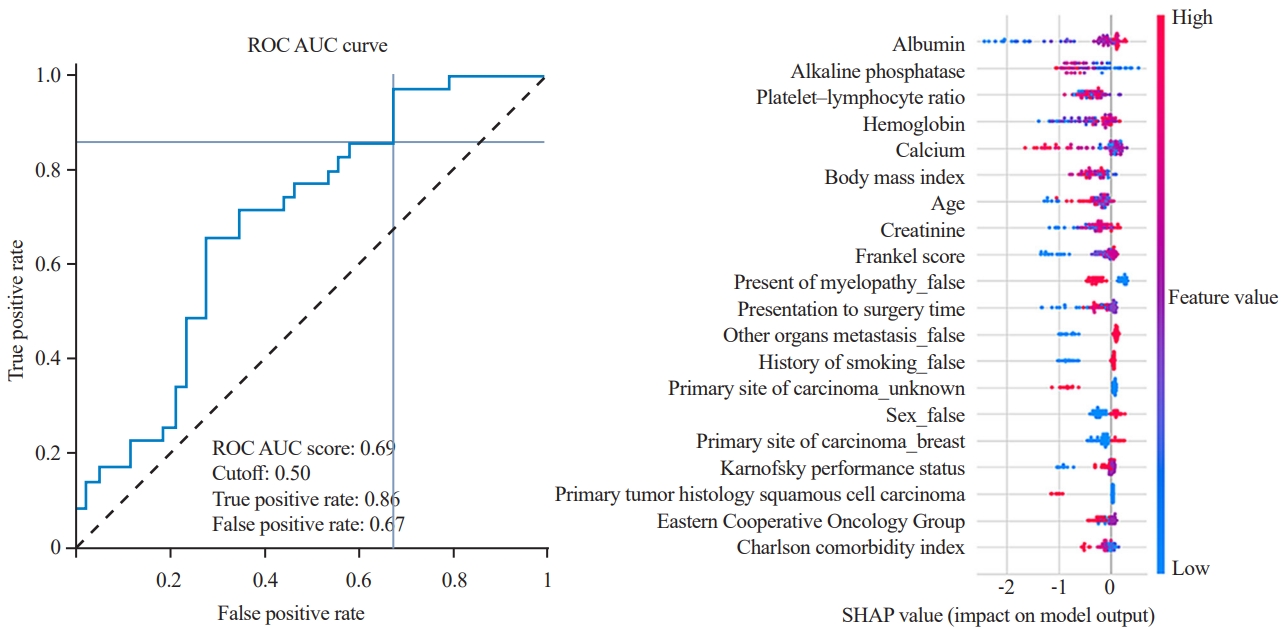
Most algorithms achieved fair to good performance in the internal validation or training dataset (ROC AUC, 0.654–0.726) (Table 3). XGBoost was chosen as the final model with an AUC of the testing dataset of 0.744, accuracy of 0.5, precision of 0.473, recall of 1, and F1 score of 0.642. Albumin was the most influential factor in 365-day survival prediction. Higher serum albumin, lower serum calcium, and higher hemoglobin levels positively affected the survival chance. The ROC curve of the XGBoost algorithm and the SHAP value are shown in Fig. 3.
Comparison of the model performance in cross-validation of the dataset for 180-day survival prediction
Characteristics of XGBoost model for 180-day survival prediction: receiver operating characteristic (ROC) curve and Shapley Additive Explanations (SHAP) value summary graph and their impact on the prediction. AUC, area under the receiver operating characteristic curve.
90-day survival prediction
Most algorithms achieved fair to good performance in the internal validation or training dataset (ROC AUC, 0.701–0.749) (Table 4). CatBoost was chosen as the final model with an AUC of the testing dataset of 0.758, accuracy of 0.705, precision of 0.658, recall of 0.714, and F1 score of 0.685. Albumin is the most influential factor in 365-day survival prediction. Higher serum albumin levels, lower ALP level, and primary breast cancer positively affected the survival chance. The ROC curve of the CatBoost algorithm and the SHAP value are shown in Fig. 4.
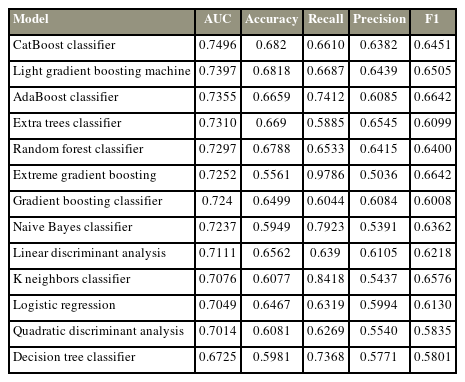
Comparison of the model performance in cross-validation of the dataset for 90-day survival prediction
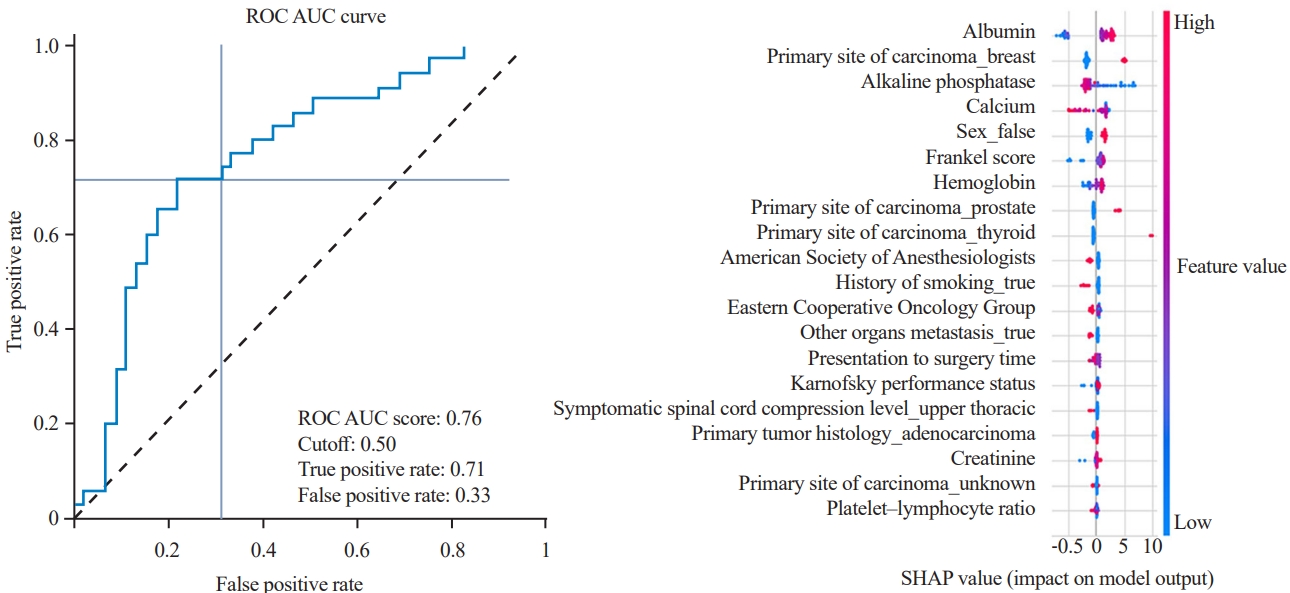
Characteristics of CatBoost model for 90-day survival prediction: receiver operating characteristic (ROC) curve and Shapley Additive Explanations (SHAP) value summary graph and their impact on the prediction. AUC, area under the receiver operating characteristic curve.
Discussion
The primary goal of spinal metastasis surgery is palliative, focusing on preserving or improving the quality of life by controlling pain and maintaining mobility. The treatment of metastatic spinal cancers involves a multidisciplinary approach, including chemotherapy, radiotherapy, and surgery. Various decision-making systems have been developed to assist in choosing the most appropriate treatment for each patient.
An updated review of the treatment strategy for spinal metastasis by Hong et al. [27] in 2022 classified the decision-making system as follows: First, classification-based prognostic models, such as the Tomita et al. [12], Tokuhashi et al. [10], Bauer and Wedin [11], and Katagiri et al. [20] scoring systems, estimate patient survival using various prognostic factors, such as the type of primary cancer and presence of visceral metastasis. Despite their usage, recent studies have highlighted their poor accuracy, partly because of their inability to account for advancements in cancer treatments [28-30]. This has resulted in the development of “second-generation models.” Many previous studies have utilized machine-learning algorithms to develop decision-making systems with satisfactory accuracy in predicting survival [31,32]. Second, principle-based systems, such as the NOMS framework [8] and the LMNOP (location, mechanical instability, neurology, oncology, and patient’s factors) system [33], offer more specific treatment suggestions based on a patient’s oncologic, systemic, and functional states. They are better suited to reflect advancements in various treatments than classification-based models. Future decision-making systems for spinal metastasis are expected to incorporate multiinstitutional data, consider tumor genetics, utilize novel methodologies such as artificial intelligence, and integrate prognostic and principle-based systems for a more comprehensive approach.
In this study, we developed predictive tools for predicting survival in patients with spinal metastasis after palliative surgery. The variables were selected from previous predictive models of metastatic spine disease [10-13,20,21] and other mortality-related factors of patients with spinal metastasis [16,18,22]. The models achieved satisfactory performance with AUCs of 0.793, 0.726, and 0.731 for the 90-, 180-, and 365-day survival prediction. XGBoost achieved superior performance on both cross-validations of the training and testing datasets in 180- and 365-day survival prediction. CatBoost achieved superior performance on both cross-validations of the training and testing datasets in the 90-day survival prediction.
We stratified several previously reported variables of the existing predictive scoring systems into four groups and found that preoperative albumin level was the most important variable in survival prediction, which is related to previous studies [16,18]; however, it has never been included in the most cited predictive scoring systems [10-13,20,21]. Other important laboratory markers include the platelet–lymphocyte ratio, serum calcium, hemoglobin level, serum creatinine, and ALP level. KPS is also an important variable in 90- day survival prediction, which is correlated with previous scoring systems [10,11,17,34].
In a meta-analysis study, Luksanapruksa et al. [18] identified 17 independent poor prognostic factors and categorized them into cancer-specific and nonspecific prognostic factors, such as KPS, time to develop motor deficit before treatment, ECOG performance status, sex, presence of visceral metastases, and primary tumor type. These factors were included as variables during model development in the present study. However, the primary tumor type appears to be one of the most influential factors reported in the present study, and this may have resulted from the moderate amount of missing data of the variables in our study.
This study showed that a higher albumin level and a lower platelet–lymphocyte ratio positively affected the increase in the survival chance of patients after surgery, which corresponded to the findings of Schoenfeld et al. [16]. They reported that the platelet–lymphocyte ratio and serum albumin at presentation were significantly associated with survival and 6-month and 1-year mortality [16].
The important variables can be divided into modifiable (albumin, serum calcium, and hemoglobin levels) and nonmodifiable factors. Adjustment of preoperative modifiable factors to the proper level may increase the probability of survival of these patients after palliative surgery.
Compared with previous machine-learning algorithms to predict the survival of patients with spinal metastasis using SORG [31] and their updated external validation studies [32,35,36], Karhade et al. [31] reported 90-day and 1-year mortality rates of 181 (25.1%) and 385 (54.3%), respectively. The stochastic gradient boosting algorithm demonstrated the best performance for 90-day and 1-year mortality prediction with AUCs of 0.83 and 0.89 on the testing datasets, respectively. The external validation with many cohorts also showed the potential for 90-day and 365-day survival prediction with AUCs of 0.726–0.84 and 0.738–0.9, respectively (Table 5).
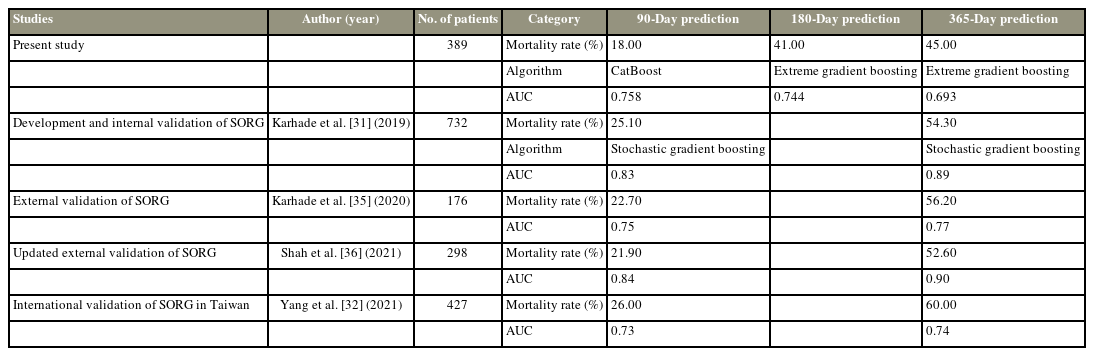
Comparison of algorithms between studies
Interestingly, external validation with different populations in another country showed reduced performance of the 90- and 365-day predictive models. This may result from different patient characteristics, patient selection guidelines at each medical center, or treatment algorithms. Even with the high accuracy in the prediction of the machine-learning model, it may not be applicable to the global population with the same accuracy.
Although machine-learning predictive tools hold great promise, they should not be seen as replacements for clinical judgment and expertise. Instead, they should be viewed as complementary tools that can help clinicians make informed decisions. As with any predictive model, the results must be interpreted within the context of the individual patient’s unique circumstances and medical history.
Despite the promising results of this study and the potential benefits of using machine-learning tools in predicting the survival of patients with spinal metastasis, certain limitations need to be acknowledged. First, our data were obtained from a single academic medical center, which resulted in the low number of patients included, potentially leading to the reduced performance of some machine-learning models. Second, missing data for several variables also present a challenge in our study. This limitation is inherent to retrospective studies and could affect the accuracy of our predictive models. Although multiple imputations with chained equations were applied to address this issue, the presence of missing data still introduces some degree of uncertainty. Machine-learning algorithms must thrive on vast and diverse datasets for optimal accuracy and generalizability. In this study, the relatively limited sample size may have hindered the full potential of the models to achieve higher accuracy. We acknowledge that the use of larger, multicenter datasets would likely result in more robust predictive models with enhanced accuracy and applicability to broader patient populations.
Conclusions
This study highlights the potential of machine-learning algorithms in predicting survival in patients who underwent palliative surgery for spinal metastasis. Despite the limitations of this study, it paves the way for future research in this area. As the machine-learning field continues to advance and more data become available, we anticipate even greater accuracy and utility of predictive tools for enhancing patient care and treatment outcomes in the realm of spinal metastasis.
Notes
Conflict of Interest
No potential conflict of interest relevant to this article was reported.
Author Contributions
Conceptualization: BS, SW, PL. Data curation: BS, PI, SW. Formal analysis: KV, PC. Writing–original draft: BS, SW, PL. Writing–review & editing: BS, KV, PI, PC, SW, PL. Project administration: KV. Supervision: PL. All authors read and approved the final manuscript.
Acknowledgments
The authors gratefully acknowledge the patients who agreed to participate in this study and Miss Pinprapha Boonhyad of the Division of Research, Department of Orthopaedic Surgery, Faculty of Medicine Siriraj Hospital, Mahidol University for assistance with statistical analysis, manuscript preparation, and journal submission process.