Comparison of Efficacy between Transforaminal Epidural Steroid Injection Technique without Contrast versus with Contrast in Lumbar Radiculopathy: A Prospective Longitudinal Cohort Study
Article information

Abstract
Study Design
A prospective longitudinal cohort study.
Purpose
To evaluate the efficacy of two different techniques of transforaminal epidural steroid injection (TFESI) with contrast and without contrast in treating lumbar radiculopathy.
Overview of Literature
Epidural injections are one of the most frequently used nonsurgical treatment options for managing lumbar radiculopathy. This study aims to simplify the TFESI technique, which is effective and requires less effort to replicate.
Methods
We collected data on 118 patients who underwent TFESI without contrast versus TFESI with contrast for lumbar radiculopathy. The pain was evaluated using a Numerical Rating Scale (NRS) for pain at 5 minutes, 2 hours, 2 weeks, and 2 months. The functional status was assessed using the Oswestry Disability Index (ODI) score. The operation time and fluoroscopic dosage were also measured using this score.
Results
Two groups of patients with radiculopathy were studied, comprising of 56 patients in the non-contrast group (NC group) and 62 patients in the contrast group (C group). There was a significant decrease in pain, as evaluated by NRS, in the C group compared to the NC group at 5 minutes post-procedure (3.39±1.54 vs. 3.86±0.72, with a p-value of 0.039). There was no significant difference in NRS scores at 2 hours, 2 weeks, and 2 months, as well as in ODI scores. The operation time and fluoroscopic dosage were lower in the group without contrast compared to the contrast group, with 12.58±3.30 minutes per level vs. 16.70±5.94 minutes per level (p<0.001) and 3.62±1.66 mGy vs. 5.32±2.74 mGy per level (p=0.014), respectively. No complications were reported in either group.
Conclusions
There is no difference in pain and functional outcome when treating lumbar radiculopathy with or without contrast using TFESI. The TFESI without contract technique has a shorter operation time and lower intra-operative fluoroscopic dosage without complications.
Introduction
Low back pain is one of the most frequent issues in clinical practice. Although muscle sprain is the most common cause of this problem, pain from spine diseases such as spinal stenosis and herniated discs can account to 3%–4% of cases [1]. Studies conducted in the United States of America indicate that 13%–40% of the American population will experience sciatica pain resulting from spinal nerve compression at some point in their lives [2]. These symptoms have an impact on the patient’s daily activities and work, ultimately leading to a decrease in their quality of life [3]. Previous studies have shown that inadequate treatment can lead to depression, anxiety, and insomnia in patients [4]. Our goal is to discover the most effective treatment to assist patients in returning to their normal daily activities.
The conservative treatment approach for this condition includes pharmacological treatment, rehabilitative exercise, and epidural steroid injections (ESIs). Surgical treatment is considered the last resort for patients who do not respond to the aforementioned treatments. The epidural injection is one of the most frequently used nonsurgical treatment modalities for lumbar radiculopathy, which has been proven to effectively reduce pain [5–7] and decrease the likelihood of requiring surgical intervention [8]. As a result, this approach is becoming increasingly popular [9]. ESI can be achieved using multiple techniques. Multiple randomized trials have assessed the effectiveness of various approaches for epidural injections [6,10].
Various complications may arise during ESI, such as potential allergic reactions to contrast agents and contrast-induced acute kidney injury in patients with renal disease. Moreover, the accessibility of contrast agents may be restricted in specific areas. A previous retrospective study compared the effectiveness of ESI with and without contrast agents and concluded that there was no significant difference in pain reduction or functional outcomes between the two methods [11].
The studies on the effectiveness of transforaminal epidural steroid injection (TFESI) without contrast versus with contrast for lumbar radiculopathy are limited. We aim to enhance treatment effectiveness and minimize complications by simplifying the technique, reducing operative time, and decreasing the likelihood of allergic contrast reactions. This study assessed the efficacy of TFESI, with or without contrast, for the treatment of lumbar radiculopathy.
Materials and Methods
1. Study design and participants
The protocol for the study underwent review and approval by the Clinical Research Ethics Committee of Thammasat University, with registration number MTU-EC-OO-OT-1-044/60. Written informed consents were obtained from the patients. We conducted a non-randomized prospective longitudinal therapeutic cohort study on patients exhibiting symptoms of lumbar radiculopathy, who visited Thammasat University Hospital from the beginning of April 2017 to the end of December 2021. The following are the inclusion criteria: patients must be 18 years old or older and must have radiculopathy (pain, numbness, or weakness) that radiates down their lower extremities more than their back pain. The symptoms must have lasted for less than 3 months in total. All participants must have received a diagnosis of either lumbar disc herniation or spinal stenosis, including grade I spondylolisthesis without spinal instability, from orthopedic spine specialists who confirmed the diagnosis using magnetic resonance imaging or computed tomography myelogram. The need for ESI was not greater than two levels and was confirmed by spine specialists.
Patients who had undergone spinal surgery previously, those with traumatic back pain, and those with back pain caused by diseases other than those mentioned were excluded. Patients with sequestered lumbar disc herniation, severe anatomical distortion, metastatic tumor, cauda equina syndrome, or conus medullaris syndrome, and patients with progressive neurodeficits were excluded from the study. Women who are pregnant or lactating, individuals with a history of or potential for adverse reactions to contrast, those taking anticoagulants or antiplatelets, and individuals with poorly controlled underlying diseases such as diabetes and hypertension are among those excluded from participation. Patients who experienced complications from treatment, those who required surgical intervention, and those who did not return for follow-up after treatment were implicitly excluded from the study.
All participants were divided into two groups: the non-contrast group (NC group) and the contrast group (C group). All participants were assessed using a Numerical Rating Scale (NRS) before treatment, as well as at 5 minutes, 2 hours, 2 weeks, and 2 months after treatment [12,13]. Evaluation done by the Thai version of the Oswestry Disability Index (ODI) [14] prior to treatment and 2 weeks and 2 months after treatment. All ESIs without contrast were performed by the orthopedic spine specialist, while ESIs with contrast were performed by two orthopedic spine specialists (R.A., K.S.). For the steroid preparation, triamcinolone acetonide (TA) 40 mg/mL with 1% lidocaine was used. A single 1 mL (40 mg) dose of TA was administered for patients requiring no more than two sites of ESIs. For patients requiring three or four sites of ESIs, a 2 mL (80 mg) dose of TA was given. TA was mixed with 1% lidocaine at a ratio of 2 mL per location of ESI.
All ESIs were performed using the transforaminal approach with patients positioned in a prone position on a radiolucent table. The procedure was carried out with the aid of uniplanar fluoroscopic guidance to precisely position the needle just below the pedicle of the required level. Local anesthetic was administered at the marked area for all cases. The dosage used was 1 mL of TA and 1% lidocaine. In NC group, a 9 cm, 23G Quincke spinal needle (Becton Dickinson S.A., Madrid, Spain) was inserted vertically toward the pedicle targeting the safe triangle [15]. This triangle is defined by the pedicle as the superior border, the lateral border of the vertebral body as the lateral border, and the outer margin of the spinal nerve as the inferior border. The needle should be positioned below the pedicle and to the side of the line that connects the centers of the pedicles. At the L5–S1 level, the needle tip is positioned below the L5 pedicle and slightly to the side of the lamina’s outer edge. The needle’s position was verified using an anterior-posterior view with fluoroscopy (Fig. 1), taking into account the presence of provocative pain. As the needle touches the nerve root sheath, the patient feels tingling sensations in their foot and a sharp, stabbing pain in their leg [16]. The solution, consisting of 2 mL of TA (40 mg/mL) and 1% lidocaine, was slowly injected at each necessary position.
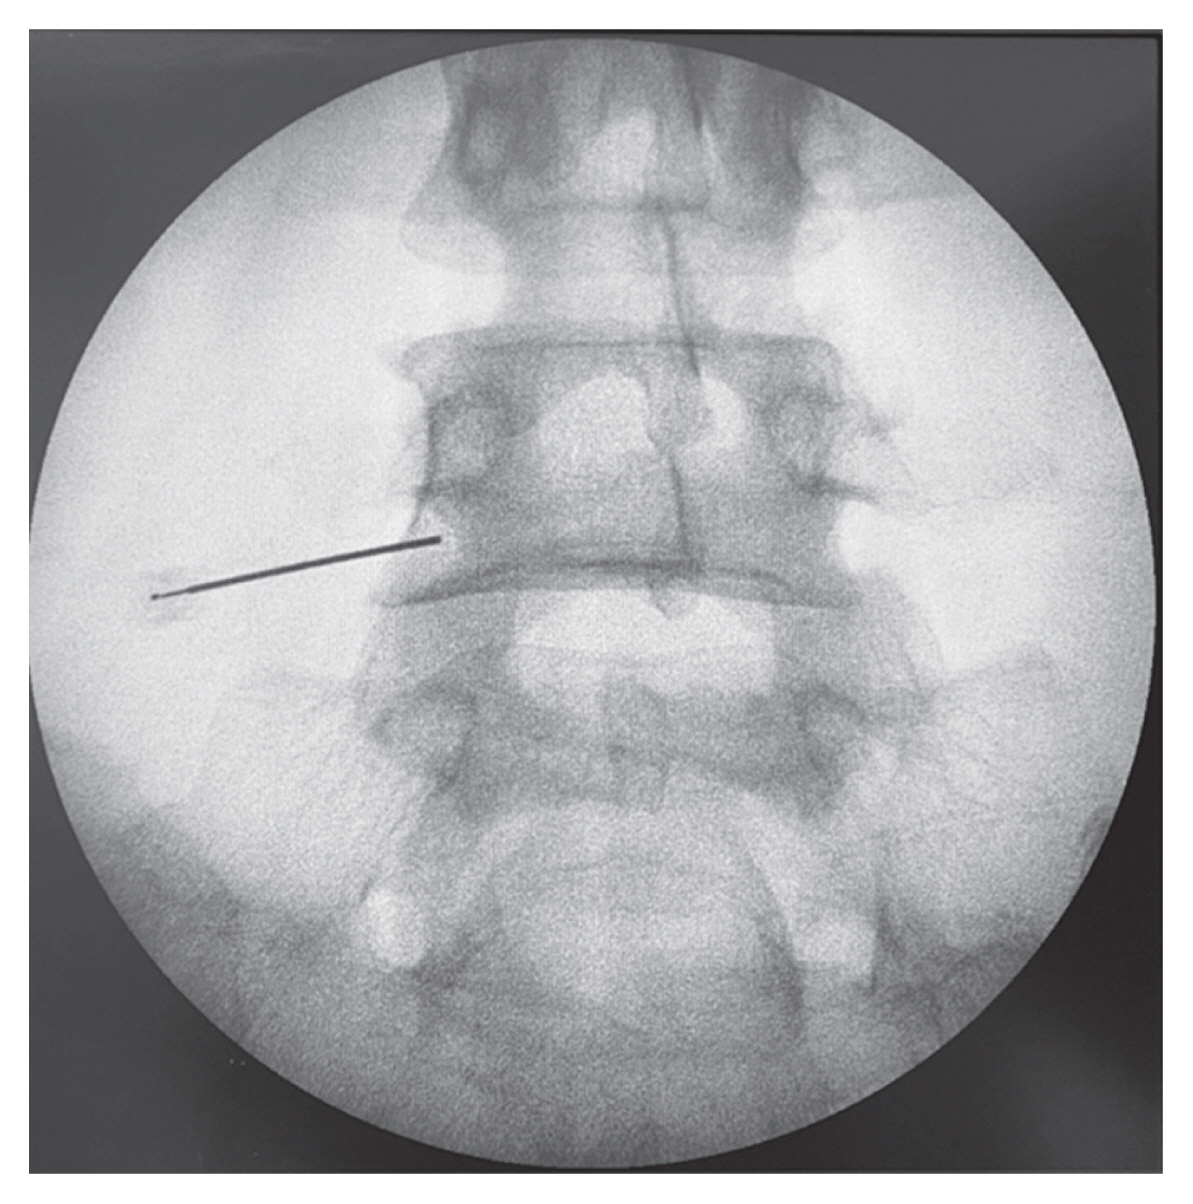
The anterior-posterior view of the plain radiograph revealed the needle’s position before the injection of the triamcinolone.
In C group, the position of a 9 cm, 23G Quincke spinal needle was also checked under fluoroscopy. The key is to position oneself within the safe triangle on the anterior-posterior view, which is located above the intervertebral neural foramen or under the pedicle on the lateral view. After injecting 0.5 to 1 mL of Iohexol (300 g/mL, Omnipaque; Patheon Italia S.p.A., Monza E Brianza, Italy), the fluoroscopy was used to obtain anterior-posterior and lateral views to confirm the needle’s position. After confirming the needle’s position in the epidural space, a 2 mL solution of TA solution (40 mg/mL) and 1% lidocaine was slowly injected. The procedure was repeated at every planned position. Each patient underwent NRS evaluation at 5 minutes and 2 hours following the procedure. All patients were monitored for a minimum of 4 hours following the procedure to detect any potential complications.
All patients will receive the same pain control medication, which includes non-steroidal anti-inflammatory drugs, muscle relaxants, and gabapentinoids. The patients were scheduled for appointments at the outpatient clinic every 2 weeks and 2 months. If patients showed any signs of complications, they would receive appropriate treatment as necessary.
2. Statistical analysis
According to previous studies [17,18], the mean weight of ODI score in herniated nucleus pulposus and sciatica pain was 44.65 [17], with a standard deviation of 15 [18]. A two-sample test of equality of means [19], with a power of 80% and a 5% significance level, was used to detect the difference in ODI scores at 10, resulting in a sample size of 36 patients per arm. Standard descriptive statistics were calculated. The Student t-test and Mann-Whitney U test were used to analyze the differences in preoperative NRS, preoperative ODI, operation time, and fluoroscope dosage between the two groups. A Pearson’s chi-square test was conducted to analyze the variations in the frequency of ages, diagnoses, and levels of injection. The repeated analysis of variance test was conducted to analyze the variations between the postoperative NRS (5 minutes, 2 hours, 2 weeks, and 2 months) and postoperative ODI (2 weeks and 2 months). All analyses were two-sided, and a p-value less than 0.05 was considered statistically significant.
Results
A total of 118 patients were included in this study, with 56 in the NC group and 62 in the C group. There was no statistically significant differences observed between the two groups with regards to their baseline demographic and characteristic data, as shown in Table 1. The mean age in the NC group is 62.8±14.5 years, while the mean age in the C group is 62.1±12.3 (with a p-value of 0.76). The male-to-female ratio in the NC group is 1:1.8, compared to a ratio of 1:2.64 in the C group (p-value of 0.33). In terms of diagnoses, the NC group had a higher percentage of individuals with spinal stenosis (85.7% compared to 77.4%), while the C group had a higher percentage of individuals with disc herniation and spondylolisthesis (14.5% compared to 8.9% and 8.1% compared to 5.4%, respectively). There were no significant differences in diagnoses between the two groups (p-value of 0.51). The most prevalent level of radiculopathy in the NC group is L3–L5, accounting for 32.7%, with L4–L5 following at 14.5%. In the C group, the most common level is L4–L5, accounting for 38.7%, with L3–L5 following at 29%. There were no significant statistical differences between the two groups in terms of radiculopathy levels (p-value of 0.21).

Demographic data
1. Numerical Rating Scale
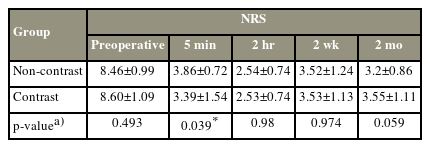
The Numerical Rating Scale (NRS) was assessed prior to the procedure and at 5 minutes, 2 hours, 2 weeks, and 2 months post-procedure. There is no significant difference in baseline NRS between the two groups (p-value of 0.49). At the 5-minute interval, both groups experienced a 55% decrease in NRS score compared to baseline. The C group (contrast) demonstrated a statistically significant decrease in NRS score (3.39±1.54) compared to the NC group (non-contrast; 3.86±0.72) with a p-value of 0.039. After 2 hours, both groups experienced a reduction in NRS of approximately 70% from baseline. However, there was no significant statistical difference between the two groups, although the C group had a slightly lower NRS (2.53±0.74 versus 2.54±0.74) with a p-value of 0.98. Two weeks after the procedure, it was observed that the NRS score had slightly increased, with an NRS of 3.52±1.24 in the NC group and 3.53±1.13 in the C group. There was no significant statistical difference between the two groups, with a p-value of 0.947. After 2 months, the NRS in the NC group (3.2±0.86) was slightly lower than in the C group (3.55±1.11), but this difference was not statistically significant (p=0.059) (Table 2, Fig. 2).
NRS score
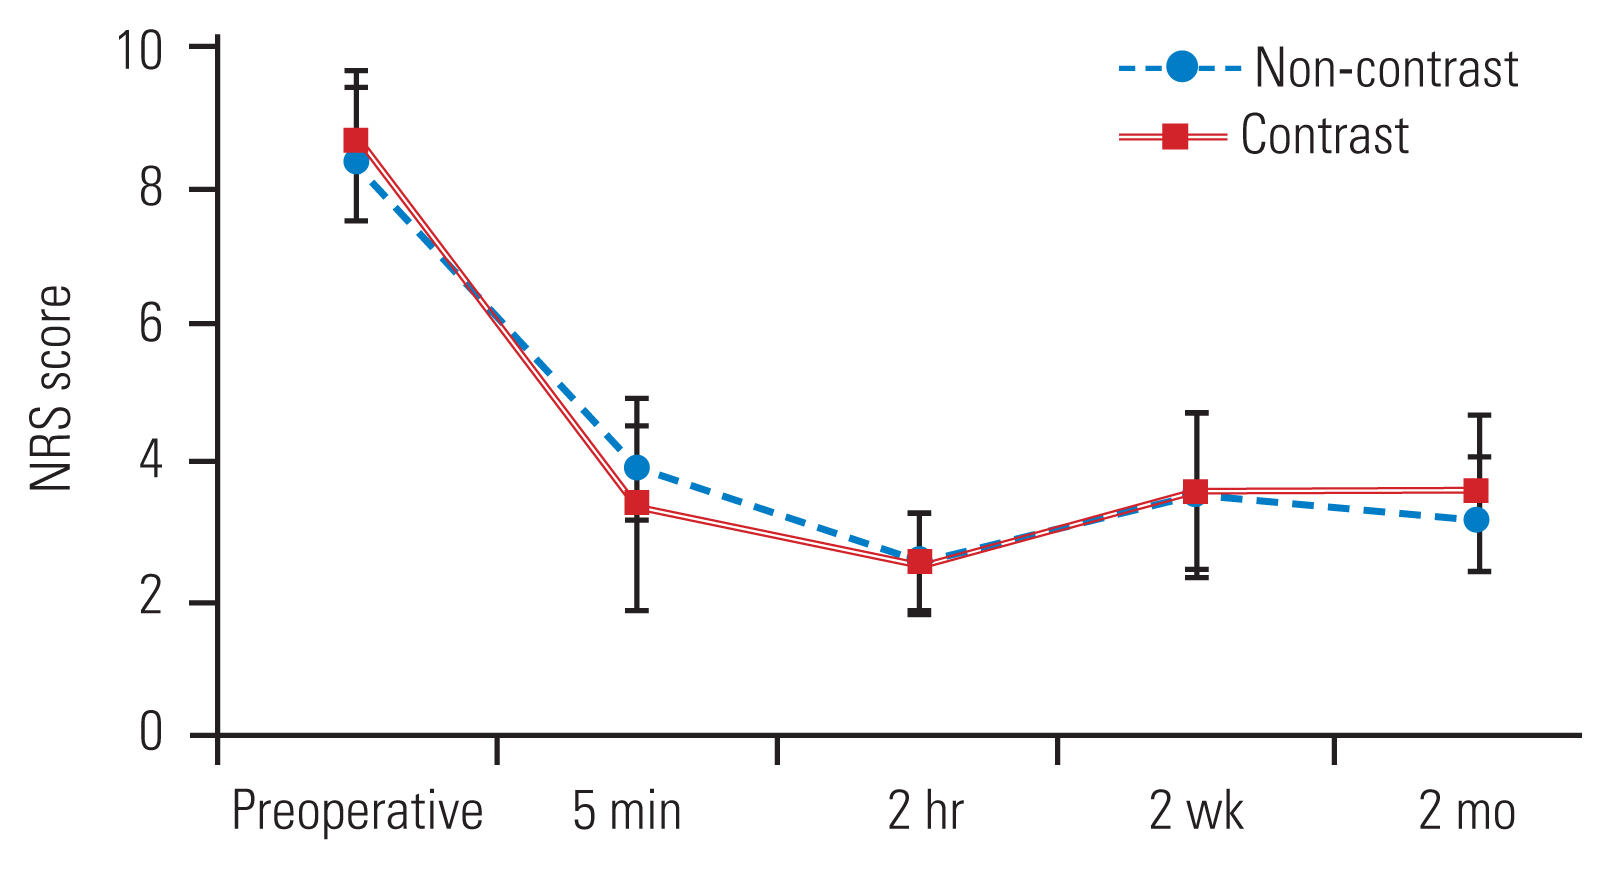
The graph of Numeric Rating Scale (NRS) scores.
2. Oswestry Disability Index
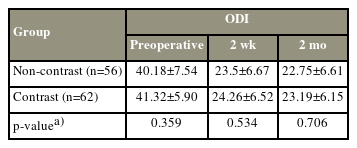
The ODI was assessed as a baseline prior to the procedure, and then again at 2 weeks and 2 months after the procedure. The C group had a lower ODI compared to the NC group at all three evaluation time points (baseline, 2 weeks, and 2 months), with a mean of 40.18±7.54 versus 41.32±5.90 (p-value of 0.359), 23.5±6.67 versus 24.26±6.52 (p-value of 0.534), and 22.75±6.61 versus 23.19±6.15 (p-value of 0.706), respectively. However, these differences were not statistically significant. Data from both groups showed a significant improvement in ODI after the procedure at 2 weeks and 2 months compared to baseline, with a mean increase of 17 units (p<0.001) (Table 3, Fig. 3).
ODI score
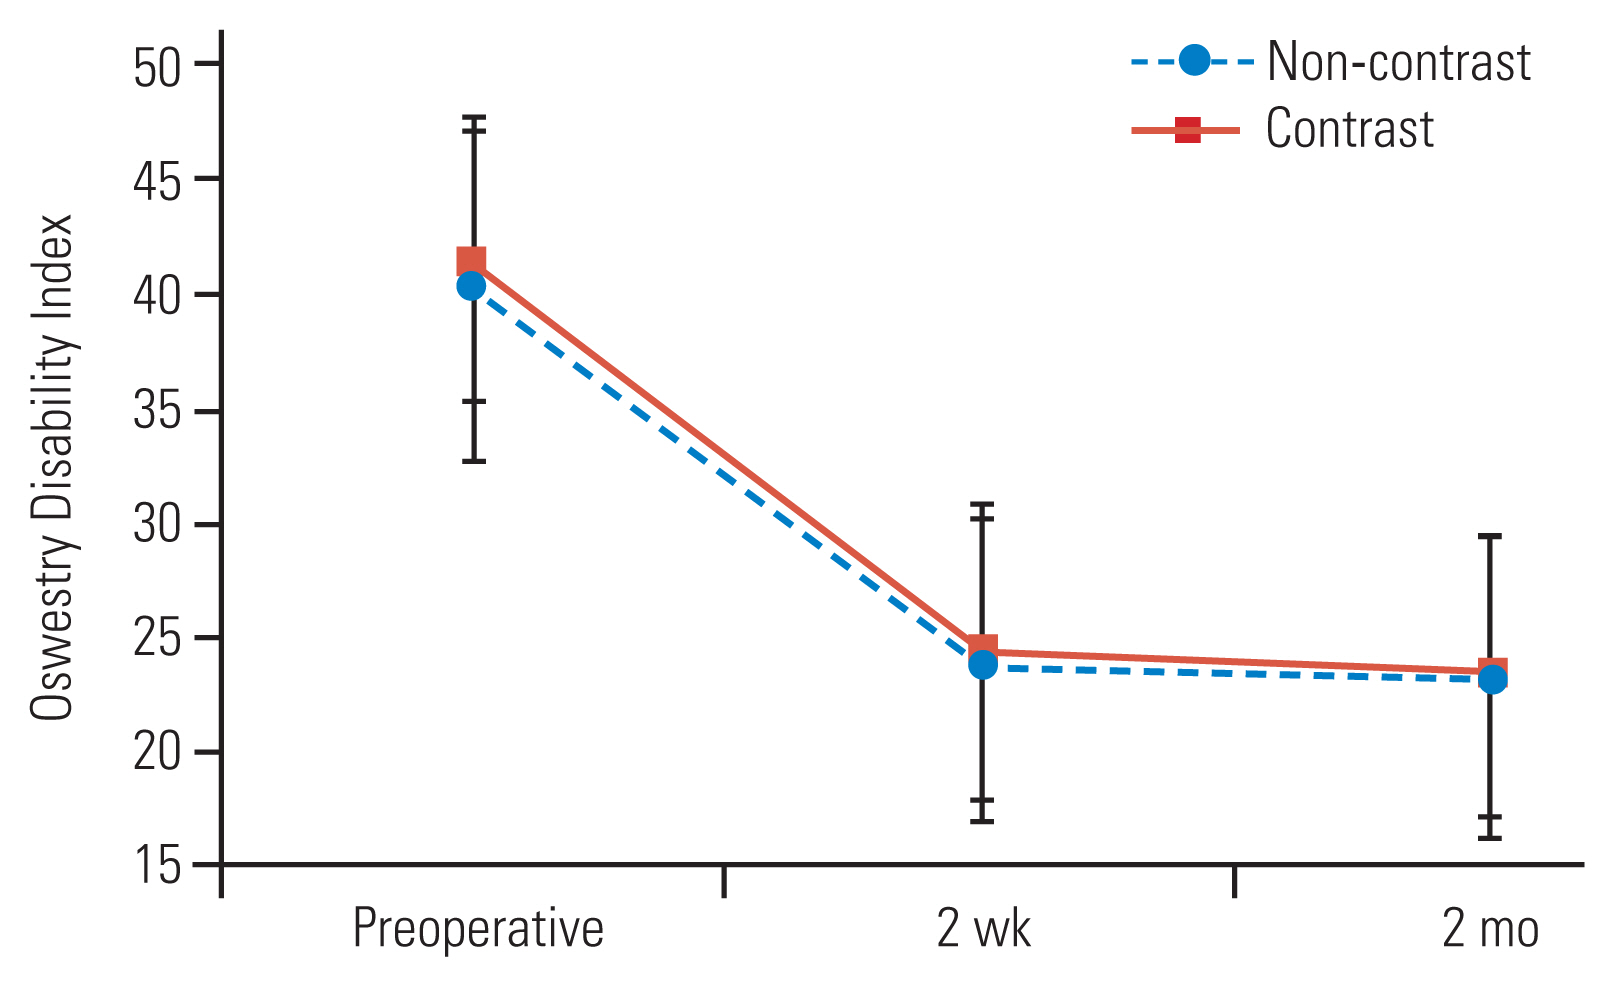
The graph of Oswestry Disability Index.
3. Time and fluoroscopic dosage
After calculating the duration of each procedure from when the patient entered to when they left the operating room, it was found that the NC group had a significantly shorter procedural time. The mean time for the NC group was 20.96±4.90 minutes, while the C group had a mean time of 23.73±4.72 minutes, with a p-value of 0.002. When considering the number of lumbar levels, the NC group had a significantly shorter procedural time of approximately 4 minutes per level compared to the C group (12.58±3.30 minutes versus 16.70±5.94 minutes, p=0.0001).
Considering the amount of radiation exposure in each procedure, it was found that the NC group had a lower fluoroscopic dosage compared to the C group (3.62±1.66 mGy versus 5.32±2.74 mGy, p=0.0001). While analyzing the number of lumbar levels, it was found that the NC group had a 40% lower fluoroscopic dosage than C group (2.00±0.52 mGy compared to 3.45±1.36 mGy, p<0.0001) (Table 4 and Figs. 4, 5).
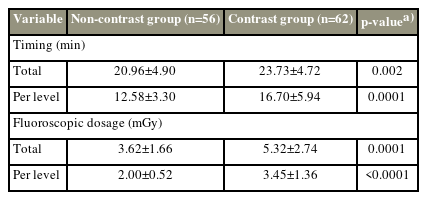
Timing and fluoroscopic dosage

The graph shows the time of the transforaminal epidural steroid injections in both groups.
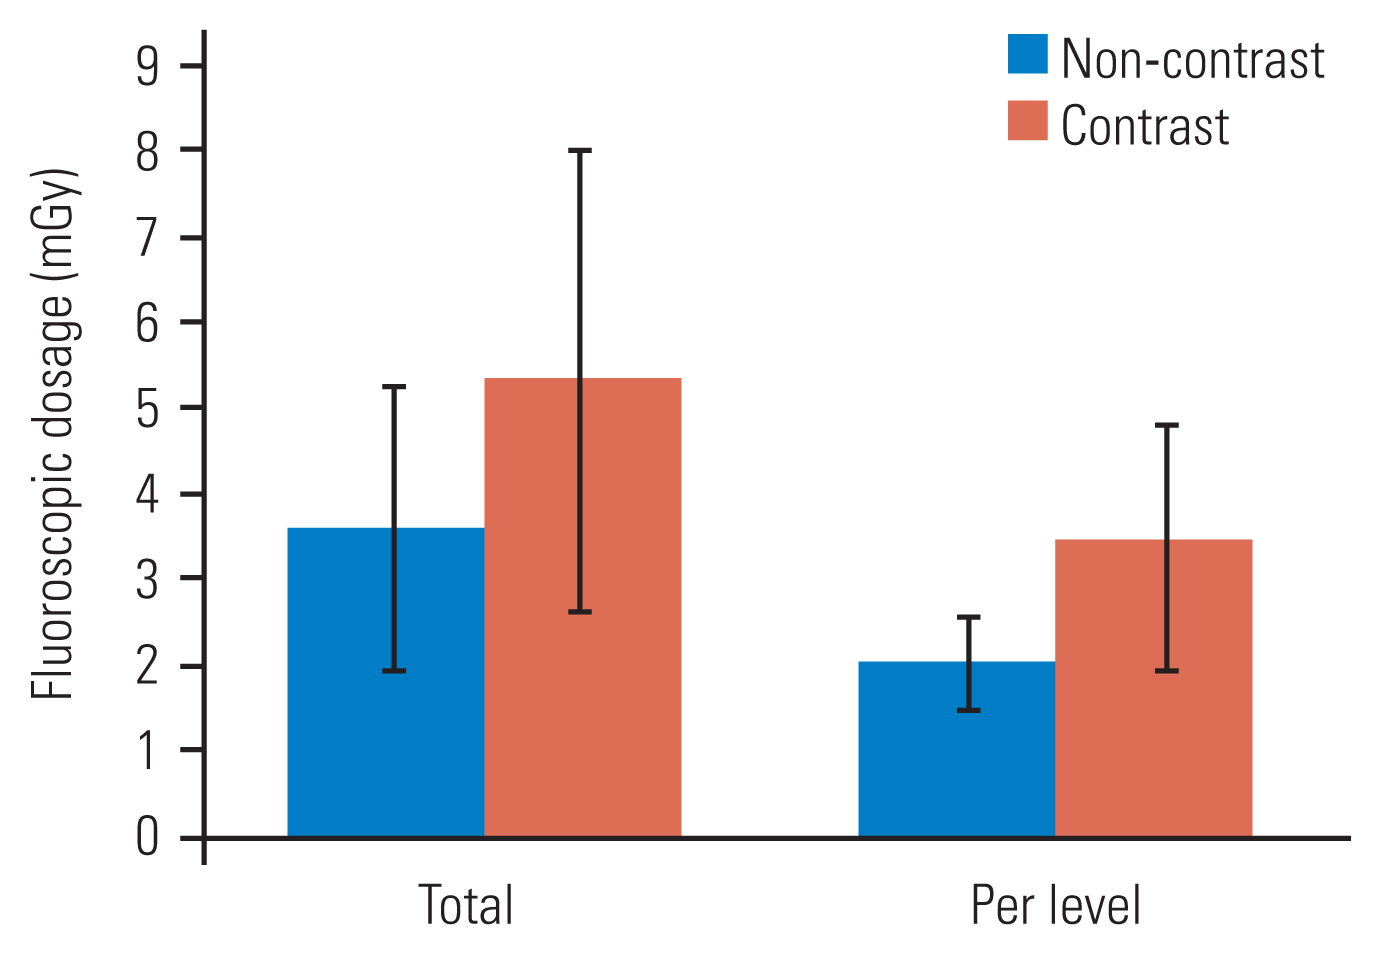
The graph shows the dose of radiation used in both groups (mGy).
Discussion
From our study on patients with radiculopathy, transforaminal ESIs resulted in a significant reduction of approximately 50% in pain (NRS) and an improvement in functional score (ODI) of about 17 units. These effects were observed to last for up to 2 months after the procedure in both experimental groups. Our results are consistent with Vad et al. [20], who found that TFESI can reduce pain from a mean score of NRS 8.8 to 1.6 and improve functional score within 6 weeks after the procedure. Ghahreman et al. [21] also reported successful use of a combination of triamcinolone and bupivacaine injection via the TFESI technique. After 1 month of evaluation, it was found that successful treatment, as determined by a reduction in pain of more than 50%, was achieved in 55% of patients. Ackerman and Ahmad [5] examined three techniques of ESI: caudal, interlaminar, and transforaminal. After using the transforaminal approach, the level of pain assessed at 2, 6, and 12 weeks following the procedure was significantly lower compared to the other two techniques, with a p-value of 0.0016. An improved functional score was observed for up to 24 weeks following the procedure. This study, such as many others, replicates the finding that radiculopathy symptoms significantly decrease after ESIs [6].
Demographic data from both experimental groups did not show any statistically significant difference. Both groups showed a clinically significant reduction in pain. There is a significant reduction in pain, as evaluated by NRS, in the contrast group when compared to the non-contrast group at 5 minutes post-procedure (3.39±1.54 versus 3.86±0.72, with a p-value of 0.039).
One hypothesis suggests that contrast enhances the visualization of pathology, leading to improved accuracy of steroid injections. Pfirrmann et al. [10] investigated the distribution of contrast after its administration and categorized three groups based on their characteristics. It was found that the patient experienced pain stimulation 15 minutes after the procedure in the intra-epineural distribution, which was followed by a decrease in pain. However, in the extra-epineural and paraneural areas, the patient experienced a reduction in pain immediately after the procedure. This aligns with our research and the observed pattern of contrast distribution beyond the nerve sheath and surrounding tissues, which may account for the immediate pain reduction following the procedure. There is no difference in pain reduction between the groups at 2 hours and 2 weeks. However, after 2 months, the group that did not receive contrast showed a lower pain score (3.2±0.86 versus 3.55±1.11). However, this difference is not statistically significant (p-value of 0.059).
The most frequently occurring anatomical site of radiculopathy, as per data collection, is levels L3–L5 (30.8%), followed by L4–L5 (27.4%). The most common diagnosis is spinal stenosis (81.4%), which is consistent with prior research [1,6]. This study offers epidemiological insights into potential treatment options for individuals with multilevel radiculopathy.
In our study, we used a C-arm fluoroscopy machine to guide and confirm the needle’s placement before administering the injection. Windsor et al. [22] state that during epidural injection procedures, patients face a minimal risk of exposure to harmful radiation levels. This risk is further reduced when a digital fluoroscopy machine is used. In our study, patients who did not receive contrast had a significantly lower radiation exposure dose compared to those who did receive contrast (2.00±0.52 mGy/level versus 3.45±1.36 mGy/level, p<0.0001). The levels of radiation were similar to those in previous studies. Jung et al. [23] collected data on the radiation dosage utilized in TFESIs of the lumbar spine with C-arm fluoroscopy and found that the mean radiation dose used per level was between 2.29–3.36 mGy.
Fishman et al. [24] provided three recommendations for healthcare personnel during X-ray procedures: (1) maintain a maximum distance between personnel and the X-ray tube, (2) minimize the duration of fluoroscopy usage, and (3) always wear appropriate X-ray protective clothing. Arnstein et al. [25] conducted an experiment to investigate the safety distances required during the use of fluoroscopy. In the cadaveric study, it was found that the radiation intensity at a distance of 15 cm from the X-ray source was 100 times higher than that at a distance of 30 cm from the source. This radiation intensity is inversely proportional to the square of the distance from the source. At a distance of 2 meters or 6 feet from the radiation source, it was found that the radiation intensity is only 0.025% of that at the collimator. Therefore, it is safe for healthcare personnel to be present during the procedure [26,27].
The non-contrast group had a significantly shorter procedural duration compared to the contrast group (20.96 minutes versus 23.73 minutes, p=0.002). After taking into account the number of lumbar levels being treated, it was calculated that there is a difference of 4 minutes per lumbar level between the two groups, which equates to approximately 25% of the total operation time. Hence, it is advisable to opt for non-contrast ESIs for patients at high risk, as this reduces the duration of their prone position.
The administration of contrast media during ESI can lead to serious adverse effects, including anaphylactic shock in patients with allergies to contrast agents and contrast-induced acute kidney injury in patients with pre-existing renal conditions [28]. Furthermore, our study suggests that performing ESI without contrast media leads to decreased radiation exposure and shorter operation time for patients.
Complications from TFESIs are rare [29], occurring in up to 0.1%–1% of all procedures [22]. The most common complications include infection, hematoma, intravascular injection, and dural injection. The drawback technique was used in this study to verify the needle’s placement before administering the injection, in order to prevent intravascular and intradural injections [30]. Katayama et al. [31] collected data on 168,363 patients who were administered non-ionic iodinated contrast media and found that only 0.04% of the patients experienced complications that required further management. Wolf et al. [32] conducted a study on 7,170 patients who used Iohexol-300 and found that the complication rate was 0.11%. In our study, we did not observe any complications in either group. This may be because of our limited sample size.
This study had some limitations. The position of a needle can be confirmed through radiography if provocative pain is recognized. However, confirming the delivery of an injected drug into the epidural space requires the use of contrast media. Furthermore, we monitored the patient for a period of 2 months after the surgery, which did not provide evidence of a lasting outcome. According to the proposed design, it may exhibit selective bias. Further studies with randomized controlled designs should be considered.
Conclusions
Out of the 118 patients who underwent TFESI for radiculopathy, there were no significant statistical differences in the improvement of pain score (NRS) and functional score (ODI) between the group that received contrast and the group that did not receive it. The operation time for the group that did not use contrast was approximately 4 minutes shorter. Additionally, there was a 40% reduction in the use of fluoroscopy when contrast was not used. No complications were observed with either technique.
Notes
Conflict of interest
No potential conflict of interest relevant to this article was reported.
Author Contributions
Conceptualization: RA, TS, PM, KS, WP; data curation: TS, KS, RA; formal analysis: PM, WP; methodology: PM, RA; project administration: RA; visualization: WP, WL; writing–original draft: WP, WL; writing–review & editing: WP, RA; and final approval of the manuscript: all authors.