Electromyographic Discrepancy in Paravertebral Muscle Activity Predicts Early Curve Progression of Untreated Adolescent Idiopathic Scoliosis
Article information

Abstract
Study Design
This study adopted a prospective cohort study design.
Purpose
This study aimed to examine electromyogram (EMG) discrepancy in paravertebral muscle activity and scoliosis progression, determine how vertebral morphology and EMG discrepancy evolve during scoliosis progression, and identify differences in EMG activity between individuals with and without adolescent idiopathic scoliosis (AIS).
Overview of Literature
Higher EMG activity is observed in the convex side of scoliotic curves, but not in populations without scoliosis, suggesting that higher EMG activity is a causative factor for curve progression.
Methods
In this study, 267 matched pairs of AIS and controls were recruited. The participants underwent EMG measurements at their first presentation and did not receive any treatment for 6 months at which point they underwent EMG and radiographs. Early curve progression was defined as >5° in Cobb angle at 6 months. The root mean square of the EMG (rms-EMG) signal was recorded with the participants in sitting and back extension. The rms-EMG ratio at the upper end vertebrae, apical vertebrae (AV), and lower end vertebrae (LEV) of the major curve was calculated.
Results
The rms-EMG ratio in the scoliosis cohort was high compared with that in the controls (sitting: 1.2±0.3 vs. 1.0±0.1, p<0.01; back extension: 1.1±0.2 vs. 1.0±0.1, p<0.01). An AV rms-EMG ratio in back extension, with a cutoff threshold of ≥1.5 in the major thoracic curve and ≥1.3 in the major lumbar curve, was a risk factor for early curve progression after 6 months without treatment (odds ratio, 4.1; 95% confidence interval, 2.8–5.9; p<0.01). Increases in side deviation (SD) (distance between the AV and the central sacral line) were related to a higher rms-EMG ratio in LEV of the major thoracic curve (baseline: rs=0.2, p=0.03; 6 months: rs=0.3, p<0.01).
Conclusions
An EMG discrepancy was detected in the scoliosis cohort, which was related to increases in SD in the major thoracic curve. The AV rms-EMG ratio in back extension was correlated with curve progression after 6 months of no treatment.
Introduction
Pre-existing vertebral rotation may predispose the human spine to idiopathic scoliosis [1]. Therefore, paraspinal muscles play a crucial role in maintaining spinal alignment. Adolescent idiopathic scoliosis (AIS) is a three-dimensional spinal deformity affecting up to 4% of adolescents globally, predominantly female adolescents [1]. AIS is characterized by lateral spinal deviation of ≥10° (Cobb angle), which is associated with vertebral deformity and sagittal hypokyphosis [2,3]. Although the progression of spinal curves is multifactorial, including biomechanical [4], sensorimotor [5], genetic [6], hormonal [7], and environmental factors [8], the etiopathology of AIS remains elusive.
The asymmetry of the paravertebral muscles has been recognized as a potential factor affecting the onset and progression of AIS [4]. Multiple studies examining paraspinal electromyographic (EMG) activity have indicated that patients with AIS exhibited higher EMG activity on the curve convexity, in which researchers believe that the increased muscle activity is because of muscle fatigue and others believe that muscle activity is increased to move the spine to a neutral position [9]. Moreover, the findings of cohort studies using bracing as treatment did not reflect the natural course of scoliosis progression but indicated the effects of treatment [10,11]. Because treatment options depend on the cause of muscle changes, a better understanding of the functions of paraspinal muscles in AIS is necessary to improve treatment selection and the prediction of curve progression.
In this study, the participants received no treatment for 6 months. We tested three hypotheses: (1) discrepancies in EMG findings prospectively predict the curve progression 6 months after accounting for other potential predictors; (2) discrepancies in EMG findings for the paravertebral muscle evolve with vertebral morphological deformities caused by scoliosis progression, and (3) girls with AIS exhibit a more pronounced discrepancy in EMG findings than controls.
Materials and Methods
1. Study design
This prospective cohort study recruited participants at their first presentation at our spine clinic between July 2021 and June 2023. The inclusion criteria were as follows: (1) individuals diagnosed with AIS with a Cobb angle ranging from 10° to 50° (scoliosis cohort); (2) those aged between 10 and 17 years; (3) those with skeletal immaturity characterized by a Risser stage of <5; (4) those without history of spine-related treatment; (5) age-matched girls with a Cobb angle of <10° (non-scoliosis cohort); and (6) those who provided consent to refrain from receiving spine-related treatment during the 6-month follow-up period (scoliosis cohort). The exclusion criteria were as follows: (1) individuals diagnosed with diseases other than AIS; (2) those with a history of any treatment for scoliosis, including orthotics, chiropractic treatment, physiotherapy, spinal traction, and traditional Chinese therapies, such as massage, and acupuncture, to avoid confounders due to interventions; and (3) those experiencing backache at the beginning of the study to avoid back pain effects on EMG activity. To account for any potential interventional confounders during the 6-month follow-up period, an online survey was sent to the participants or their legal guardians biweekly to record the frequency of each confounding event.
After screening the eligibility of 800 adolescents, 232 with AIS, and 34 controls were excluded. In this study, 534 girls (AIS: n=267; age-matched non-scoliosis controls: n=267) met the inclusion criteria and thus were included (Fig. 1).
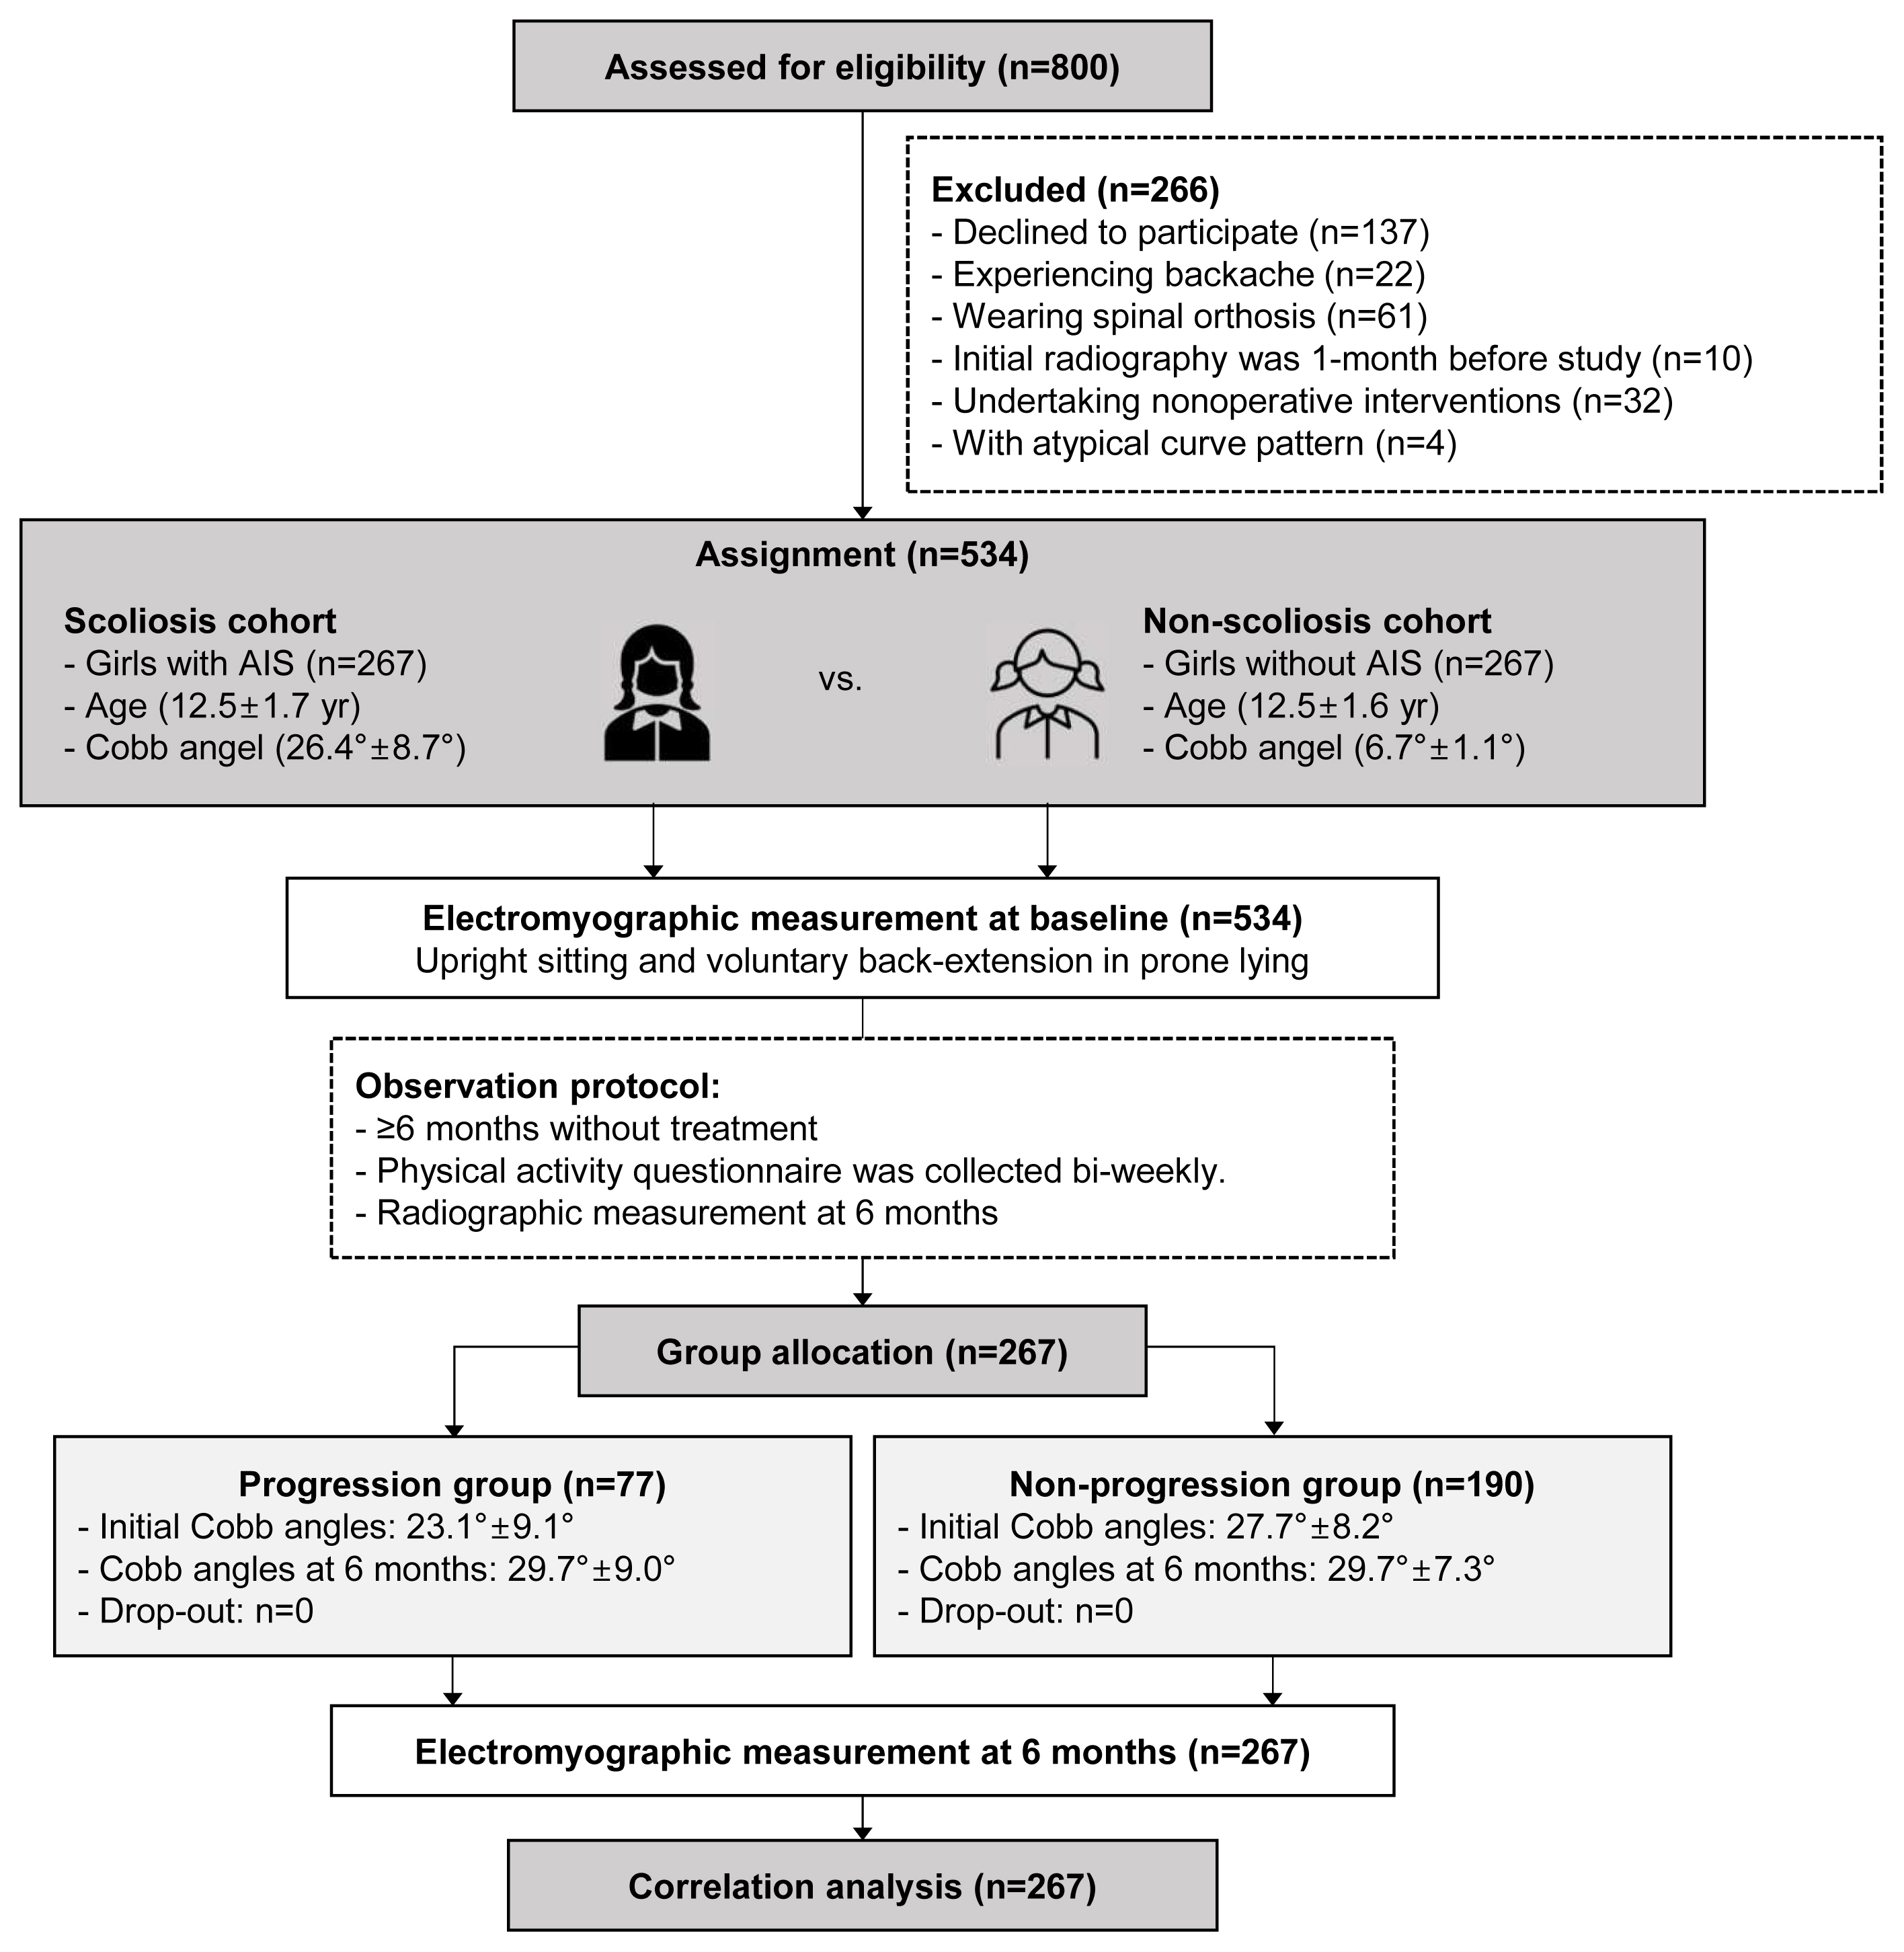
Study flow chart. AIS, adolescent idiopathic scoliosis.
2. Electromyographic measurements
Surface EMG activity of paravertebral muscles, namely, erectors, and latissimus dorsi, was recorded using six pairs of bipolar electrodes (1 cm in diameter with spacing of 2.0 cm; Noraxon USA Inc., Scottsdale, AZ, USA). To reduce skin impedance, a skin area of 5×5 cm2, located 3 cm horizontally from the spinal process on bilateral paravertebral muscles at the upper end vertebra (UEV), apical vertebra (AV), and lower end vertebra (LEV) of the major curve, was shaved, cleaned with alcohol, and abraded with sandpaper. For the non-scoliosis controls, electrodes were located 3 cm horizontally from the spinal process of the 7th/12th thoracic and the 3rd lumbar vertebrae [12]. The recorded EMG signals were pre-amplified, band-pass filtered (10–3,000 Hz), and sampled at a rate of 1,000 Hz. Paravertebral EMG signals were visually examined online and then converted from analog to digital formats for offline analysis. The root mean square of EMG (rms-EMG) was computed from all collected EMG data. The rms-EMG ratio (
Paravertebral EMG activity in the sitting position is related to curve progression in patients with thoracic scoliosis [10] and shows the greatest EMG asymmetry [13]. Additionally, leg discrepancy may affect the EMG activity of back muscles in patients with AIS during standing [12,13]. Therefore, in this study, the EMG activity in the sitting position was adopted to represent static muscle functions. Besides, truncal flexion and side bending were predominantly affected by spinal flexibility in addition to the stiffness of paraspinal muscles [14]. However, spinal flexibility and muscle stiffness are commonly examined using bending radiographic and ultrasonic measurement methods rather than electromyography. Considering that spinal flexibility and muscle stiffness were not tested in this study, flexion, and side-bending positions were not used to detect paravertebral EMG activities. Alternatively, back extension is a standardized postural task for recruiting spinal extensor muscles, which represents dynamic muscle functions and has been used in most EMG studies of AIS [15]. Considering the aforementioned reasons, paravertebral EMG activity was recorded under two test conditions: (1) upright sitting with the hips and knees flexed at 90°, the arms resting at the sides of the body, and the feet resting together (Fig. 2A); in this position, EMG activity was recorded for 1 minute, and the rms-EMG value was analyzed during the 1-minute detection time; (2) back extension in prone lying; this test consisted of five repetitions of active back extension for 5 seconds with the arms resting along the body and the hips extended (Fig. 2B). The rms-EMG values for all five repetitions were summed and analyzed.
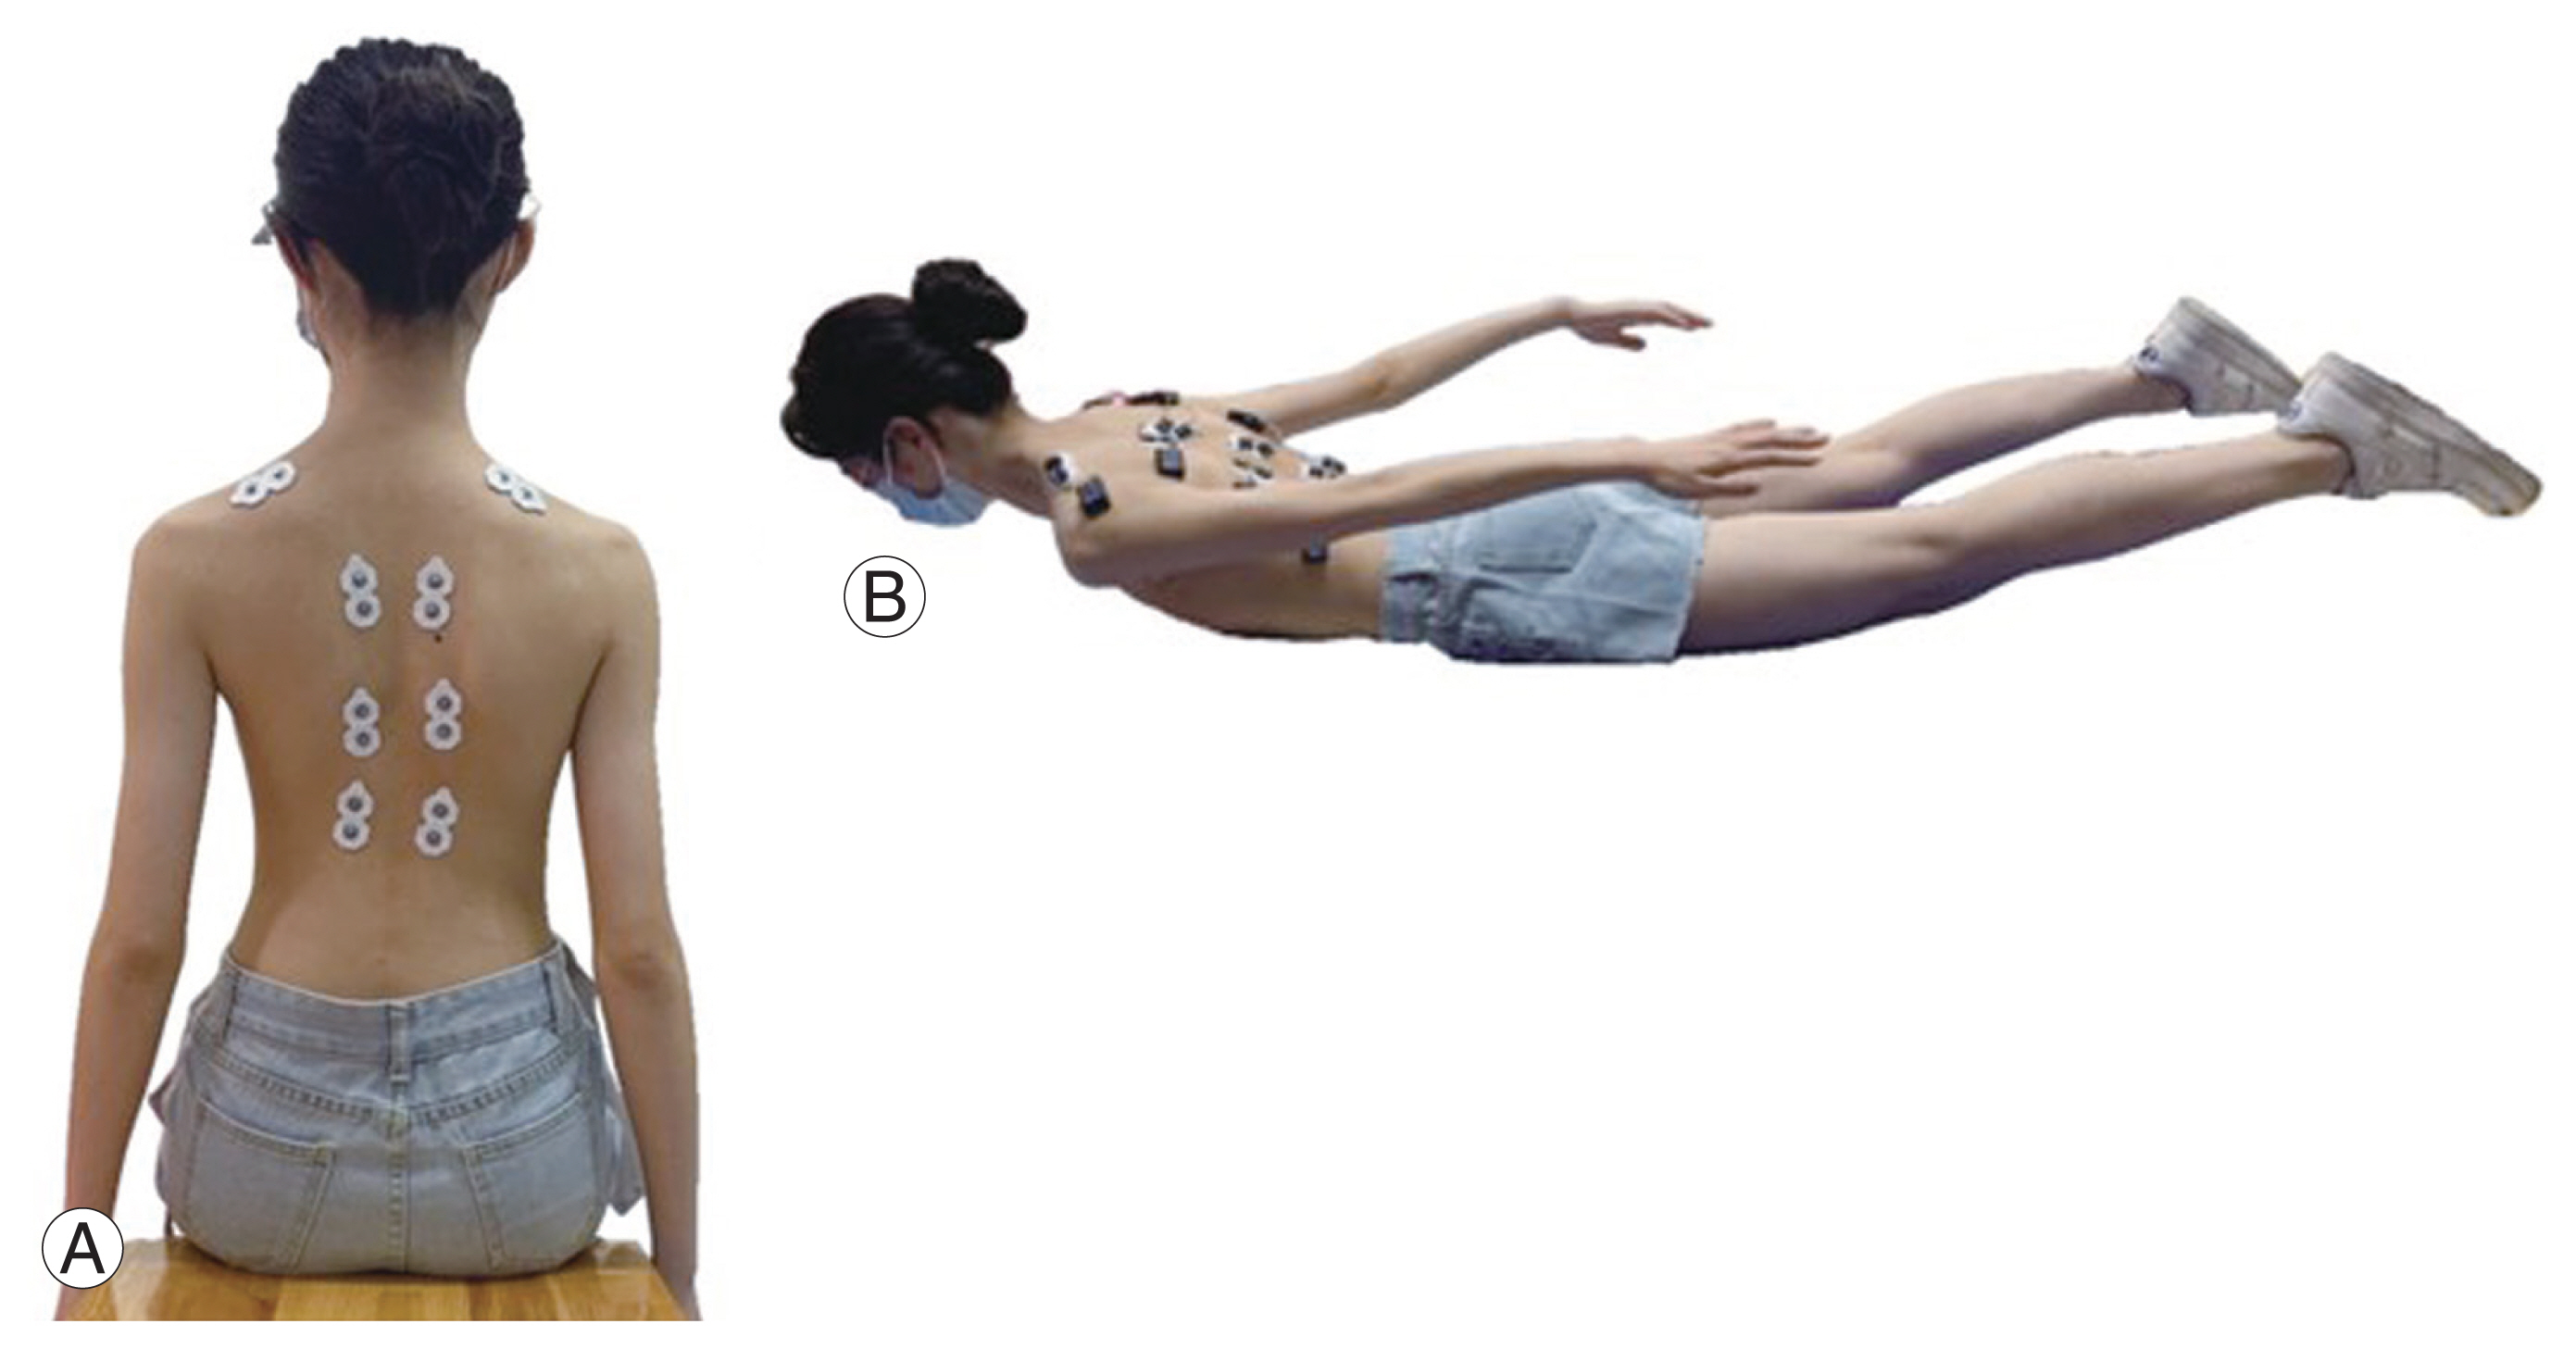
Electromyographic measurements: six pairs of bipolar electrodes located at the upper end vertebra, apex vertebra, and lower end vertebra of the major curve in the scoliosis cohort; electrodes located at the 7th/12th thoracic and the 3rd lumbar vertebrae in the non-scoliosis cohort. (A) Upright sitting with hip and knee flexed at 90°; arms on sides of the body with feet together. (B) Five repetitions of back extension for 5 seconds with arms along the body and legs extended.
Before data collection, a pilot study was conducted involving 26 participants with AIS and 26 without scoliosis (10% of the study cohort) to assess the reliability and reproducibility of EMG measurements. One trained investigator informed the participants regarding the experimental protocol before each test. The intraclass correlation coefficient (ICC) revealed excellent intrarater reliability for the rms-EMG value (sitting: ICC_convexity=1.00; p<0.001, ICC_concavity=1.00, p<0.01; back extension: ICC_convexity=0.98; p<0.001, ICC_concavity=0.97, p<0.001).
3. Radiographic measurements
Whole-spine radiographs with the participants standing and their arms abducted at the sides were obtained to evaluate the curve magnitude at baseline and 6-month follow-up. Two spine surgeons who were blinded to the study outcomes measured the Cobb angle of the major curve, vertebral wedging, side deviation (SD), rotation of the AV, thoracic kyphosis (TK) (T5–T12)/lumbar lordosis (LL) (L1–L5), and Risser staging. Patients with a curve magnitude of ≥10° were included in the scoliosis cohort, whereas those with a curve magnitude of <10° were allocated to the non-scoliosis cohort. Apical rotation (AR) was measured at the major curve AV using the Nash and Moe system (graded as I to V) [16]. SD was determined as the distance between the center of AV and the central sacral line [17]. Apical wedging (AW) was determined as the ratio of the major curve AV between sides (
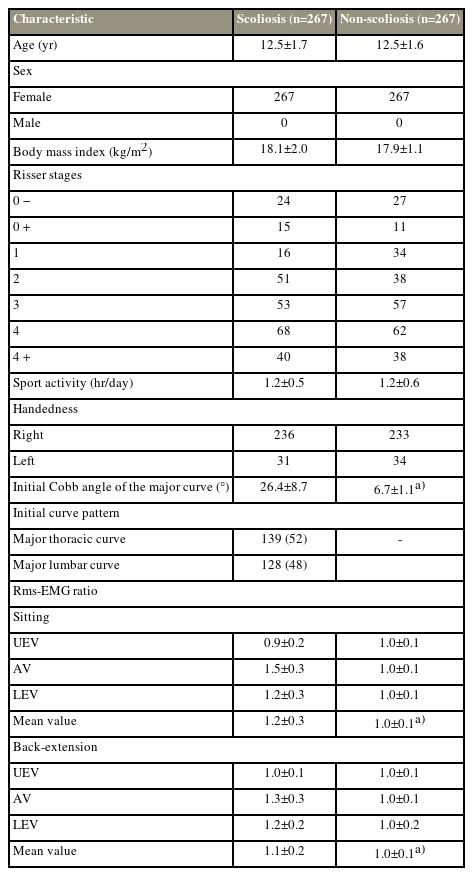
Participants’ characteristics at baseline
4. Ethical approval
This clinical trial was ethically approved by the ethic committee of the Hong Kong University–Shenzhen Hospital and prospectively registered online (reference number: ChiCTR2100050292). Written consent was obtained from the participants or their legal guardians before study initiation.
5. Sample size estimation
The primary objective of this study was to determine the associations between EMG activity and curve progression. The estimated progression rate (p) was set at 35% in sample size estimation according to a previous EMG study on AIS [11]. The number of events per variable (EPV) was set at 20. The failure rate (f) in data collection, such as dropouts at 6 months, was estimated to be 12%. Four features (k), namely, Risser staging, initial Cobb angle, curve pattern, and rms-EMG ratio, were used for covariate logistic regression analysis (n=[EPV×k/p]/[1–f]) [19]. Thus, 260 participants with AIS were required to detect the association between curve progression and each risk factor.
6. Statistical analysis
Descriptive statistics were calculated for baseline demographic, electromyographic, and radiographic data. Normality was tested before statistical analyses. Continuous variables, namely, body mass index (BMI), sport intensity (hours per day), Cobb angle, TK/LL, and rms-EMG ratio, were compared using the t-test or Mann-Whitney U test between the cohorts/groups at baseline and the 6-month follow-up. Categorical variables, namely, handedness, curve pattern, and AR, were examined at baseline using the r2 test. Confounders during the 6-month follow-up, namely, age, BMI, handedness, sport intensity, and orthoses, were adjusted using the propensity score method to balance the observed characteristics across the groups. Risser staging, curve pattern, and initial Cobb angle were considered together with the rms-EMG ratio in the covariate logistic regression analysis.
If the paravertebral rms-EMG ratio, recorded in either sitting, or back extension, differed between the groups, and was significantly correlated with curve progression, receiver operating characteristic (ROC) curve analysis and Youden’s index were used to determine the threshold of the rms-EMG ratio that would indicate early curve progression at 6 months. Intragroup analysis was performed to examine the correlation between the rms-EMG ratio and each radiographic parameter.
Data were analyzed using IBM SPSS ver. 27.0 (IBM Corp., Armonk, NY, U.S.A.). Significance was set at a two-tailed level of 0.05. The 95% confidence intervals (CIs), odds ratios (ORs), and area under the curve (AUC) values were reported where appropriate.
Results
1. Adolescent idiopathic scoliosis versus non-scoliosis at baseline
No significant differences in age, BMI, and sport intensity were observed between the AIS and control groups at baseline (Table 1). The initial Cobb angle of the major curve was 26.4°±8.7° in the scoliosis cohort and 6.7°±1.1° in the non-scoliosis cohort. In the scoliosis cohort, an increased rms-EMG ratio was observed at AV and LEV but not at UEV, regardless of testing postures (sitting: AV [1.5±0.3 versus 1.0±0.1, p<0.01]; LEV [1.2±0.3 versus 1.0±0.1, p<0.001], voluntary back extension: AV [1.3±0.3 versus 1.0±0.1, p<0.01], LEV [1.2±0.2 versus 1.0±0.1, p<0.001]) (Table 1). In the scoliosis cohort, intragroup analysis revealed that a greater SD was detected in participants with a major thoracic curve (major T: 26.4±1.2 mm versus major L: 16.2±1.3 mm, p<0.001) and related to a higher rms-EMG ratio at LEV (rs=0.2, p=0.03). No association was found between the rms-EMG ratio and AR, AW, thoracic kyphosis, or lumbar lordosis at baseline.
2. Progression versus non-progression radiographic outcomes
Seventy-seven participants (29%) with curve progression (an increase in Cobb angle of 6.6°±0.9° at 6 months) were allocated to the progression group; of the 77 participants, 37 had a major thoracic curve and 40 had a major lumbar curve. Furthermore, 190 participants with AIS (71%) without curve progression (changes in the Cobb angle of 2.0°±2.3°) were allocated to the non-progression group; of the 190 participants, 102 had a major thoracic curve and 88 had a major lumbar curve. The curve pattern remained unchanged at 6 months. Increases in SD and a decrease in TK were detected with curve progression (Table 2). The intragroup analysis suggested a weak correlation between the rms-EMG ratio in sitting at AV or LEV (LEV: baseline: rs=0.2, p=0.03; 6 months: rs=0.3, p<0.01) (AV: baseline: rs=0.2, p=0.03; 6 months rs=0.3, p<0.001) and increases in SD (38±10.1 mm versus 42±8.8 mm, p<0.01) for participants with a major thoracic curve; however, this correlation was not observed in those with a major lumbar curve.

Radiographic and electromyographic parameters of the scoliosis cohort
3. Electromyographic measurements
A significant difference in the rms-EMG ratio at the AV in back extension, either detected at baseline, or the 6-month follow-up, was observed between the groups, and it showed a moderate correlation (rs=0.6, p<0.01) with the changes in Cobb angle after 6 months (Table 2, Fig. 3). In the progression group, the rms-EMG ratio at the AV was consistently high in either sitting or back extension at baseline (1.7±0.4 versus 1.7±0.3, p=0.9) and decreased in back extension at the 6-month follow-up (1.8±0.3 versus 1.7±0.2, p<0.01) (Fig. 4). In the non-progression group, this ratio was consistently low in back extension at either baseline (1.5±0.3 versus 1.1±0.2, p<0.01) or the 6-month follow-up (1.4±0.2 versus 1.1±0.2, p<0.01) (Fig. 4). Thus, progressive cases differed from nonprogressive ones in terms of the rms-EMG ratio at the AV in back extension at baseline in this study cohort. Covariate logistic regression analysis revealed that the baseline rms-EMG ratio of the AV in back extension significantly was correlated with a curve progression of >5° after 6 months of no treatment (Table 3). The adjusted regression with the propensity score method showed that a higher baseline rms-EMG ratio at the AV in back extension was related to early curve progression at the 6-month follow-up (OR, 2.1; 95% CI, 1.7–2.6; p<0.01). ROC curve analysis revealed that using the baseline rms-EMG ratio at the AV in back extension has good to excellent accuracy (major T with AUC of 96%, major L with AUC of 90%) in predicting curve progression at 6 months (Fig. 5). The maximum Youden’s index value was 0.79 (sensitivity: 0.87 and specificity: 0.92) at the cutoff of 1.5 for the major T and 0.67 (sensitivity: 0.82 and specificity: 0.84) at the cutoff of 1.3 for the major L. Thus, 1.5 (major T) and 1.3 (major L) times higher rms-EMG at the AV in back extension on the major curve convexity were considered the best threshold to predict early curve progression at 6 months.
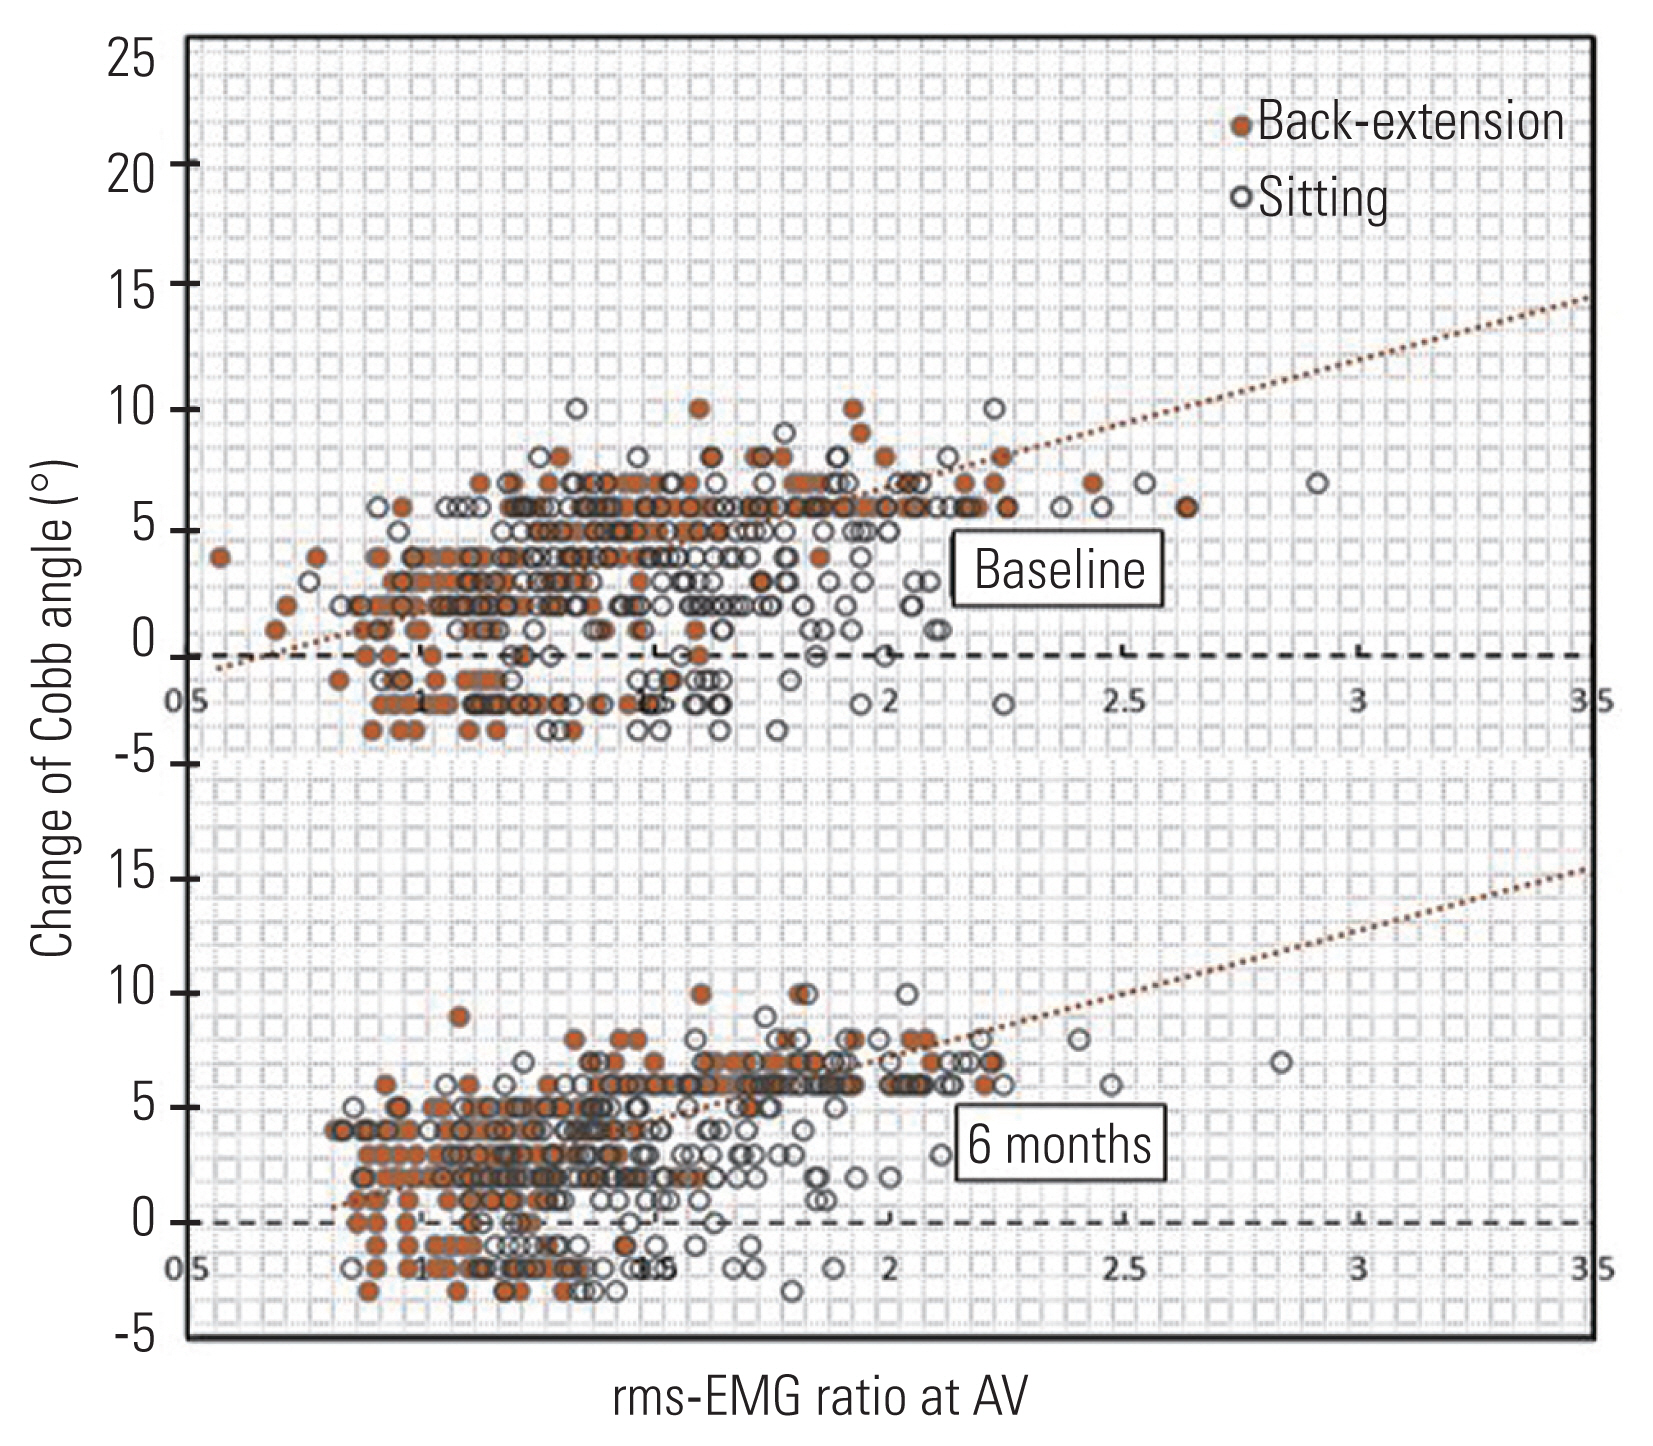
Correlation analysis between the apical vertebrae (AV) root mean square of electromyogram (rms-EMG) ratio and the changes of Cobb angle after 6 months without treatment.

Intragroup analysis of the root mean square of electromyogram (rms-EMG) ratio at the apical vertebrae (AV) in sitting and back extension. **p<0.01 (significant difference). ***p<0.001 (significant difference).
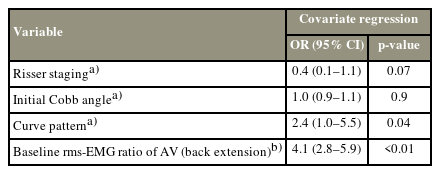
Correlation analysis between the curve progression and Risser staging, Cobb angle, curve pattern and EMG discrepancy
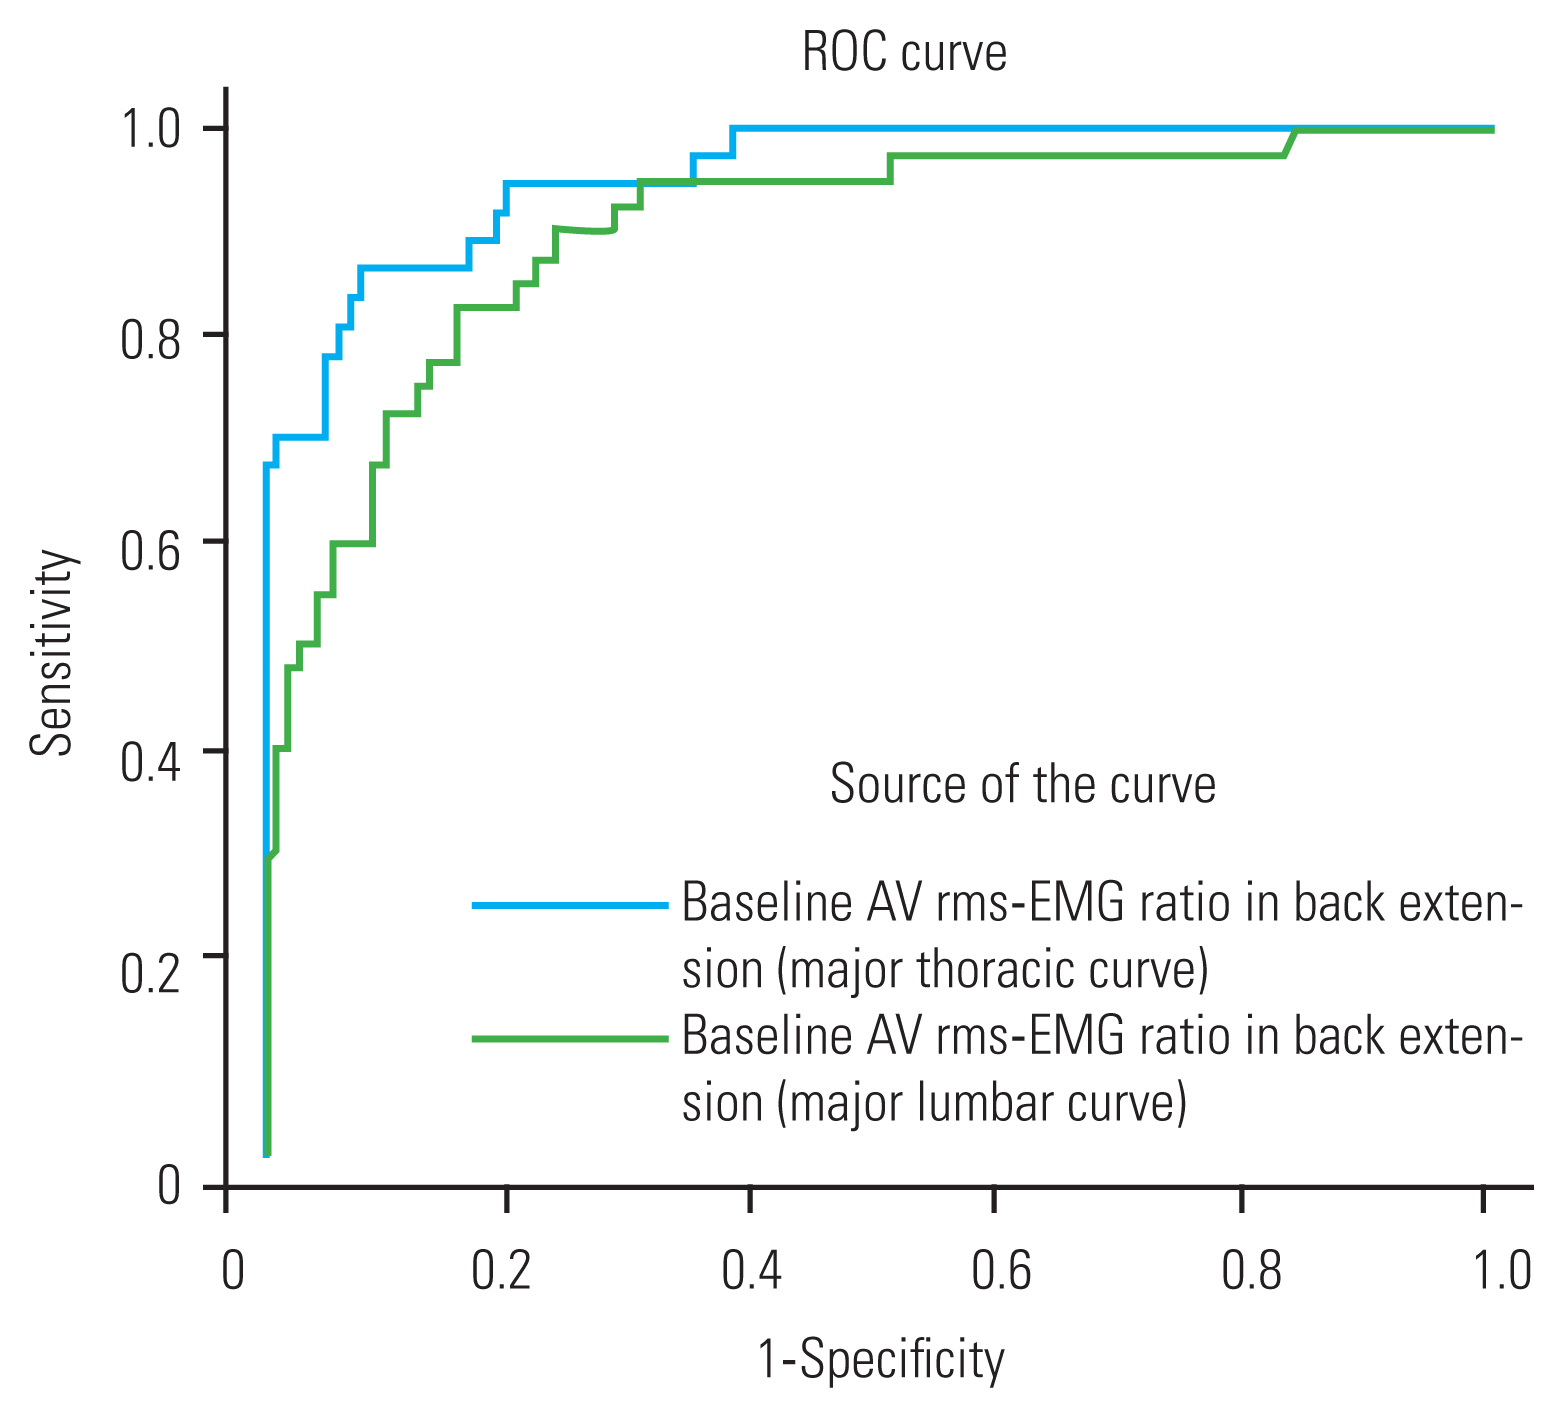
Receiver operating characteristic (ROC) curve analysis between the apical vertebrae (AV) root mean square of electromyogram (rms-EMG) ratio in back extension and the curve progression at 6 months.
Discussion
Although asymmetric paraspinal muscle activity is common in patients with AIS, the association between EMG discrepancies and curve progression remains unclear [9]. Studies have demonstrated that patients in a progressive phase exhibited significantly greater baseline erector spinae muscle EMG activity on the convex side of the major curve [10,11,20]. However, patients in these studies were wearing orthoses that affected paravertebral EMG signals [10,20]. Thus, these studies did not address the relationship between paraspinal muscular asymmetry and curve progression among individuals with untreated AIS. This study fills this knowledge gap by revealing that the rms-EMG ratio at the AV of the major curve predicted early curve progression after 6 months of no treatment.
We observed a discrepancy in the EMG activity of paravertebral muscles in participants with AIS in either sitting or back extension. Additionally, we determined that 1.3–1.5 times higher rms-EMG activity at the AV in back extension predicted early curve progression. Studies have suggested that asymmetrical EMG activity of the paraspinal erector spinae in the standing position predicted curve progression [10,20]. Specifically, Cheung et al. [10] conducted a 2-year study involving 30 patients with right-sided thoracic curves. They determined that patients in a progressive phase exhibited significantly greater erector spinae muscle EMG activity at baseline on the convex side than those in a nonprogressive phase, indicating that muscle force imbalance causes curve progression [20]. The same research group examined 105 patients in a progressive phase and observed greater baseline erector spinae muscle EMG activity at the lower part of the curve convexity [10,11,20]. However, because these results were derived from the same population, they cannot be generalized to other cohorts. Thus, validating the findings in other cohorts is crucial to inform clinical practice. In this study, we included participants with both thoracic and lumbar curves. We showed that the rms-EMG ratio threshold that predicted curve regression can be generalized to the general female AIS population. Specifically, this study demonstrated that 1.3–1.5-times higher EMG activity in back extension on the convex side of the major curve predicted early curve deterioration at 6 months. This finding expands those of previous studies reporting that higher EMG activity was observed on curve convexity but without a defined threshold [9–11,20–25].
Studies have demonstrated asymmetry in EMG activity in patients undergoing treatment, such as bracing and postural training [10,20,26]. These interventions introduced confounding effects in data analysis. Specifically, bracing caused back muscle weakness [18,27] and exercise improved muscle endurance [28–31], both of which can affect paraspinal muscle EMG activity. Thus, these studies could not reveal the effect of paraspinal muscle activity on the natural course of curve progression. Moreover, these studies compared EMG at 1–2-year follow-up [10,11,20]. Early curve deterioration can happen during the long-term follow-up. Therefore, early detection of curve progression is crucial for patients requiring treatment. Our study filled this knowledge gap by examining the relationship between paravertebral EMG activity at baseline and after 6 months of no treatment. This approach provided a better understanding of the natural course of AIS from an electrophysiological perspective.
In this study, a significant asymmetry of paravertebral EMG activity was observed at the AV and LEV in the scoliosis cohort compared with that in the control group. This finding agrees with those of previous studies [10,11,20,24,26]. Our study had a superior methodology by ensuring age matching before cohort allocation, and the controls were confirmed to have Cobb angles of <10°. Moreover, covariates, such as sport intensity, and handedness, which affect EMG activity [32], were evenly distributed at baseline and statistically controlled in the regression analysis at 6 months. The observation of higher EMG activity on the curve convexity can be interpreted in two ways: muscle activity was stronger to correct curvature [25], or the muscle on the convex side was weaker and fatigued [33]. A study investigated muscle fiber distribution in AIS and found that a numerical predominance of type I muscle fibers on the curve convexity was strongly related to curve progression [34]. This finding may be attributed to secondary adaption because of a chronic high load. Our study demonstrated that the rms-EMG ratio at the LEV of the major thoracic curve was related to increases in SD. A larger SD implies poorer coronal balance and was related to side-deviated gravity loading in sitting and standing [35]. This finding implies that asymmetrical EMG activity was enhanced by chronic, side-deviated gravity loading in patients with truncal shift [11]. This was not observed for the major lumbar curve with a less truncal shift in this study, which reported that asymmetrical EMG activity was related to asymmetrical gravity loading. In the non-progression cohort, the rms-EMG ratio at the AV decreased in back extension compared with that in sitting, indicating that asymmetrical EMG was related to gravity loading but not to muscle contraction in nonprogressive cases. Thus, our findings concurred with the second illustration that muscles on the curve convexity were fatigued and therefore introduced EMG asymmetry. Besides, studies have reported that EMG activity is related to vertebral rotation [36]. However, our study did not observe such an effect, possibly because the cohorts in this study presented with only mild vertebral rotation, specifically grades I–II that did not progress at 6 months.
The main limitation of this study is the short-term observation of only 6 months. Thus, the applicability of our findings in the long-term requires further evaluation. However, no treatment in patients for longer periods would be unethical considering the risk of progression. Thus, we did not continue our study beyond 6 months. Furthermore, some predictors of progression were not included in our study analyses, such as curve flexibility [14,37,38]. Our findings suggested that a threshold of asymmetrical paravertebral EMG predicts early curve progression in girls with mild to moderate AIS. This information can be used by clinicians to identify high-risk teenagers for early treatment.
Conclusions
EMG discrepancies were observed in participants with AIS. An AV rms-EMG ratio in back extension of 1.5 for the major T and 1.3 for the major L predicts curve progression after 6 months of no treatment. Furthermore, a higher rms-EMG ratio at the LEV was related to greater SD of the major thoracic curve.
Acknowledgments
We thank patients for agreeing to the publication of this report.
Notes
Conflict of Interest
No potential conflict of interest relevant to this article was reported.
Author Contributions
Study design: JPYC, MKTT; manuscript draft and editing: YF, JPYC; measurement: GMK, EHKY; data analysis: RL; and all authors have read and approved the manuscript.
Funding
This study was supported by AO spine national research grant (AOSNR202207; funding receiver: Yunli Fan).