


Introduction
As the population aging, lumbar canal stenosis (LCS) has become the most reason for spinal interventions [1]. Although degenerative changes in the spine are often associated with the natural process of aging, these changes can result in spinal conditions such as degenerative LCS (DLCS) and spinal canal constriction. Although there is a wide range of spine degenerative changes such as the thickness of the ligamentum flavum (LF), intervertebral disc degeneration, facet joint osteoarthritis, and osteophytes, the thickness of LF is the main mechanical reason for the narrowing of the spinal canal [2,3]. It is well known that the increase in LF thickness is the end result of fibrosis, and it is the cause of the narrowing of the spinal canal that terminates at the DLCS. LF, which is a connective tissue, is normally composed of elastic and collagen fibers with 2:1 ratio [4]. Under the degenerative conditions of the spine, collagen fibers increase, while elastin fibers decrease in LF [5]. The increase of collagen fibers plays a very important role in the LF fibrosis [1]. The complex pathomechanism underlying the LF fibrosis due to these collagen accumulations remains unclear.
The discoidin domain receptors (DDRs) are cell surface receptor tyrosine kinases and are activated by collagen fibers [6]. There are two forms of these receptors, DDR1 and DDR2. The fibrillary collagens (types IтАУIII, V, and XI), which are involved in the pathogenesis of the LF fibrosis, are demonstrated binding to DDR1, whereas collagens II and X are known as the ligand of DDR2. The previous studies revealed that the interactions of the DDRs with collagen fibers play a crucial role in normal and pathological conditions such as fibrotic disease [7,8]. Moreover, previous study has shown that the inhibition of DDR, especially DDR1, led to decreased fibrosis in chronic kidney disease [8]. The zinc endopeptidases of the extracellular matrix, matrix metalloproteinase (MMPs), play a key role in the breakdown of collagen. It is widely known that aberrant expression of these genes is associated with the most severe forms of fibrosis. Moreover, MMPs have been extensively studied in LF fibrosis [9тАУ13]. Thus, we hypothesized that the association between DDRs and MMPs might be involved in LF fibrosis in DLCS patients.
In this study, patients with DLCS and lumbar disc herniation (LDH) were evaluated demographically, radiologically, and histologically. The fibrosis grades of the patients were determined from the LF samples and compared with the LF thickness. Using quantitative real-time PCR and Western blot analyses, the involvement of DDR1/DDR2 and MMPs (2, 3, 9, and 13) in LF fibrosis was examined at the same time.
Materials and Methods
All LF samples were taken from the patients that were performed the surgery for DLCS and LDH. Ethical approval for the experimental protocol of the presented study was obtained from the Human Ethics Review Committee of Trakya University (TUTF-BAEK 2019/358). All of the patients who took part in the study signed a written informed permission form. Our study comprised 35 patients (nine men and 26 women). DLCS was diagnosed in 23 of these individuals (five men and 18 women), and spinal surgery was performed in 23 of them (five men and 18 women). Twelve patients (male, n=4; female, n=8) with LDH were included in the control group. The exclusion criteria for both two groups were previous spine surgery, epidural injections, spine injury, spinal deformity like degenerative scoliosis, and presence of the tumor. For both DLCS and LDH patients, the diagnosis given primarily depends on the characteristic clinical features and neurological examination with suitable imaging features. For the DLCS group, we enrolled individuals with neurogenic claudication who had magnetic resonance imaging (MRI) that showed a narrowing of the spinal canal. On the other hand, the control groups (LDH patients) showed radiculopathy that was confirmed by neurological examination and radiologic abnormalities at specific LDH levels. None of the patients with LDH (control group) had degenerative changes on MRI.
1. Analyses of ligamentum flavum thickness
LF thickness was measured at the facet joint level, perpendicular to the border of the laminae within the axial T2-weighted MRI, as previously described with minimal modification [14]. We employed a manual cursor technique to measure the maximum thickness of the LF, which was determined automatically by the MRI scannerтАЩs loaded software. All measurements were taken in both directions. For statistical analysis, the greater value was accepted.
2. Histologic analyses
The LF tissues were fixed in 10% formalin solution (Sigma-Aldrich, St. Louis, MO, USA) for 48 hours at room temperature for histological evaluation. After the fixation phase was completed, the tissues were washed in tap water. They were passed through the rising alcohol series (70%, 90%, 96%, 100%) for the dehydration phase. The tissues were maintained in toluene for the transparency phase (Merck, Darmstadt, Germany). After the paraffinization phase, LF tissue samples were cut into paraffin blocks.
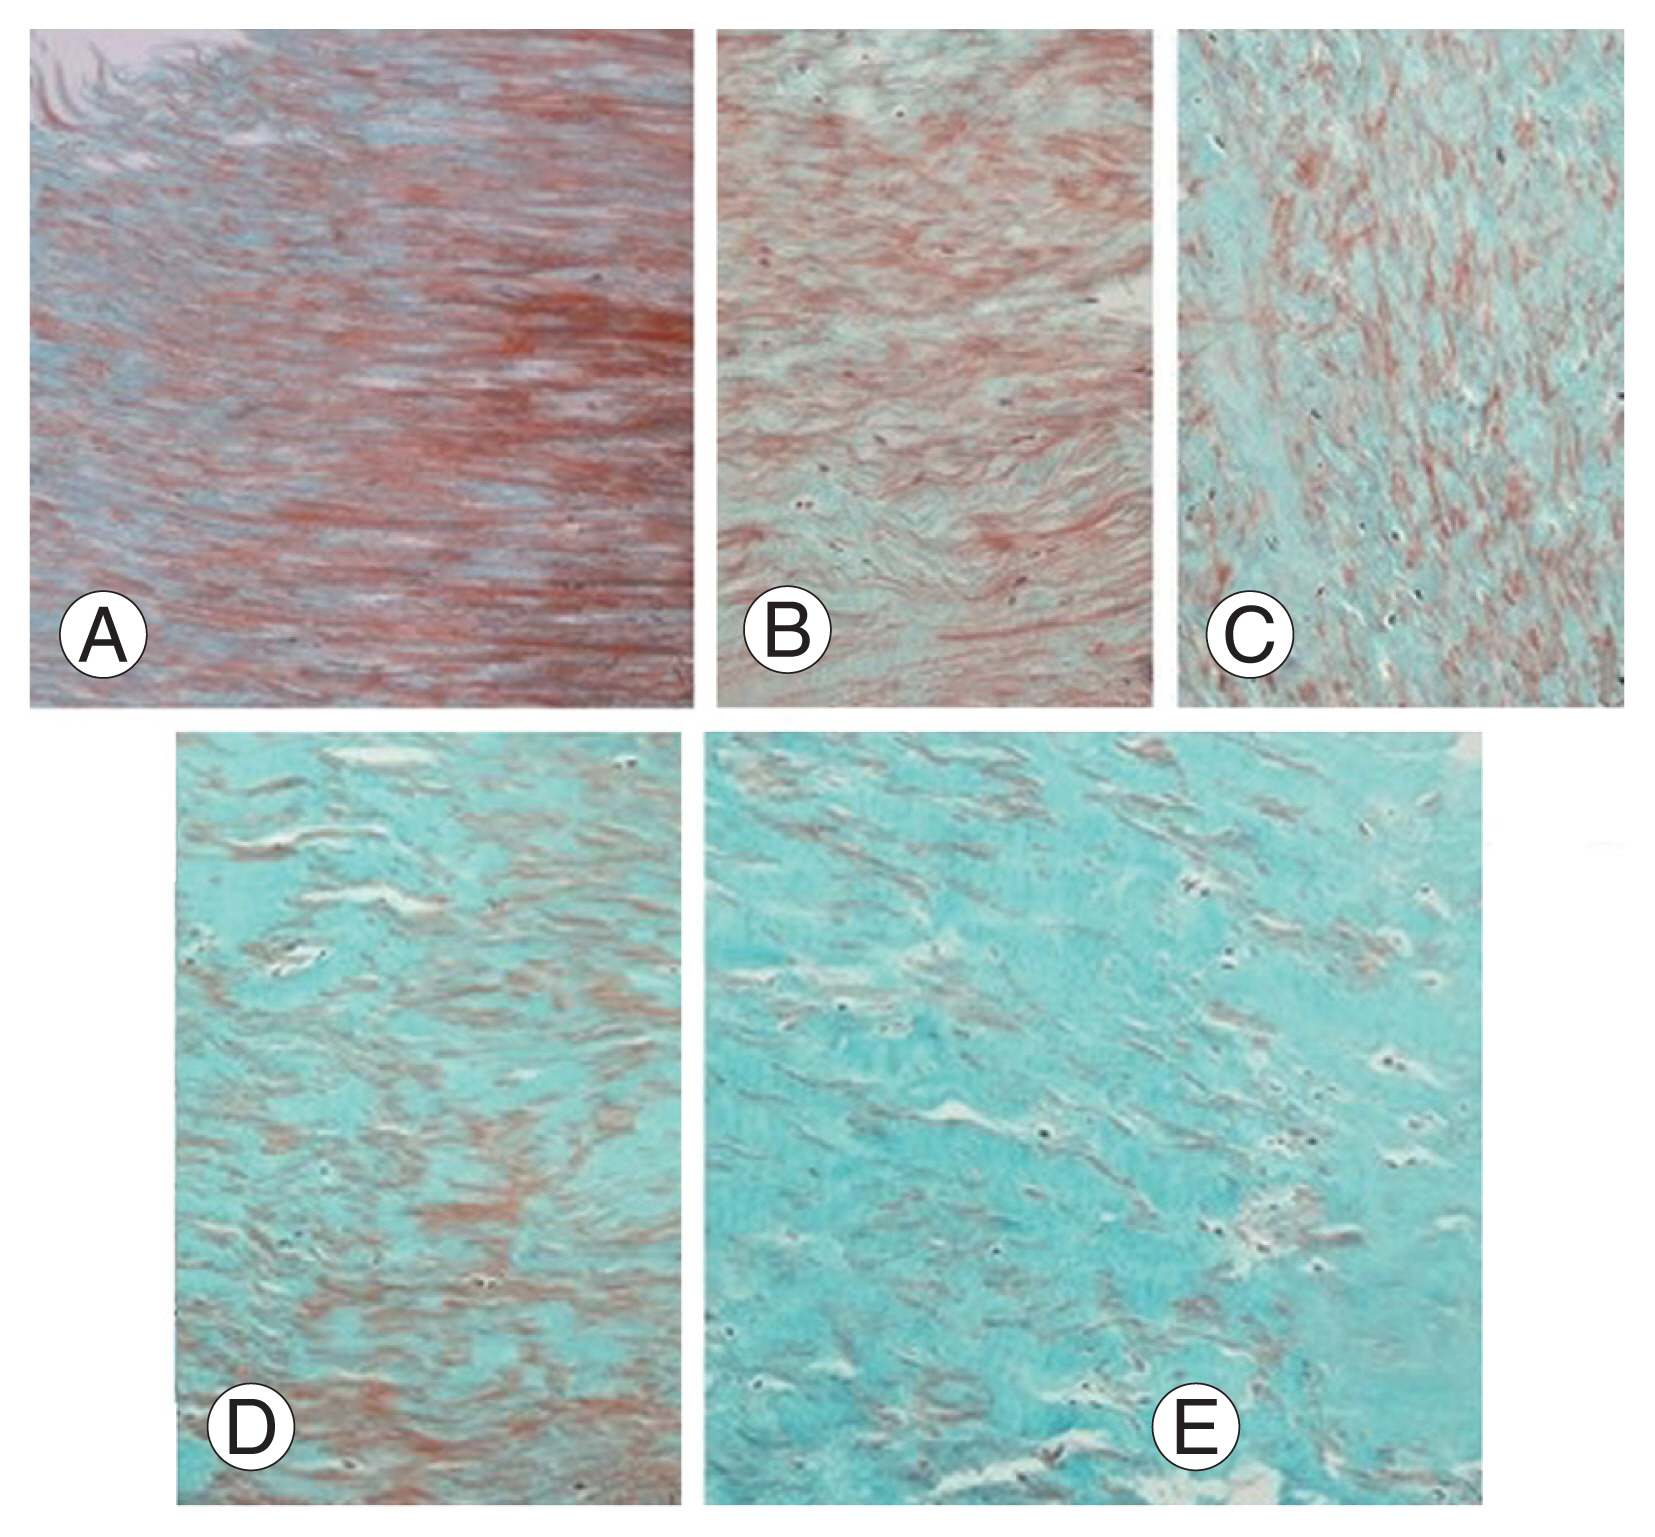
LF paraffin blocks were cut into 5 ╬╝m thick slices. To determine the histological structure properties of the LF tissue, it was stained with hematoxylin and eosin (H&E). In addition, Masson trichrome triple staining was used to show the severity of LF tissue fibrosis. H&E and Masson trichrome-stained preparations were examined under a light microscope (Olympus BX51; Olympus, Tokyo, Japan) and photographed at different magnifications (├Ч100, ├Ч200, and ├Ч400; Olympus DP20 microscopic digital camera system; Olympus). Masson trichrome-stained preparations (├Ч200 magnification) were used for each LF tissue section. Three measurements were performed using Imaging Analysis System to determine the severity of fibrosis (ver. 2.11.5.1; Camera-Argenit, Istanbul, Turkey). The average percentage was calculated. The severity of LF fibrosis was determined using the grading system of Sairyo et al. [2], which is based on the density of collagen in the tissue: grade 0: normal tissue without fibrotic zone; grade 1: tissue showing fibrosis in 25% or less of the entire area; grade 2: tissue showing 25% to 50% fibrosis; grade 3: tissue showing 50% to 75% fibrosis; and grade 4: tissue showing more than 75% fibrosis (Fig. 1).
3. Isolation of total RNA, cDNA synthesis, and quantitative real-time PCR analysis
Totally, 30- to 50-mg samples LF from each LDH and DLCS group and froze them in liquid nitrogen before powdering. Tissue powders from each sample were evenly divided into two 2 mL Eppendorf tubes for use in both RNA and protein extraction. The Trizol reagent (Thermo Fisher Scientific, Waltham, MA, USA) was used to isolate total RNA from tissue powders according to the manufacturerтАЩs instructions. The extracted RNA purity and concentrations were read using a micro-volume spectrophotometer (Optizen Nano Q; Mecasys, Daejeon, Korea). cDNA library was prepared from 500 ng cellular RNA in 20 ╬╝L of reaction volume using a High-Capacity cDNA Reverse Transcription Kit (Thermo Fisher Scientific). After reverse transcription, DDR1 (sense: 5тА▓-AAGGGACATTTTGATCCTGCC-3тА▓; antisense: 5тА▓-CCTTGGGAAACACCGACCC-3тА▓), DDR2 (sense: 5тА▓-CCAGTCAGTGGTCAGAGTCCA-3тА▓; antisense: 5тА▓-GGGTCCCCACCAG AGTGATAA-3тА▓), MMP2 (sense: 5тА▓-GATACCCCTTTGACGGTAAGGA-3тА▓; antisense: 5тА▓-CCTTCTCCCAAGGTCCATAGC-3тА▓), MMP3 (sense: 5тА▓-AGTCTTCCAATCCTA CTGTTGCT-3тА▓; antisense: 5тА▓-TCCCCGTCACCTCCAATCC-3тА▓), MMP9 (sense: 5тА▓-TACCCTATGTACCGCTTCAC-3тА▓; antisense: 5тА▓-GAACAAATACAGCTGGTTCC-3тА▓), MMP13 (sense: 5тА▓-TCCTGATGTGGGTGAATACAATG-3тА▓; antisense: 5тА▓-GCCATCGT GAAGTCTGGTAAAAT-3тА▓), and GAPDH (sense: 5тА▓-CGGAGTCAACGGATTT GGTCGTAT-3тА▓; antisense: 5тА▓-CAGAAGTGGTGGTACCTCTTCCGA-3тА▓) cDNA were amplified with Power Cyber Green Master Mix (Life Technologies, Carlsbad, CA, USA) in an Quant Studio 5 Real-Time PCR System (Life Technologies) as follows: 1 cycle of 2 minutes at 50┬░C and 10 minutes at 95┬░C followed by 42 cycles of denaturation at 95┬░C for 15 seconds and annealing and extension at 60┬░C for 1 minute. Relative expression levels were calculated by the 2-╬Ф╬ФCt method, and GAPDH mRNA was used as an internal control.
4. Western blot analysis
For protein isolation, tissue powders in each replicate were homogenized by a Daihan 15D tissue homogenizer (27,000 rpm) in 400 ╬╝L of RIPA Lysis Buffer (including 2 ╬╝L of PMSF, 2 ╬╝L of a sodium orthovanadate, and 2 ╬╝L of a protease inhibitor cocktail) (RIPA Lysis Buffer System, sc-24948; Santa Cruz, CA, USA) under ice-cold conditions. The lysate was centrifuged at 14,000 g for 20 minutes and in the range of 2.13тАУ3.17 mg/mL of total protein was detected by the protein A280 method with a micro-volume spectrophotometer (Optizen Nano Q; Mecasys). The protein level was measured using a Western blot assay and SDS-PAGE (sodium dodecyl sulfateтАУpolyacrylamide gel electrophoresis) electrophoresis, as described by Delen et al. [15] with two primary antibodies (DDR1 [NBP1-33134; Novus Biologicals, Littleton, CO, USA] and DDR2 [NBP2-14927; Novus Biologicals]) and normalized with a beta-actin antibody (NB600-503; Novus Biologicals). Protein quantities were determined with the ProteinQuant software and given as relative density.
5. Statistical analysis
According to the normalized test results in two-group comparisons, the Mann-Whitney U test was used to assess the DLCS group with their respective control groups in terms of gene expression, age, LF thickness, and fibrosis score levels. All data are shown as the mean┬▒standard deviation unless otherwise noted. The Pearson correlation test was conducted to see if there was a probable association between the two sets of data. The statistical analysis was done with the IBM SPSS ver. 20.0 software (IBM Corp., Armonk, NY, USA) at a significance level of pтЙд0.05.
Results
1. The LF fibrosis and thickness closely linked with DLCS
The mean age of DLCS and LDH patients was 59.43┬▒11.38 and 57.16┬▒8.11, respectively. There was no significant difference between the groups in terms of mean age (p=0.281). The mean measurements of LF thickness were 3.2┬▒0.3 ╬╝m and 5.06┬▒0.91 ╬╝m in the LDH and DLCS patients, respectively. LF thickness was higher in the DLCS patients than in the LDH patients. The mean grades of fibrosis were 1.6┬▒1.1 and 3.08┬▒0.5 in the LDH and DLCS patients, respectively. The fibrosis grade was higher in DLCS patients than in LDH patients. When the LF thickness and fibrosis grade were evaluated between groups, a significant difference (p<0.001) was found. There was also a positive correlation between LF thickness and the degree of fibrosis (p<0.001) (Table 1).
2. The histology of LF fibrosis
The LF tissue sections were stained with Masson trichrome triple staining for determining the grade of fibrosis histologically. In this way, elastic fibers were stained red, collagen fibers of connective tissue showing fibrotic areas green, and nuclei browned (Fig. 1). Grade 0 is classified as normal tissue without fibrotic zone (Fig.1A); grade 1 as tissue showing fibrosis in 25% or less of the entire area (Fig. 1B); grade 2 as tissue showing 25% to 50% fibrosis (Fig. 1C); grade 3 as tissue showing 50% to 75% fibrosis (Fig. 1D); and grade 4 as tissue showing more than 75% fibrosis (Fig. 1E). It was shown that elastic fibers decrease and collagen fibers increase gradually in the LF tissue (Fig. 1AтАУE).
3. Expression level of DDR1 and DDR2 in LF samples
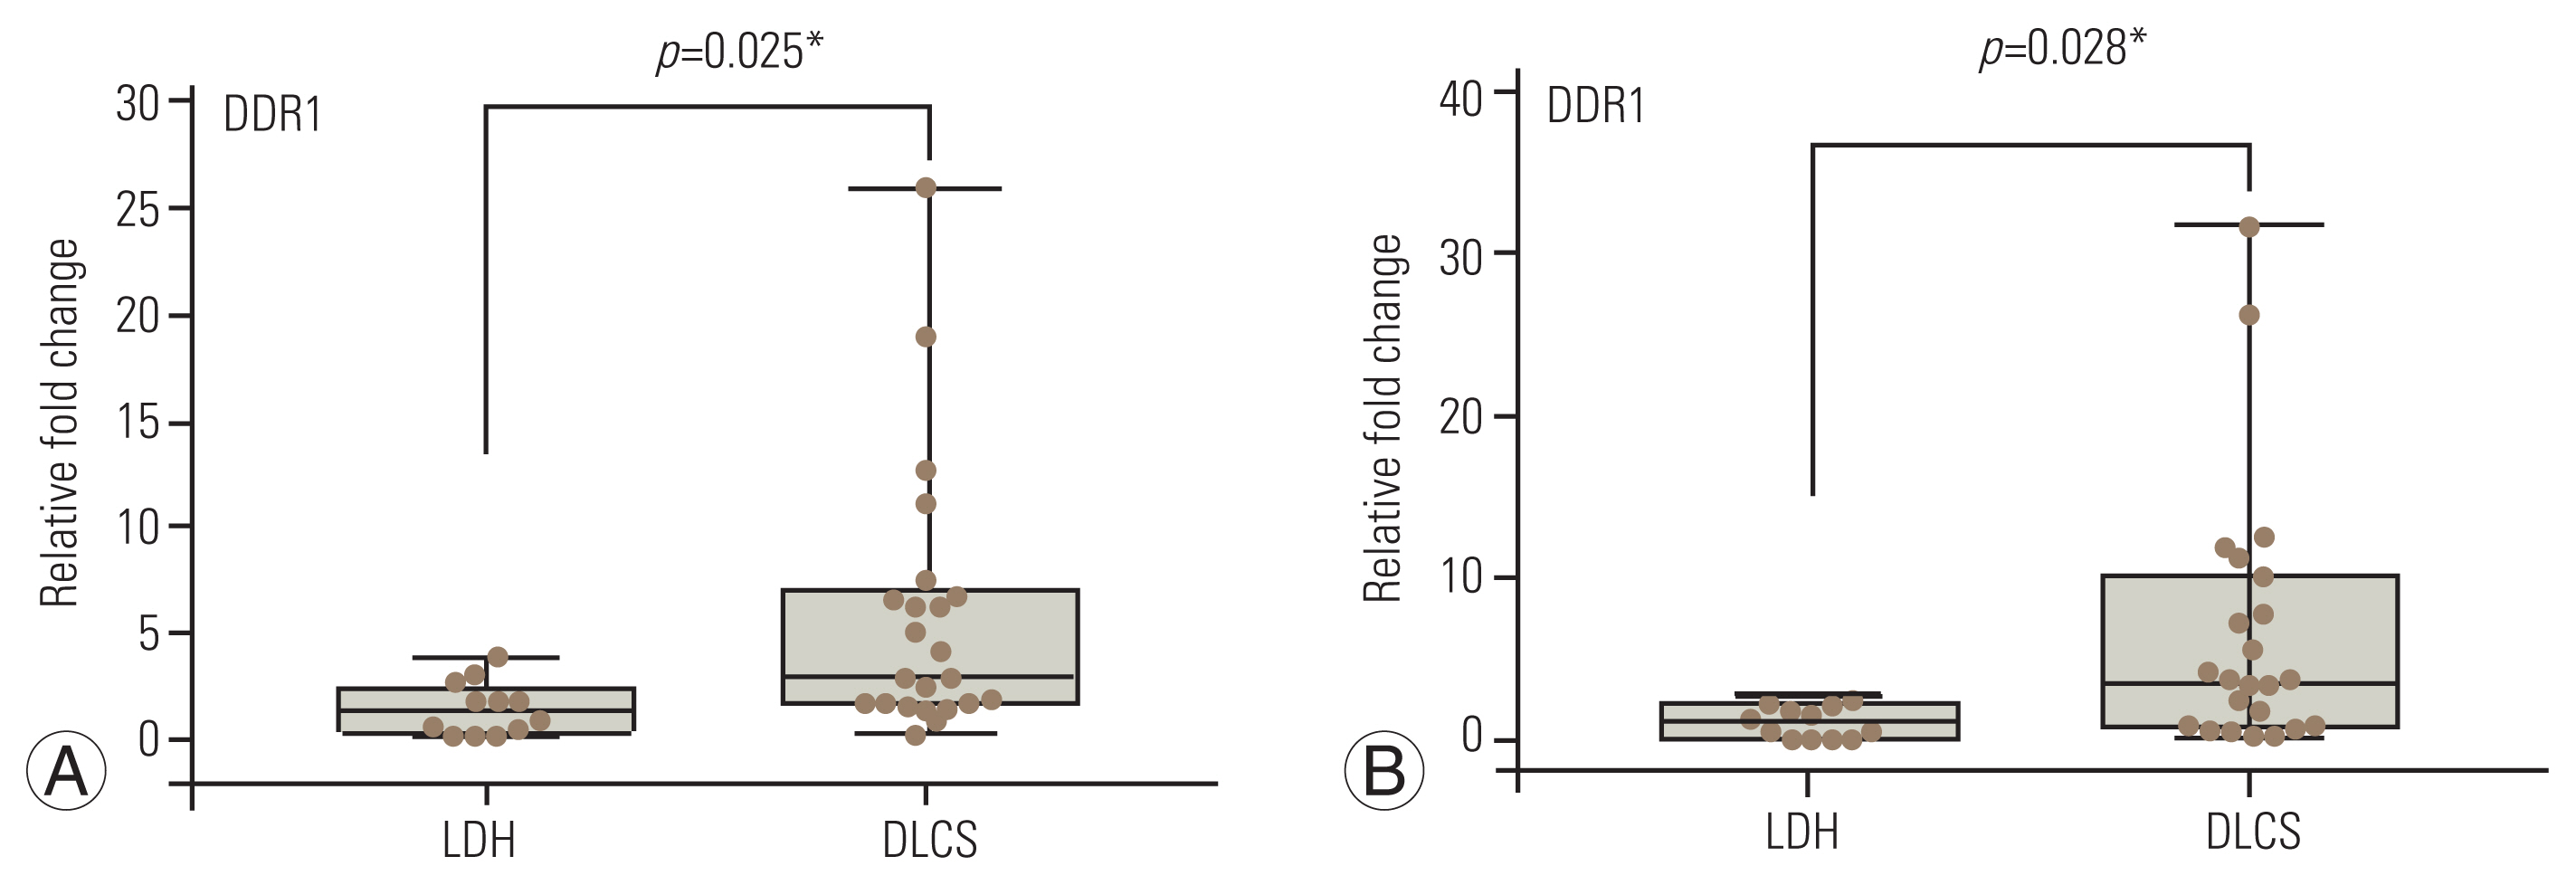
qRT-PCR analysis demonstrated that mean DDR1 and DDR2 expression values were 4.4┬▒5.5 and 4.6┬▒7.0, respectively. The LF samples of the DLCS group had higher expression of DDR1 and DDR2 than the LDH group, and the difference was statistically significant (Fig. 2). Furthermore, there were statistically significant positive relationships between these genesтАЩ expression profiles with LF thickness, but no such correlations were detected between these genes and LF fibrosis. On the other hand, DDR2 and DDR1 expression patterns were found to have a positive connection (Table 2).
4. High DDR1 and DDR2 expression were confirmed by Western blotting analysis
Western blot analysis was performed to confirm the high mRNA expression level of DDR1 and DDR2 in patients. It was observed that the expression of DDR1 and DDR2 proteins in DLCS patients was significantly increased compared to LDH patients (Fig. 3). DDR1 and DDR2 expressions were also found to be strongly linked with LF thickness and fibrosis. DDR2 expression was found to be positively associated with DDR1 expression as a consequence of this study (Table 2).
5. Expression of MMPs increased in DLCS patients
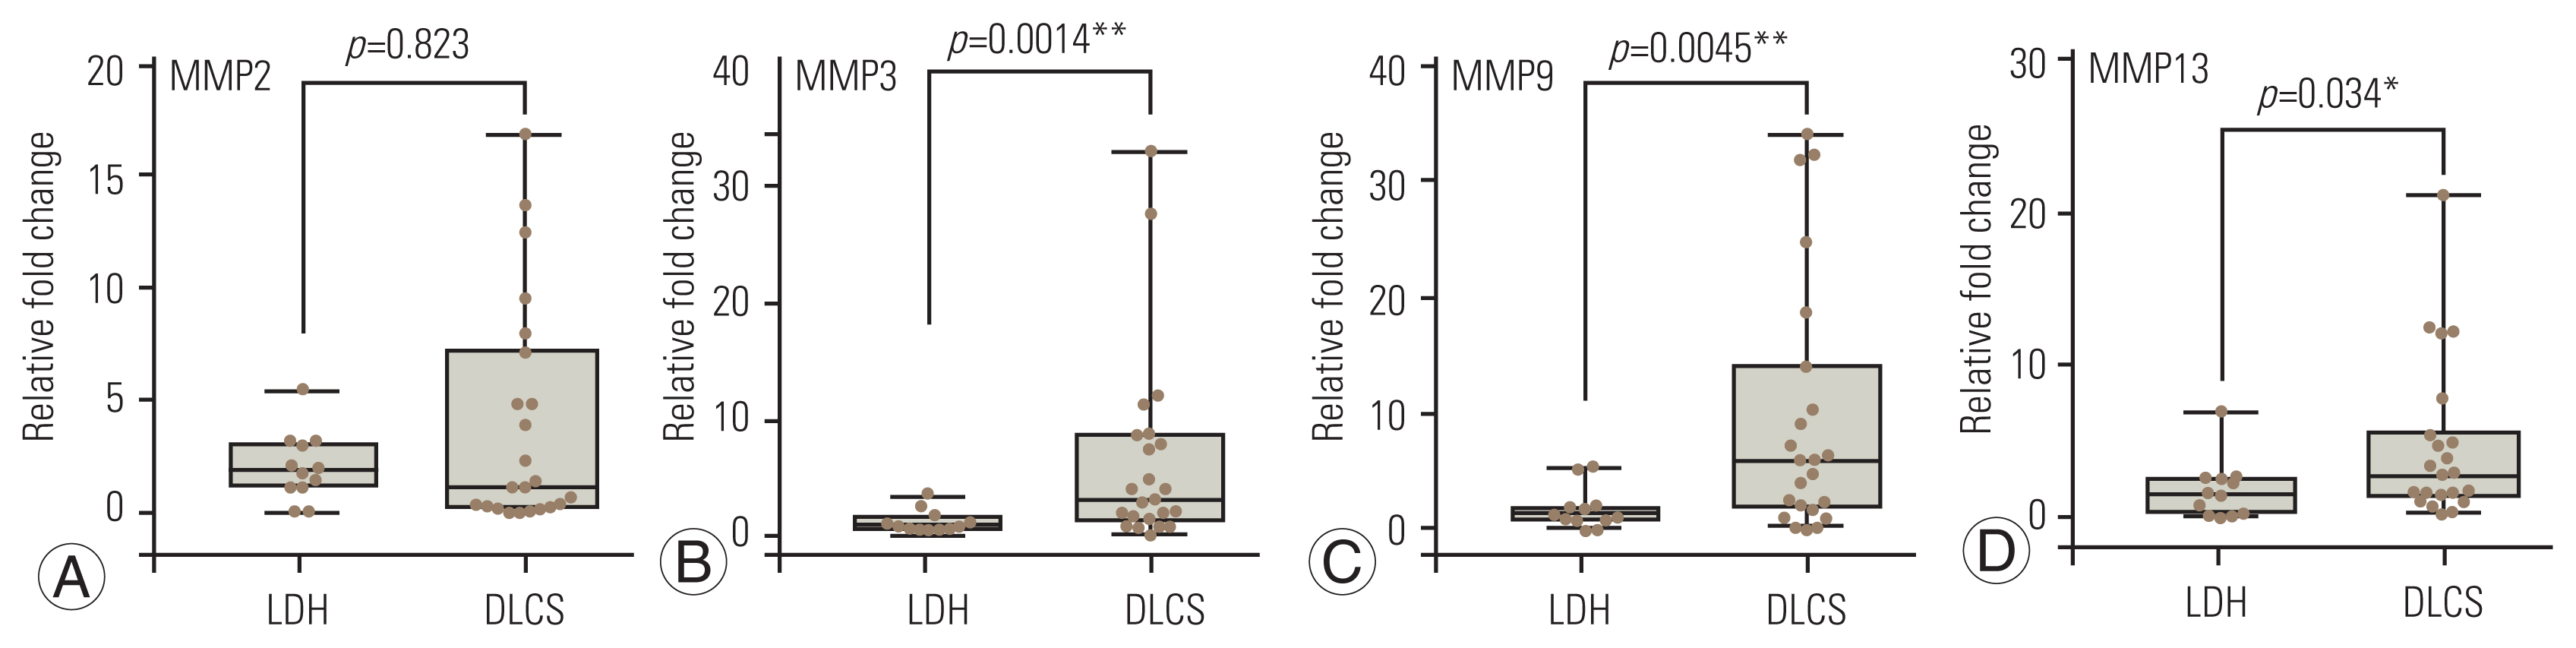
The qRT-PCR analysis showed that MMP3, MMP9, and MMP13 expressions of patients with DLCS were significantly increased compared to patients with LDH. However, the difference between MMP2 expression values was not significant (Fig. 4). Increased expression levels of MMPs were associated with DDR protein expression. In particular, MMP3 and MMP9 were observed to have positive correlations with protein expression of both DDR1 and DDR2 (Table 2).
Discussion
Previous studies have repeatedly revealed that fibrosis contributed to the thickening of the LF specimens of patients with DLCS [1,2]. LF fibrosis due to narrowing spinal canal leads to clinical symptoms of DLCS. However, degradation of the intervertebral disc and facet joints may play a role in the course of DLCS, and LF hypertrophy is a critical event in this process. Extracellular proteases, such as MMP, have been implicated in the molecular mechanism that causes fibrosis in the LF in several investigations [4,11]. In addition, studies have reported the essential influence of DDRs on the expression profile of MMP [16,17]. However, no research has looked into the involvement of DDR in LF fibrosis in DLCS patients. In the LF sample from individuals with DLCS, we detected indications of fibrotic alteration and increased expressions of DDR1 and DDR2. We used Western blot analysis to validate these findings.
Human MMPs, which are responsible for the degradation of the multiple components of the extracellular matrix, play an essential role in the molecular mechanism underlying fibrosis. As a result, MMPs and tissue inhibitors of matrix metalloproteinase (TIMP) could be important components of a fibrosis treatment strategy [18,19]. MMP1, MMP3, and MMP9 expressions are increased in hypertrophied LF in previous investigations [4,9]. Kim et al. [20] have reported that TIMP1 and TIMP2 expressions increased in the LF of patients with DLCS increased, while serum expression levels were similar in both groups. Thus, they suggested that the effect of these molecular players in LF fibrosis is a local phenomenon. MMPs, particularly MMP2, have been recommended by Sugimoto et al. [11] as a prospective molecular target for the prevention of DLCS. In contrast, according to Western blotting studies, an in vitro investigation performed on LF tissue culture from individuals with LDH revealed active expression of MMP9, but not MMP2 [10]. These results may be caused by the tissues obtained from patients with LDH who did not show any evidence of LF hypertrophy on their MRI. Oh and Ha [12] reported that MMP3 expression in the LF of patients with degenerative spondylolisthesis is higher than that of patients with spinal stenosis. Patients with DLCS had higher MMP3 expression than those with LDH when the outcomes of these investigations were compared. MMP9 is expressed in the fibroblast of LF tissues taken from individuals with DLCS, according to Park et al. [4]. As a result, research suggests that members of the MMP family play an important role in LF fibrosis. This study revealed that patients with DLCS had higher expression levels of MMPs (MMP2, MMP3, MMP9, and MMP13) than those with LDH (Fig. 4). Furthermore, based on the results of the Western blotting research, the correlation analysis revealed that MMP3 and MMP9 had a positive connection with both DDR1 and DDR2 expression (Table 2).
Many evidence showed that DDR has a regulatory role in the expression of MMPs. Vogel et al. [21] reported that DDR2 activation stimulated MMP1 expression. Majkowska et al. [22] have verified this effect of DDR2 on MMP1 using human fibroblasts. DDR2 has been shown to activate MMP2 in a prior study [23]. DDR1 increased and promoted MMP2 and MMP9 overexpression in pituitary adenoma cell lines, according to Yoshida and Teramoto [24]. This study revealed the correlations between DDR1 and DDR2, and MMPs may have a role in LF fibrosis, which is consistent with the evidence in the literature.
The MMP system has a primary role in the remodeling of connective tissues, which can occur in both physiological and pathological conditions through the degradation of collagen fibers [25]. Collagen fibers are the most common structural proteins of the extracellular matrix and cause an increase in tissue stiffness [26]. The accumulation of collagen fibers, which happens in degenerative LF fibrosis, is a crucial process that causes the LF to lose its elasticity. As a result, the LF is sensitive to mechanical stress during lumbar motion [2]. As a result, the thickening of the LF, which contains more collagens, causes a vicious cycle of тАЬscarтАУrepairтАУscarтАЭ [2,27]. Many studies have reported the increasing amounts of collagen fibers in LF thickening. The synthesis of type I and III collagen fibers in fibroblasts enhances macrophage infiltration in the LF tissue of individuals with DLCS [28]. Takeda et al. [1] reported high expressions of collagen types I, III, V, VI, and VIII in LF samples of patients with DLCS. This result was confirmed by immunohistochemistry staining. Furthermore, the cross-sectional area of the LF on MRI was linked to the overexpression of type I, III, and VI collagen fibers. As a result, they hypothesized that these collagen fibers could provide a fresh perspective on the DLCS mechanism. On the other hand, collagen fibers are signaling molecules that play an important role in various physiological and pathological circumstances [29]. Their signaling properties have influenced fundamental cell processes through collagen receptors such as DDRs. DDR1 and DDR2 are DDRs that can be expressed in epithelial and mesenchymal cells, respectively [30]. Although they are members of the receptor tyrosine kinase (RTK) family, they differ from other RTKs in several ways [21]. Type I, III, and V collagen fibers can all be activated by DDR1 or DDR2. Nonfibrillar collagens, unlike DDR2, can activate DDR1 [7]. Therefore, DDR-collagen binding has been thought to act as a molecular player on fibrosis [30].
This research has some limitations. First, our sample group was small. Second, the expression of each type of collagen fibers should be measured. As this is a preliminary study, our goal was to show the role of DDR1 and DDR2 on LF fibrosis. The entire expression profiles of collagen fibers, as well as the association between the expression of DDRs and these genes, will be part of our future research.
Conclusions
According to our literature search, our study is the first research to reveal expression levels of DDR1/DDR2 and correlation with MMPs in the molecular mechanism of LF fibrosis. In this study, LF fibrosis was confirmed by evaluating radiologically and histologically in patients with LDH and DLCS. qRT-PCR and Western blot analyses were performed LF tissue samples of the patients, and it was revealed that the expression of DDR1 and DDR2 and MMP3, MMP9, and MMP13 were significantly increased. DDR2, MMP3, and MMP9, on the other hand, were found to have favorable relationships with DDR1. DDR1 and DDR2 gene levels were also favorably connected with LF thickness and fibrosis score; however, only MMP13 was positively correlated with LF thickness and fibrosis score. Taken together, the mechanisms of DDRs, especially including DDR1 and MMPs, might reveal novel therapeutic interventions in treating DLCS. However, further studies are required to clearly understand this therapeutic intervention.