Introduction of a Novel “Segmentation Line” to Analyze the Variations in Segmental Lordosis, Location of the Lumbar Apex, and Their Correlation with Spinopelvic Parameters in Asymptomatic Adults
Article information
Abstract
Study Design
Cross-sectional study.
Purpose
This study aimed to understand the sagittal spinopelvic parameters, segmental lumbar parameters, and lumbar apex location in asymptomatic adults and analyze their correlations with each other.
Overview of Literature
Roussouly and his colleagues reported that pelvic incidence (PI) influences the lower arc of lumbar lordosis, whereas Pesenti and his colleagues reported that PI influences only the proximal part of lordosis and not the distal part. Both studies have their shortcomings.
Methods
One hundred asymptomatic adult volunteers (mean age, 29.1±7.9 years; 69 males, 31 females) who satisfied the selection criteria were enrolled in this study. Standing antero-posterior and lateral whole spine and pelvis X-rays were performed, and the radiographic parameters were analyzed. We introduced a “segmentation line” bisecting the apical vertebra/disk to divide the upper arc of lumbar lordosis (ULL) and lower arc of lumbar lordosis (LLL).
Results
The mean PI was 48.02°, ULL 29.12°, LLL 16.02°, total lumbar lordosis (TLL) 45.14°, lumbar tilt angle 4.73°, and location of the apex of lumbar lordosis (LLA) 4.11°. The location of the lumbar apex moved higher as the PI increased. The PI was strongly positively correlated with the LLL (r =0.582, p <0.001) and TLL (r =0.579, p <0.001) but not with the ULL (r =0.196, p =0.05). The LLA was strongly positively correlated with the ULL (r =0.349, p <0.001), negatively with the LLL (r =−0.63, p <0.001), and not correlated with the TLL (r =−0.177, p =0.078).
Conclusions
The PI influences the location of the lumbar apex, the LLL, and the TLL but not the ULL. The location of the lumbar apex significantly influences the segmental lordosis but not the TLL.
Introduction
The sagittal configuration of the spine has been linked to the shape and orientation of the pelvis [1-3]. Pelvic tilt (PT) and sacral slope (SS) are positional parameters and vary with the position of the body, whereas pelvic incidence (PI) is a morphological parameter and remains constant irrespective of the position [4,5]. PI is reportedly strongly correlated with lumbar lordosis (LL) in normal and pathological situations [2,4,6-9]. Schwab et al. [10] proposed the equation LL=PI±9° to simplify the estimation of LL from the inherent pelvic morphology of the patient. Tono et al. [11] suggested that the relationship between PI and LL is not always constant and that no significant correlation exists between the two parameters in cases with apex above L3 vertebra. Therefore, the association of PI and detailed contour of the LL rather than the overall LL must be established.
Laouissat et al. [12] and Roussouly et al. [8] demonstrated that a high PI implies a high SS, implying a large lower arc of lordosis (LLL). However, their classification has two major shortcomings. One is the use of SS, which is a positional parameter to classify spinopelvic morphology as pointed out by Pan et al. [13]. Another is the use of a horizontal line as a reference to separate the upper and lower arcs, thereby equating the lower arc of LL to SS [14]. In contrast to the observations of Laouissat et al. [12] and Roussouly et al. [8], Pesenti et al. [14] found that PI influences only the proximal part of lordosis and not the distal part in asymptomatic population. They observed that the L4–S1 lordosis is nearly constant and independent of the PI.
We performed this study to answer the following research questions: (1) What are the spectrum of spinopelvic parameters in asymptomatic Indian adults with respect to the segmental lumbar parameters and the location of the lumbar apex? (2) How does the position of the apex of lumbar lordosis (LLA) vary with respect to PI in asymptomatic Indian adults? (3) How does the segmental LL vary with respect to PI in asymptomatic Indian adults?
Methods
Whole spine radiographs of 100 asymptomatic adult volunteers from the institutional imaging database were analyzed for the study on the basis of the following inclusion criteria: (1) age group: 18–60 years; (2) no history of neck pain/back pain/radicular symptoms in previous 6 months; (3) no past history of chronic back/neck pain; (4) no history of spinal diseases/spinal surgery/hip or knee arthroplasty; (5) no coronal deformity (≥10°) or lumbar spondylolisthesis; (6) no history of neuromuscular disorders; and (7) non-pregnant.
Written informed consents were obtained from all participants of the study. This study was performed in compliance with the Declaration of Helsinki. The place of study accepts retrospective imaging evaluation without Institutional Review Board approval because the study does not involve interaction or intervention with human participants.
1. Radiographic evaluation
Standing antero-posterior and lateral whole spine and pelvis X-rays were performed for all volunteers. The participants were asked to stand straight, look straight ahead and place the wrists on the shoulders with mild shoulder flexion. Radiographic measurements were performed by two fellowship-trained spine surgeons who are blinded to the study outcomes, and the average of the values was determined.
Inflection point was defined as the point where the spine transitioned from kyphosis to lordosis (Fig. 1). The segment between the inflection point and S1 was defined as the “lumbar” segment. The number of vertebrae within this segment was taken as the number of lordotic vertebrae. The LLA was defined as the most anterior lumbar vertebra or disk in the sagittal plane (Fig. 1). Vertebrae from L1 to L5 were assigned numbers ranging from 1 to 5. A value of 0.5 was added to the superior vertebra number when an intervertebral disc formed the apex. The total lumbar lordosis (TLL) was defined as the angle between the superior endplate of the uppermost vertebra of the “lumbar” segment and the superior endplate of S1 (Fig. 1). The lumbar segment was divided into upper and lower arcs by a “segmentation” line. The segmentation line was drawn connecting the mid points of the anterior and posterior walls of the apical vertebra (when a vertebra forms the apex)/anterior and posterior annulus of the apical disk (when a disk forms the apex) (Fig. 1). The upper arc of lumbar lordosis (ULL) was defined as the angle between the superior endplate of the uppermost vertebra of the “lumbar” segment to the segmentation line (Fig. 1). The LLL was defined as the angle between the segmentation line and the superior endplate of S1 (Fig. 1). Lordotic tilt angle (LTA) was defined as the angle made by the line joining the anterior superior edge of S1 and the vertical inflection point (Fig. 2). C7 plumb line (a vertical drawn from the center of the C7 vertebral body) was used to assess the global sagittal balance by classifying it into sagittal vertical axis (SVA) types 1 (C7 plumb line falls behind the hip axis [HA] and the center of the upper sacral endplate), 2 (C7 plumb line falls between the center of the upper sacral endplate and the HA), and 3 (C7 plumb line is in front of the HA and the center of the upper sacral endplate) (Fig. 2). The radiographic parameters measured were the pelvic parameters (PI, PT, and SS), number of lordotic vertebrae, LLA, TLL, ULL, LLL, LTA, PI–LL, and SVA types.
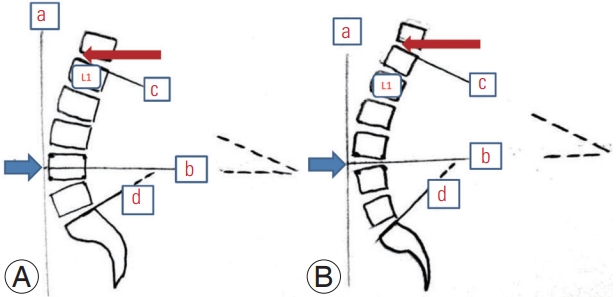
An illustration showing as follows: (1) Inflection point (marked by a red arrow), where the spine transitions from lordosis to kyphosis. The lumbar segment extends from this point to the S1. (2) Lumbar apex (location of the apex of lumbar lordosis; marked by a blue arrow), which is the most anterior vertebra or disc which touches the vertical line ‘a’. (A) The apex was formed by L4 vertebra. (B) The apex is formed by the L3–L4 disc. (3) Segmentation line: if a vertebra forms the apex of lordosis such as in (A), a line joining the midpoint of the posterior vertebral line and the mid-point of the anterior vertebral line is considered as segmentation line, marked as ‘b’. In cases where the disc forms the apex of lordosis such as in (B), a line joining the mid-point of the posterior annulus and the mid-point of the anterior annulus is considered as segmentation line, marked as ‘b’. (4) Upper arc of lumbar lordosis (ULL): the angle formed by an imaginary line formed by extending the line c (a line drawn along the superior endplate of the upper most vertebra of the lumbar segment) and the segmentation line ‘b’. (5) Lower arc of lumbar lordosis (LLL): the angle formed by an imaginary line formed by extending the line d (a line drawn along the superior endplate of S1 vertebra) and the segmentation line ‘b’. (6) Total lumbar lordosis which is the sum of ULL and LLL and is the angle formed between the lines c and d.
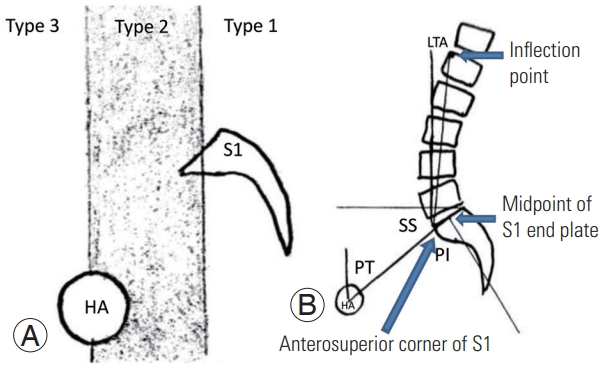
(A) An illustration showing the three sagittal vertical axis types based on the location of C7 plumb line in relation to the S1 vertebra and the hip axis (HA). (B) An illustration demonstrating the calculation of pelvic incidence (PI), pelvic tilt (PT), sacral slope (SS), and lordotic tilt angle (LTA).
2. Statistical analysis
All statistical analyses were performed using IBM SPSS Statistics for Windows ver. 25.0 (IBM Corp., Armonk, NY, USA). Descriptive and inferential statistical analyses were carried out in the study. Results on continuous measurements were presented as mean and standard deviation with range (minimum–maximum). Results on categorical measurements were presented as numbers and percentages (%). T-test of two independent sample means was used to find significance difference between two independent samples for continuous outcomes. Pearson’s correlation/ Spearman’s rho was used as per the distribution and assumption to determine the correlation between two variables. Fisher exact test or chi-square test was utilized to find the significance of study parameters on a categorical scale between two or more groups. One-way analysis of variance was used to evaluate the significant difference among the SVA types for all radiological parameters. The significance was assessed at the 5% level of significance.
Results
A total of 100 participants were included in this study with a mean±standard deviation age of 29.1±7.9 years (69 males, 31 females). The mean values and 95% confidence intervals of the various radiological parameters are provided in Table 1. The gender wise distribution of the radiological parameters assessed is provided in Table 2. Significant differences were observed in pelvic parameters, such as PT and PI, with higher mean values in females than males. The TLL was significantly higher in females than males. The location of the lumbar apex was lower in females than males. The inflection point was located at T12 in eight participants (seven males, one female), L1 in 67 participants (42 males, 25 females), and L2 in 25 participants (20 males, five females). No significant association was found between gender and the location of inflection point (p=0.180, chi-square value=3.943). Twenty-five participants (18 males, seven females) had SVA type 1, 42 participants (31 males, 11 females) had SVA type 2, and 33 participants (20 males, 13 females) had SVA type 3. No significant association was found between gender and the distribution of SVA types in the population (p=0.493, chisquare value=1.646).

Distribution of radiological parameters

Gender-wise distribution of study population with radiological parameters
Statistically significant difference was found between SVA types for PT (p=0.027). In addition, post-hoc analysis utilizing Bonferroni correction (with significance at 0.05 level) showed that PT (p=0.037) significantly differed among the various SVA types (Table 3).

Comparison of radiological parameters among different SVA types
PI was significantly negatively correlated with the location of the lumbar apex (r=−0.355, p<0.001). In specific, the location of the lumbar apex moved higher as the PI was increased (Table 4). The PI significantly positively correlated with the LLL (r=0.582, p<0.001) and the TLL (r=0.579, p<0.001) but not with the ULL (r=0.196, p=0.05). The PI positively correlated with the PT (r=0.502, p<0.001), SS (r=0.867, p<0.001), and PI–LL (r=0.622, p<0.001).

Results of the correlation analysis
The scatter plot diagrams of various radiological parameters showing positive association with PI are provided in Figs. 3 and 4.

Scatter plot diagrams showing the correlation between pelvic incidence (PI) and pelvic tilt (PT) (A), sacral slope (SS) (B), and lordotic tilt angle (LLA) (C). R2 Lin, R2 linear regression.
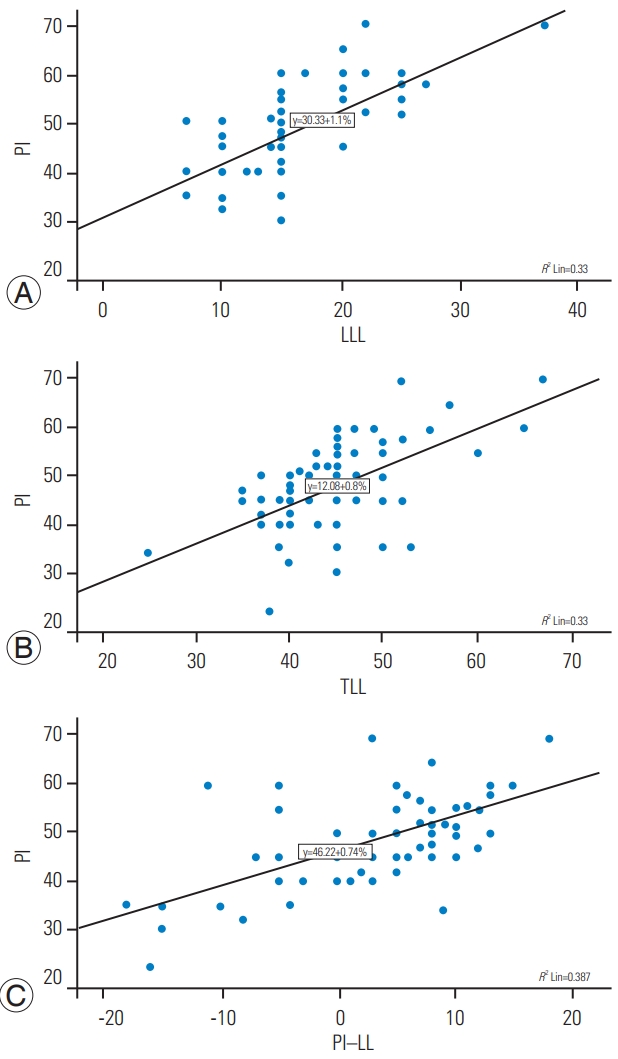
Scatter plot diagrams showing the correlation between pelvic incidence (PI) and lower arc of lumbar lordosis (LLL) (A), total lumbar lordosis (TLL) (B), and PI–lumbar lordosis (LL) (C). R2 Lin, R2 linear regression.
The LLA strongly correlated positively with the ULL (r=0.349, p<0.001) and negatively with the LLL (r=−0.63, p<0.001) but not correlated with the TLL (r=−0.177, p=0.078). As the location of the lumbar apex moved lower, the ULL increased, the LLL decreased, but the TLL showed no significant change. The LLA was strongly correlated with the PI (r=−0.355, p<0.001) and SS (r=−0.386, p<0.001) but not with the PT (r=−0.042, p=0.68) (Table 4).
The ULL (r=0.697, p<0.001) and LLL (r=0.609, p<0.001) were strongly correlated with the TLL. However, the PI– LL was negatively correlated with the ULL (r=−0.395, p<0.001) but not with the LLL (r=0.155, p=0.123). The LLL but not the ULL strongly positively correlated with the PI (LLL: r=0.582, p<0.001; ULL: r=0.196, p=0.05), PT (LLL: r=0.311, p=0.002; ULL: r<0.001, p=0.997), and SS (LLL: r=0.493, p<0.001; ULL: r=0.227, p=0.023) (Table 4).
The PI–LL was strongly correlated with the PI (r=0.622, p<0.001), PT (r=0.332, p=0.001), and SS (r=0.528, p<0.001) positively and with the LLA (r=−0.256, p=0.01), ULL (r=−0.395, p<0.001), and TLL (r=−0.204, p=0.041) negatively (Table 4). The LTA had no correlation with any other radiological parameters. However, age was negatively correlated with LTA (r=−0.219, p=0.029).
Discussion
An understanding of the natural profile of the spine is essential when a spine surgeon performs a spinal fusion, particularly over multiple segments. The aim of a fusion surgery should be to restore the natural profile of the spine. Hence, the normal segmental curves and the location of the apex of the curve must be determined to restore them in cases of spinal disorders causing mal-alignment. The lumbar apex moved higher as the PI increased. The location of the lumbar apex was not correlated with the total lordosis but was strongly positively correlated with the ULL and negatively correlated with the LLL.
Singh et al. [15] studied the spinopelvic parameters in 50 Indian participants and reported a mean PI of 48.52°±8.99° and TLL of 58.78°±9.51°. Comparison of PI values reported in different populations (Brazilian, 48.7°±9.6°; European, 54.7°±10.6°; Korean, 47.8°±9.5°) showed that the PI in the European population is higher than that in other populations [16-18]. However, racial differences in segmental lordotic parameters have not been studied in the previous literature. Our values of PI are in accordance with the previous Indian study. The gender differences in PI and PT with higher values in females are consistent with the previous findings [19-21]. We additionally found that the location of the lumbar apex was lower in females than males.
The location of the lumbar apex was not related to the TLL. For a given value of TLL, the location of the lumbar apex may vary and the upper and lower arcs adjust accordingly to maintain the TLL. The TLL is determined by the pelvic parameters (PI, SS, and PT) and not the location of the lumbar apex. This correlation of PI with LL has been demonstrated in numerous earlier studies [8-11].
Pan et al. [13] found that PI is strongly correlated with the LLA, TLL, ULL, and LLL. They found a negative correlation between PI and the location of the lumbar apex. They found that PI is significantly correlated with the ULL and LLL. They considered a horizontal line from the apex to divide the upper and lower arcs. This equates the lower arc to the SS. Hence, in normal population, a high PI represents a high SS and a high value of the distal arc. However, in spinal pathology, changes in spinal alignment lead to changes in PT and SS without a change in PI. In such cases, this classification would be misleading. For example, a pathology in the upper lumbar spine causing a reduction in LL would cause a compensatory pelvic retroversion, increase the PT, reduce the SS, and thereby reduce the LLL. However, the actual pathology was in the upper lumbar spine.
Hence, we introduced a novel entity called “segmentation line” at the LLA to divide the upper and lower arcs, such that none of them directly equates to the pelvic parameters, such as SS. Laouissat et al. [12] and Roussouly et al. [8] used a horizontal line at the lumbar apex to divide the upper and lower arcs, whereas Pesenti et al. [14] used the superior end plate of L4 to divide the upper and lower arcs. The horizontal line used by Laouissat et al. [12] and Roussouly et al. [8] equates the lower arc to SS, and the L4 line used by Pesenti et al. [14] does not consider the normal variations in the location of the lumbar apex. With the new entity introduced in this study, we found that the PI was correlated with the LLL and TLL but not with the ULL. These findings are in contrast to those of Pesenti et al. [14] and concur with the observations of Roussouly et al. [8], although our concepts of upper and lower arcs are different from those in previous studies.
Our observation of migration of the lumbar apex to a higher level in participants with high PI agrees with the findings of Roussouly et al. [8], Pan et al. [13], and Pesenti et al. [14].
Schwab et al. [10] estimated the ideal LL by considering the inherent pelvic morphology of a patient (LL=PI+9°±9°). Pan et al. [13] measured the LLA and correlated it with the PI and proposed a regression formula to provide a reference value for an ideal LLA (LLA=−0.042×PI+6.134; R2=0.306). However, Sebaaly and Roussouly [22] commented that such simplification can result in a high incidence of mechanical complications after spine surgery, similar to that in the generalization of PI–LL [23,24]. Hence, an accurate correction of the LLA is recommended to prevent complications.
Basing from the classification proposed by Mac-Thiong et al. [25], we used SVA types 1–3 to classify our participants. Our findings suggest that 33% of the participants had C7 plumb line in front of the hip axis, whereas it was 15% in the study by Mac-Thiong et al. [25]. However, such findings are reported in normal individuals in previous studies [16,26,27]. Such deviation in SVA away from the upper sacral end plate cannot be considered abnormal but as a borderline for a pathological posture. The SVA was not associated with spinopelvic parameters, which agrees with the study by Zeng et al. [28] except for PT. Asai et al. [29] found that the PI–LL is strongly correlated with SVA, but such correlation was not observed in our study.
1. Merits
To our knowledge, this study is the first to define the normative values of segmental lordosis and the location of the lumbar apex for the Indian population. In consideration that the spinopelvic parameters vary between races and genders, establishing these values is crucial for further research. The gender differences in the parameters were also analyzed. We introduced a novel “segmentation line” that compensates for the drawback in the patterns of division of UPP and LLL in previous studies. The segmentation line bisects the anatomical landmarks, allowing the surgeon to orient himself to the upper and lower arcs easily while correcting the deformity. We could draw correlations between the various spinopelvic parameters and the segmental profile of the lumbar spine, which could help in accurate and individualized correction of the deformity.
2. Limitations
The study has several limitations. The sample size is small. A larger size of patients may throw more light into the association between the various discussed spinopelvic parameters. The volunteers were recruited from an urban hospital setting in northern India. India is a country of mixed population with variations in racial origins. Hence, the results of the study cannot be generalized to the whole Indian population. In addition, the study involves radiological measurements; thus, errors in resolution, positioning of patient, and calculation of angles are possible. The mean age of participants in the study is 29.1 years. Adult spinal deformity usually occurs at a later age, and the findings of the present study may not be completely applicable to them.
Conclusions
The PI influences the location of the lumbar apex, the LLL, and the TLL but does not influence the ULL. A person with high PI and a person with low PI differ predominantly in the LLL but not in the ULL. The location of the lumbar apex strongly influences segmental lordosis but not the TLL.
Notes
No potential conflict of interest relevant to this article was reported.