Introduction
Diabetes is a significant healthcare concern worldwide, causing various complications in the kidney, heart, eye, and so on. Diabetes is also thought to be an important etiologic factor in disc degeneration. Previous studies have shown that diabetic patients undergo a higher frequency of spine surgery for degenerative disc diseases than nondiabetic patients and have relatively poor surgical outcomes [1,2]. However, the pathogenesis of degenerative disc diseases has not been completely elucidated currently. Nevertheless, increasing evidence indicates that disc degeneration plays a crucial role in the onset and development of degenerative disc diseases. Jiang et al. [3] and Rannou et al. [4] also previously asserted that excessive apoptosis of disc cells and matrix degradation are the primary causes of disc degeneration.
Fas is a well-known apoptotic receptor expressed in a wide variety of human cells. Fas triggers apoptosis after binding to its natural ligand (Fas ligand) or agonistic anti-Fas antibody [5,6]. Two main pathways of Fas-mediated apoptosis have been identified: caspase-8, which is responsible for the type-I (death-inducing signaling complex) pathway; caspase-9, which are responsible for the type-II (mitochondrial) pathway; and caspase-3, which is the final common executioner. Recently, the role of Fas-mediated apoptosis of disc cells was extensively investigated in disc degeneration. Park et al. [7–11] reported the expression of Fas in human and animal disc cells, such as nucleus pulposus (NP) and annulus fibrosus disc cells. They also demonstrated that excessive Fas-mediated apoptosis of disc cells accelerates the matrix degradation of disc tissues, leading to disc degeneration [12]. In addition, the cellular effect of diabetes on apoptosis of disc cells and disc degeneration was recently reported [12,13]. High glucose concentrations significantly decreased proliferation and increased disc cell apoptosis with dose- and time-dependent effects. The expression of matrix-degrading enzymes was also increased with dose- and time-dependent effects. These results suggest that aggressive diabetic control should be recommended to prevent or limit disc degeneration.
The streptozotocin (STZ)-induced diabetic rat model is an animal model of human type 1 diabetes that has been widely used in diabetes studies, including pathogenesis and therapeutic drug development [14–19]. Based on their results, Park et al. [7–11] suggested that strict blood glucose control is important for preventing or delaying disc degeneration in diabetic patients. However, it is believed that no studies demonstrating the inhibitory effect of insulin treatment on disc cell apoptosis and matrix degradation in diabetic patients exist. Accordingly, this study was conducted to investigate whether insulin treatment could attenuate apoptosis of disc cells and matrix degradation in a STZ-induced diabetic rat model.
Materials and Methods
The experiments conducted in this study were approved by the Animal Care and Use Committee of the Uijeongbu St. Mary’s Hospital. Thirty 3-week-old male rats were purchased from the Orient Bio (Seongnam, Korea) and kept under controlled temperature (21°C±1°C) and humidity (55%–60%) with a 12-hour light/dark cycle (light period, 7:00 AM–7:00 PM) in the laboratory animal center. Four rats were housed in a cage and fed standard solid rat chow and distilled and deionized drinking water ad libitum. The rats were treated following the ethical guidelines of this study’s institution. One week after purchase, the rats, who had reached a bodyweight of at least 200 g, were allocated randomly into one of three experimental groups: control (n=6), STZ (n=12), and STZ-insulin (n=12). The rats were weighed and underwent an 8-hour fasting blood glucose test every week.
1. STZ-induced diabetic rat model and insulin treatment
The experimental design is summarized in Fig. 1. Diabetes was induced in the STZ and STZ-insulin groups by a single intraperitoneal injection of STZ (65 mg/kg; Sigma, St. Louis, MO, USA) freshly dissolved in phosphate-buffered saline (PBS). The control group was injected with an equivalent PBS volume. Three days after STZ injection, blood glucose levels were tested in rats from the tail vein using a commercial glucometer (ACCU-Chek; Roche Diagnostics GmbH, Mannheim, Germany). All rats in the STZ and STZ-insulin groups were diagnosed as diabetic by showing a blood glucose level higher than 250 mg/dL. Two weeks after STZ injection, the blood glucose level was confirmed to be consistently above 400 mg/dL in all rats in the STZ and STZ-insulin groups. Insulin treatment was initiated for the STZ-insulin group by daily intraperitoneal injection (1.5 unit/100 g) for up to 4 weeks. Six weeks after STZ injection (4 weeks after insulin treatment), all 30 rats were sacrificed, and lumbar disc tissues (L1–2 through L5–6), including cranial and caudal cartilaginous endplates, were obtained. The disc tissues were dissected with the aid of a microscope to obtain NP disc tissues for reverse transcription polymerase chain reaction (RT-PCR) and western blot analyses.
2. RT-PCR analysis for expression of Fas
The RT-PCR experimental method used in this study was the same as described in a previous paper [10]. Briefly, total RNA was extracted from NP cells and tissues using TRIzol regent (Invitrogen, Grand Island, NY, USA) following the manufacturer’s instructions. For complementary DNA (cDNA) synthesis, 2 μg total RNA was reverse transcribed in a reaction mixture containing 25 units ribonuclease inhibitor, 15 units reverse transcriptase, 500 ng oligo (dT) primer, 3 mM MgCl2, 0.5 mm dNTP, and 1× RT buffer (Promega Corp., Madison, WI, USA). cDNA was used as a template for PCR using GoTaq polymerase (Promega Corp.) and PCR primers to amplify Fas and glyceraldehyde 3-phosphate dehydrogenase (GAPDH) (Bioneer, Cheongwon, Korea). PCR was performed using a Mycycler thermal cycler (Bio-Rad, Hercules, CA, USA) following the manufacturer’s instructions. An analysis of the PCR products using 1% agarose gel electrophoresis revealed single amplicons of the expected sizes. GAPDH was used as an internal control. The primer sequences used in the experiment are as follows: 5-GGCATCTGGACCCTCCTACCTCTG-3 (forward) and 5-CCTTGGAGTTGATGTCAGTCACTTGG-3 (reverse) for Fas and 5-ATCATCTCCGCCCCTTCTGC-3 (forward) and e 5-GCCTGCTTCACCACCTTCTT-3 (revers) for GAPDH.
3. Western blot analysis for expression of caspases and matrix metalloproteinases
The experimental methods used in this study were described in a previous paper [9,12,20]. Briefly, total protein was extracted from NP cells and tissues with a protein lysis buffer containing 50 mM HEPES pH 7.5, 150 mM NaCl, 1.5 mM MgCl2, 1 mM EGTA, 10% glycerol, 1% Triton X-100, and 1 μM phenylmethylsulphonyl fluoride. Lysates of NP cells and tissues were centrifuged at 12,000 g for 15 minutes, and protein concentrations were measured using the bicinchoninic acid method (Thermo Fisher Scientific, Pittsburgh, PA, USA). Subsequently, 50 μg protein per sample was electrophoresed on 10% sodium dodecyl sulfate-polyacrylamide gels and transferred onto nitrocellulose membranes. The membranes were incubated with primary antibodies and then with a horseradish peroxidase-linked immunoglobulin G secondary antibody (Bio-Rad). Immunoreactive bands were visualized with an enhanced chemiluminescence detection kit (Santa Cruz Biotechnology Inc., Santa Cruz, CA, USA). Protein expression levels of caspase-8, -9, and -3; MMP-2 and -3 in NP cells and tissues were determined by western blot analysis following the manufacturer’s instructions (Santa Cruz Biotechnology Inc.). β-actin was used as an internal control. Primary antibodies specific to caspase-8 (Santa Cruz Biotechnology Inc.), -9 and -3 (Cell Signaling, Danvers, MA, USA), MMP-2 and -3 (Abcam Plc, Cambridge, UK), and β-actin (Sigma, St. Louis, MO, USA) were used.
4. Statistical analysis
Blots were quantified using Imaging Densitometer GF670 and Molecular Analyst software (Bio-Rad) thrice for each sample, and the average of three densities was used as the final density. The value of the density was presented as the mean±standard deviation (arbitrary units). Statistical analysis was performed with a T-test on the independent samples. The level of significance was set to p<0.05.
Results
1. STZ-induced diabetic rat model and insulin treatment
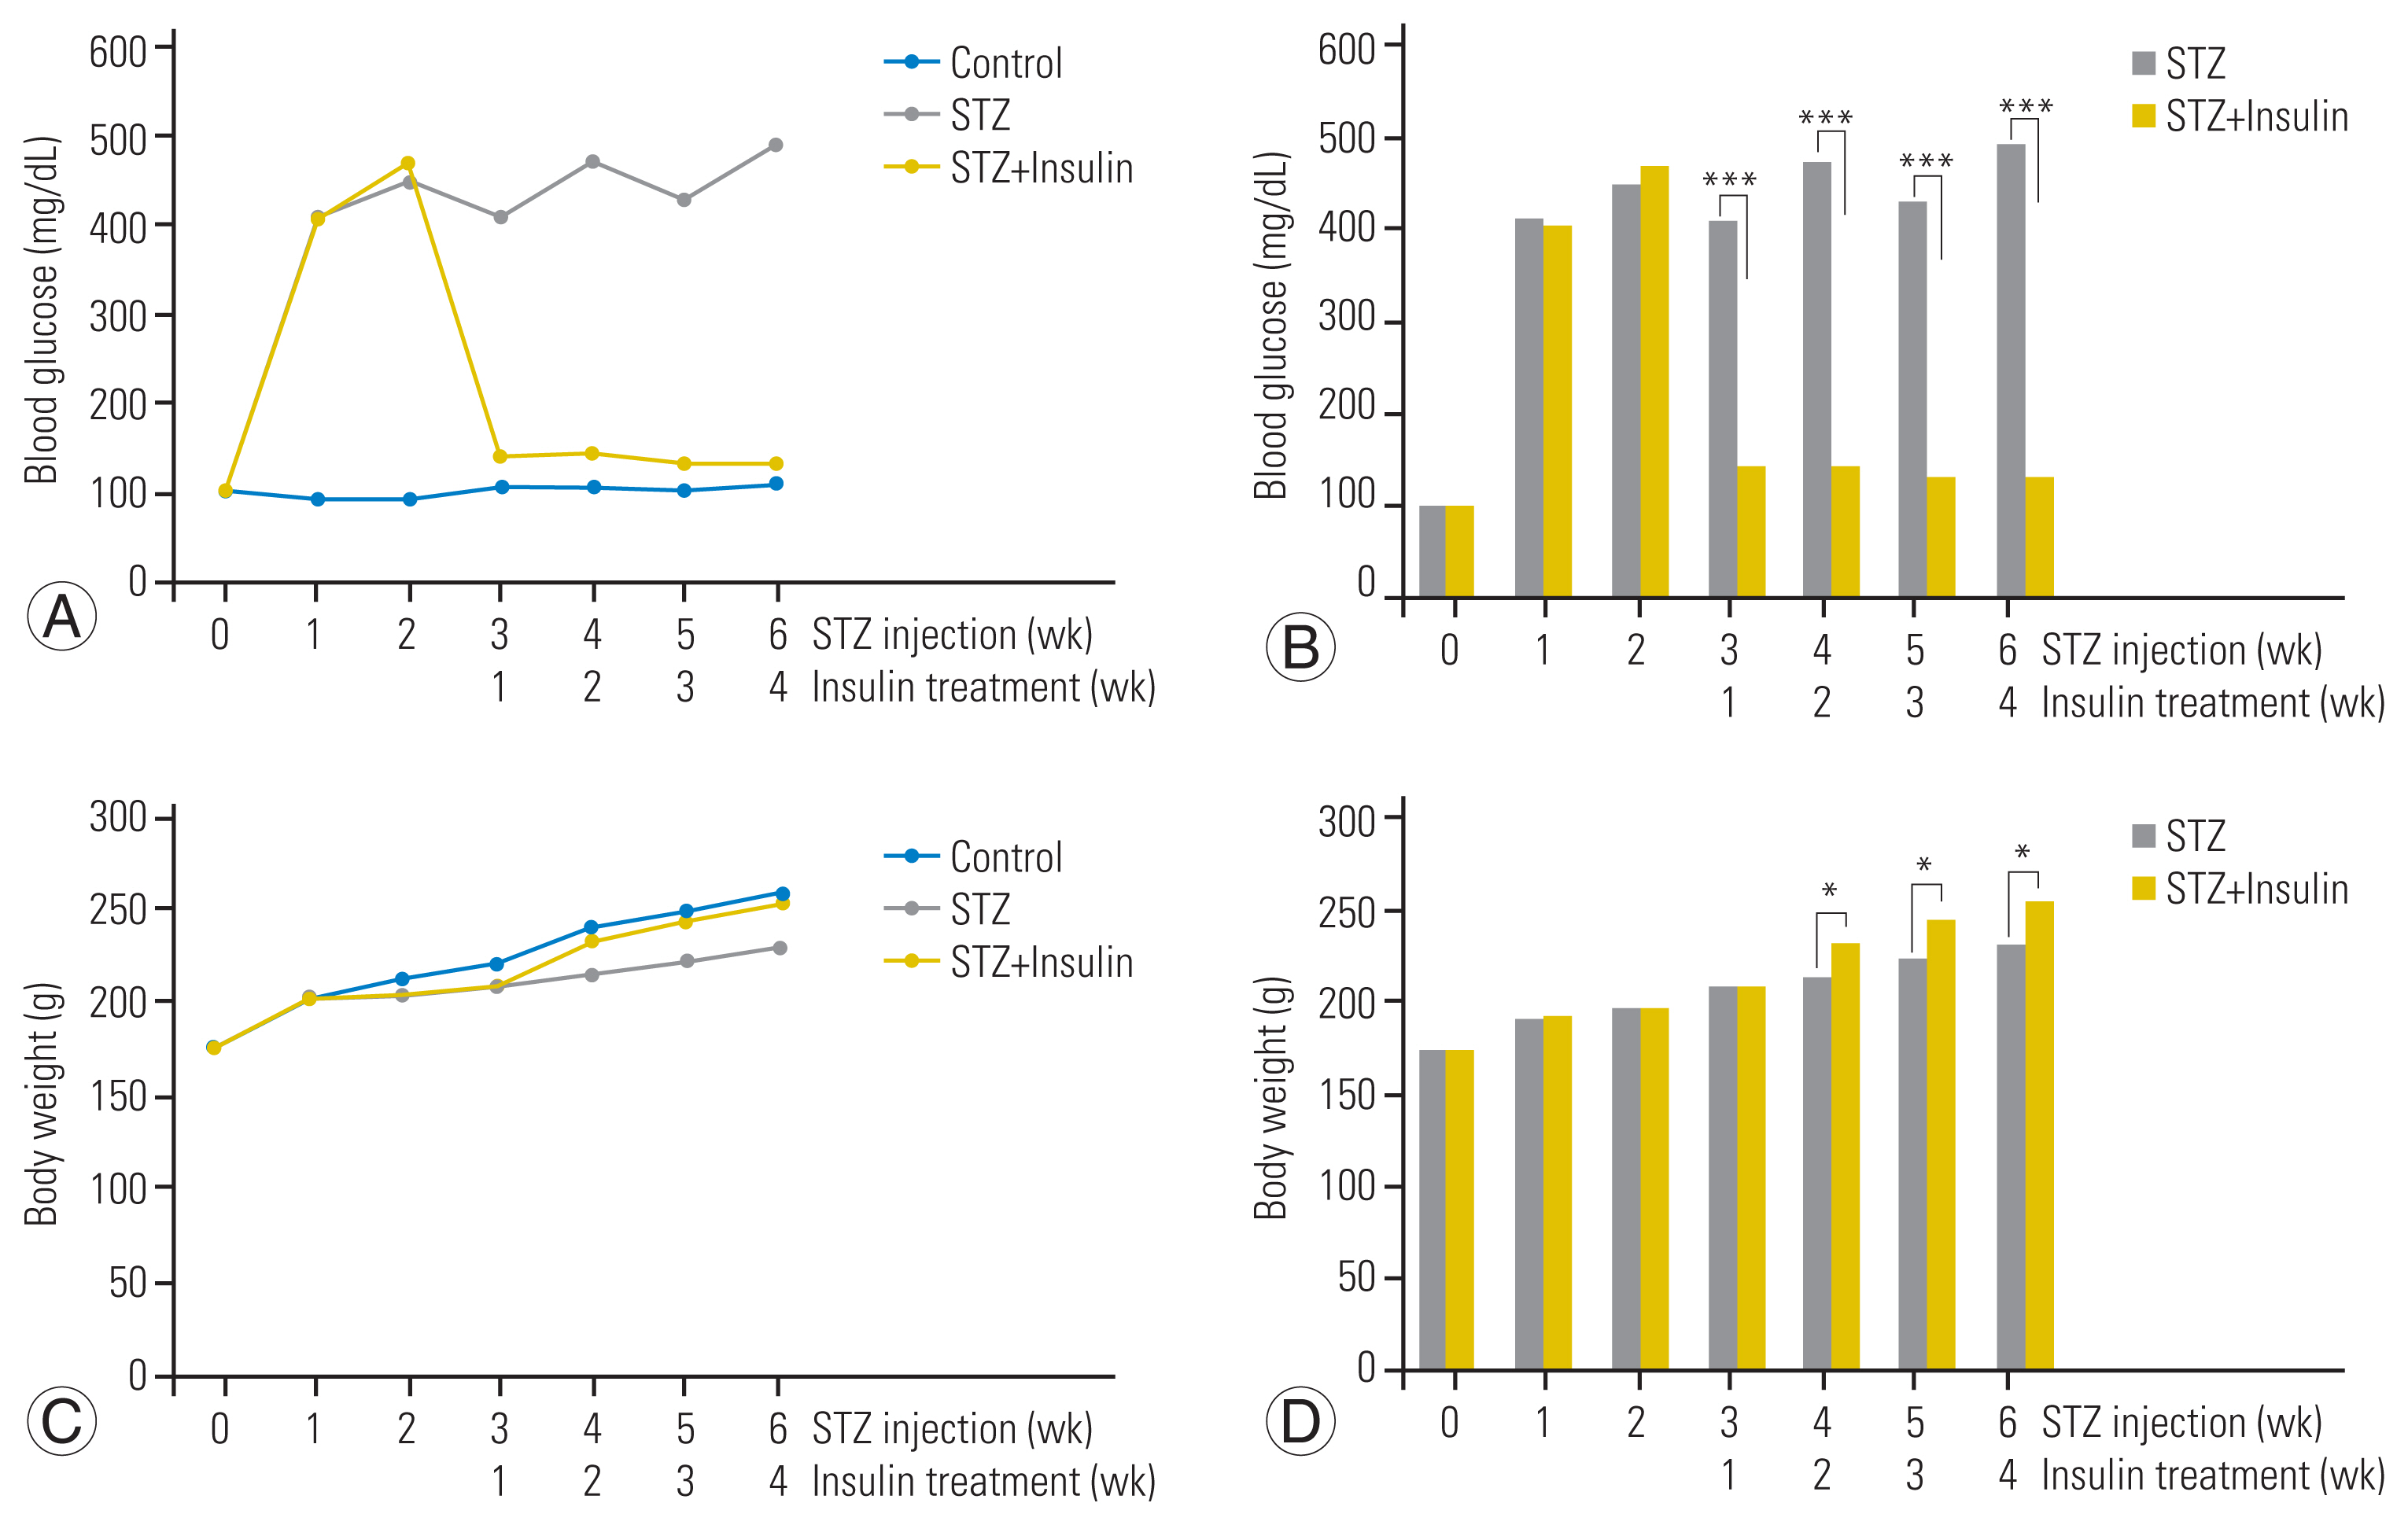
Two weeks after STZ injection, the blood glucose level of all rats in the STZ and STZ-insulin groups was confirmed to be consistently above 400 mg/dL but was not significantly different between the STZ and STZ-insulin groups (447.6±45.2 mg/dL versus 467.8±58.2 mg/dL, p=0.613) (Fig. 2A, B). However, 4 weeks after insulin treatment (6 weeks after STZ injection), the blood glucose level of the STZ-insulin rats significantly decreased to a normal level compared to that of the STZ group (133.4±16.5 mg/dL versus 489.8±69.3 mg/dL, p<0.001) (Fig. 2A, B).
Two weeks after STZ injection, STZ and STZ-insulin groups did not differ significantly in terms of body weight (203.3±3.7 g versus 204.2±3.4 g, p=0.612) (Fig. 2C, D). However, 4 weeks after insulin treatment (6 weeks after STZ injection), the STZ-insulin group weighed significantly more than the STZ group (254.2±3.1 g versus 230.0±2.5 g, p<0.05) (Fig. 2C, D).
2. Expression of Fas-mediated apoptosis pathways
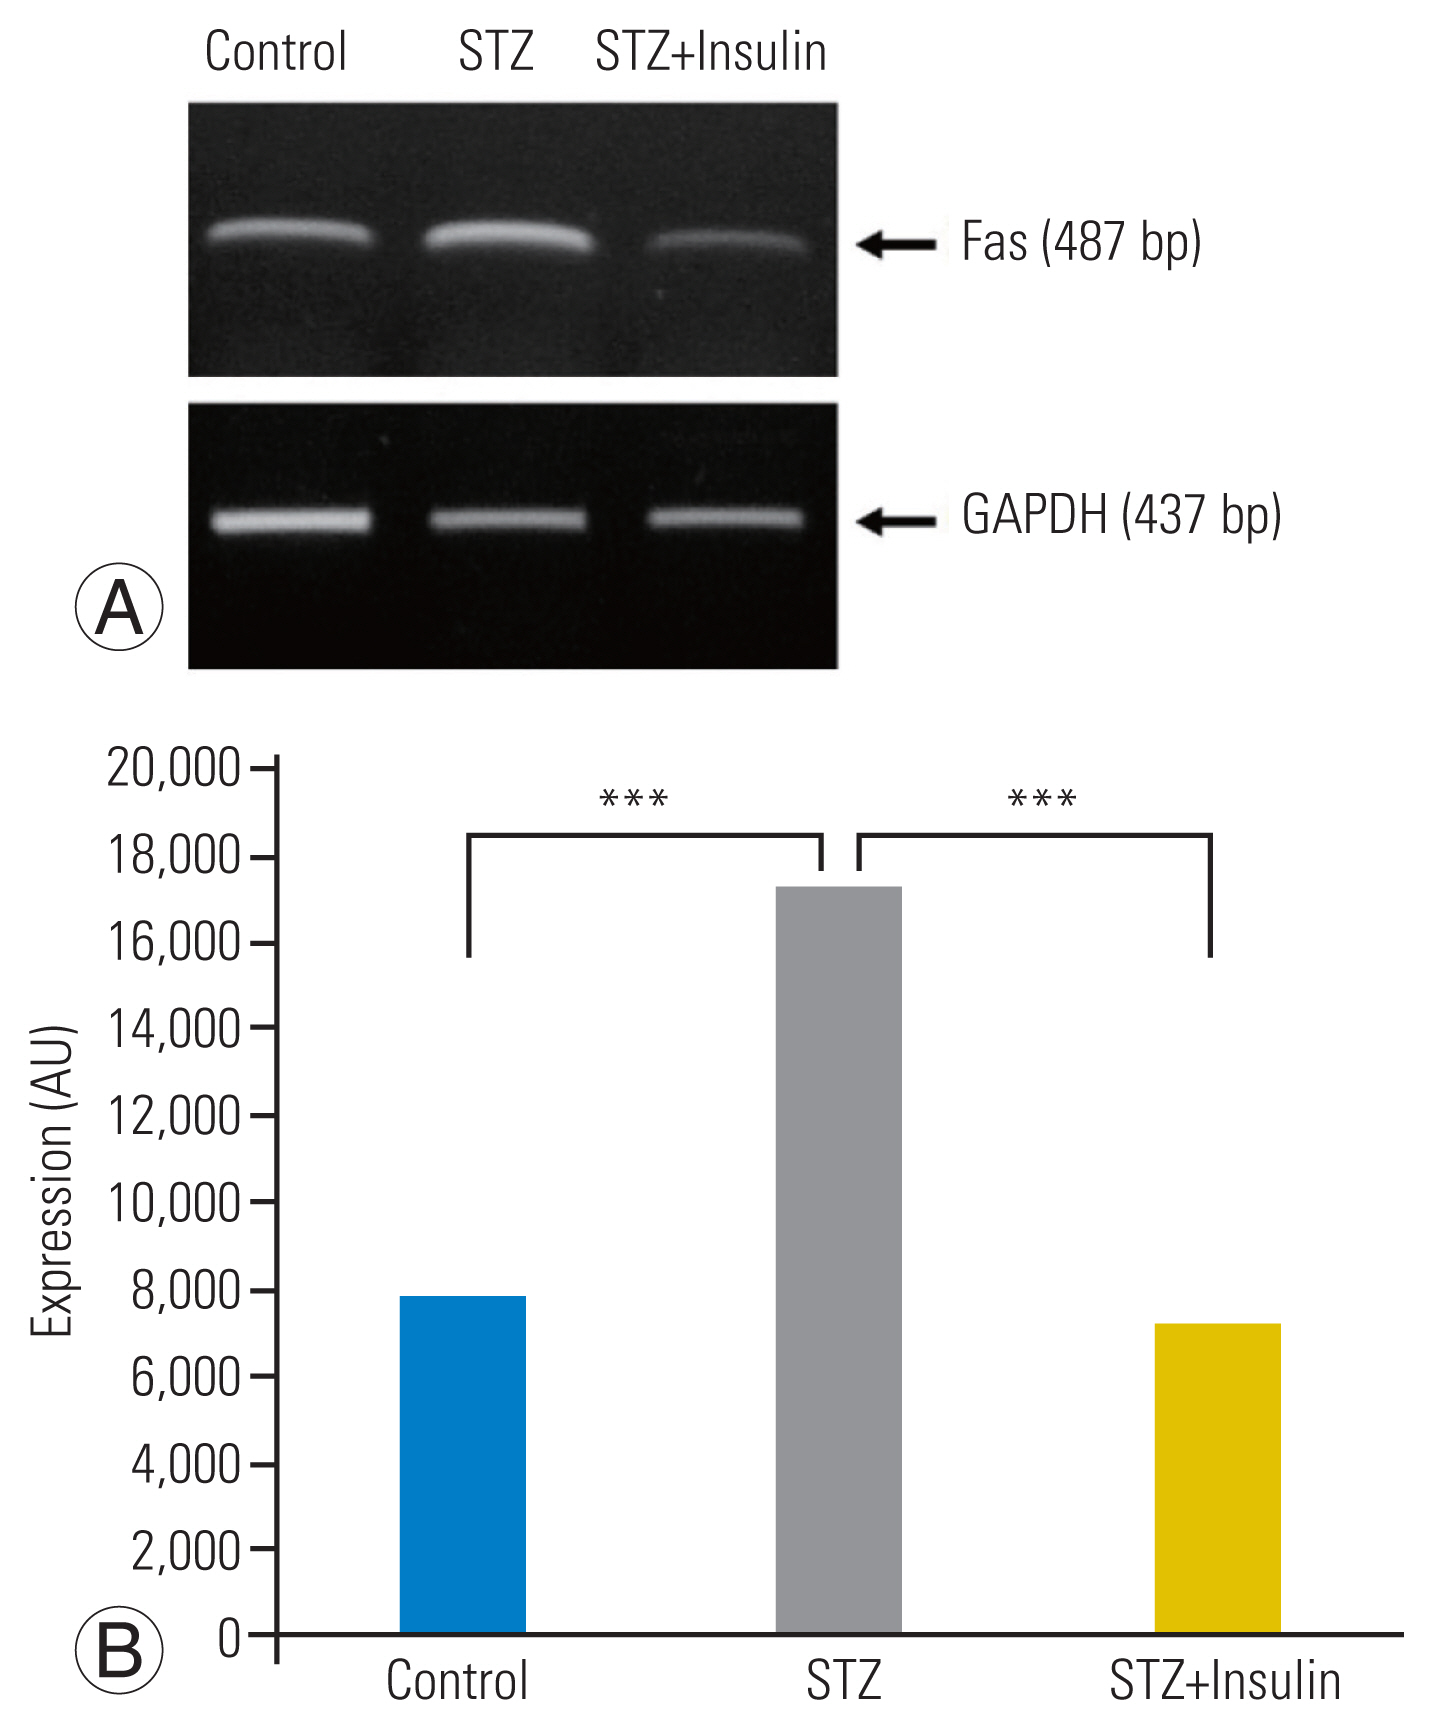
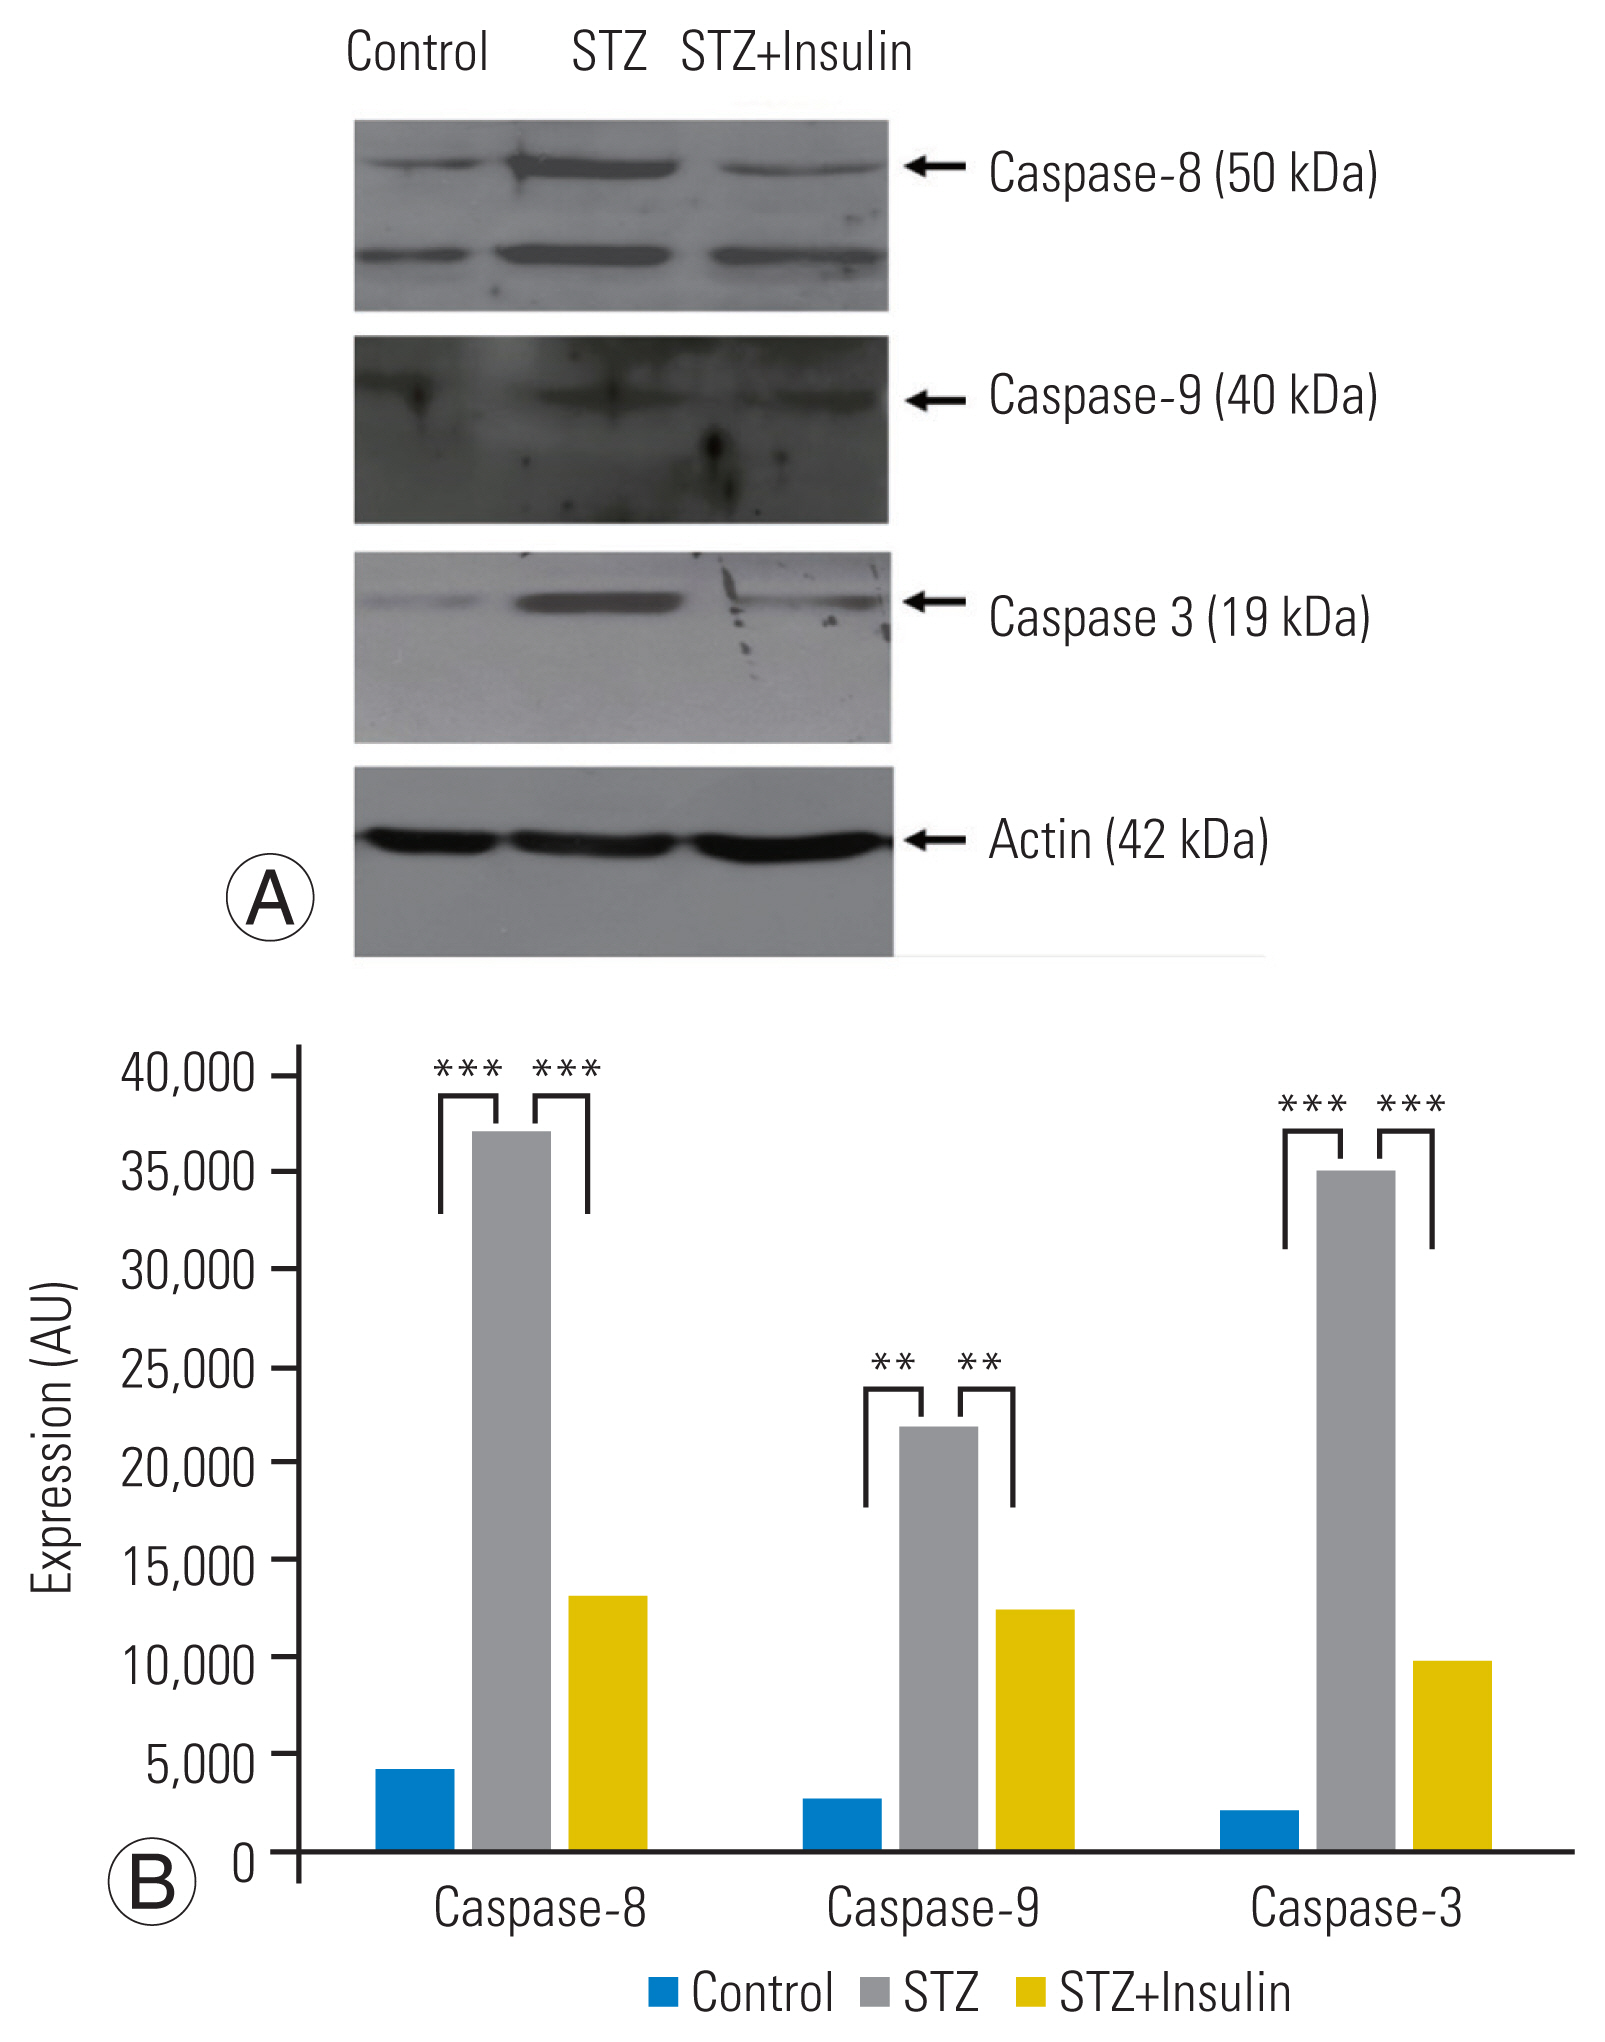
RT-PCR analysis revealed a significantly increased expression of Fas in the STZ group compared to that in the control group. However, insulin treatment significantly decreased the expression of Fas in the STZ-insulin group compared to that of the STZ group (p<0.001) (Fig. 3A, B). Western blot analysis showed that the expressions of the type-I pathway (caspase-8, p<0.001), type-II pathway (caspase-9, p<0.01), and final common executioner (caspase-3, p<0.001) were significantly increased in the STZ group compared to the control group. However, insulin treatment significantly decreased the expression of type-I pathway (caspase-8, p<0.001), type-II pathway (caspase-9, p<0.01), and final common executioner (caspase-3, p<0.001) in the STZ-insulin group compared to the STZ group (Fig. 4A, B).
3. Expression of MMP-2 and -3
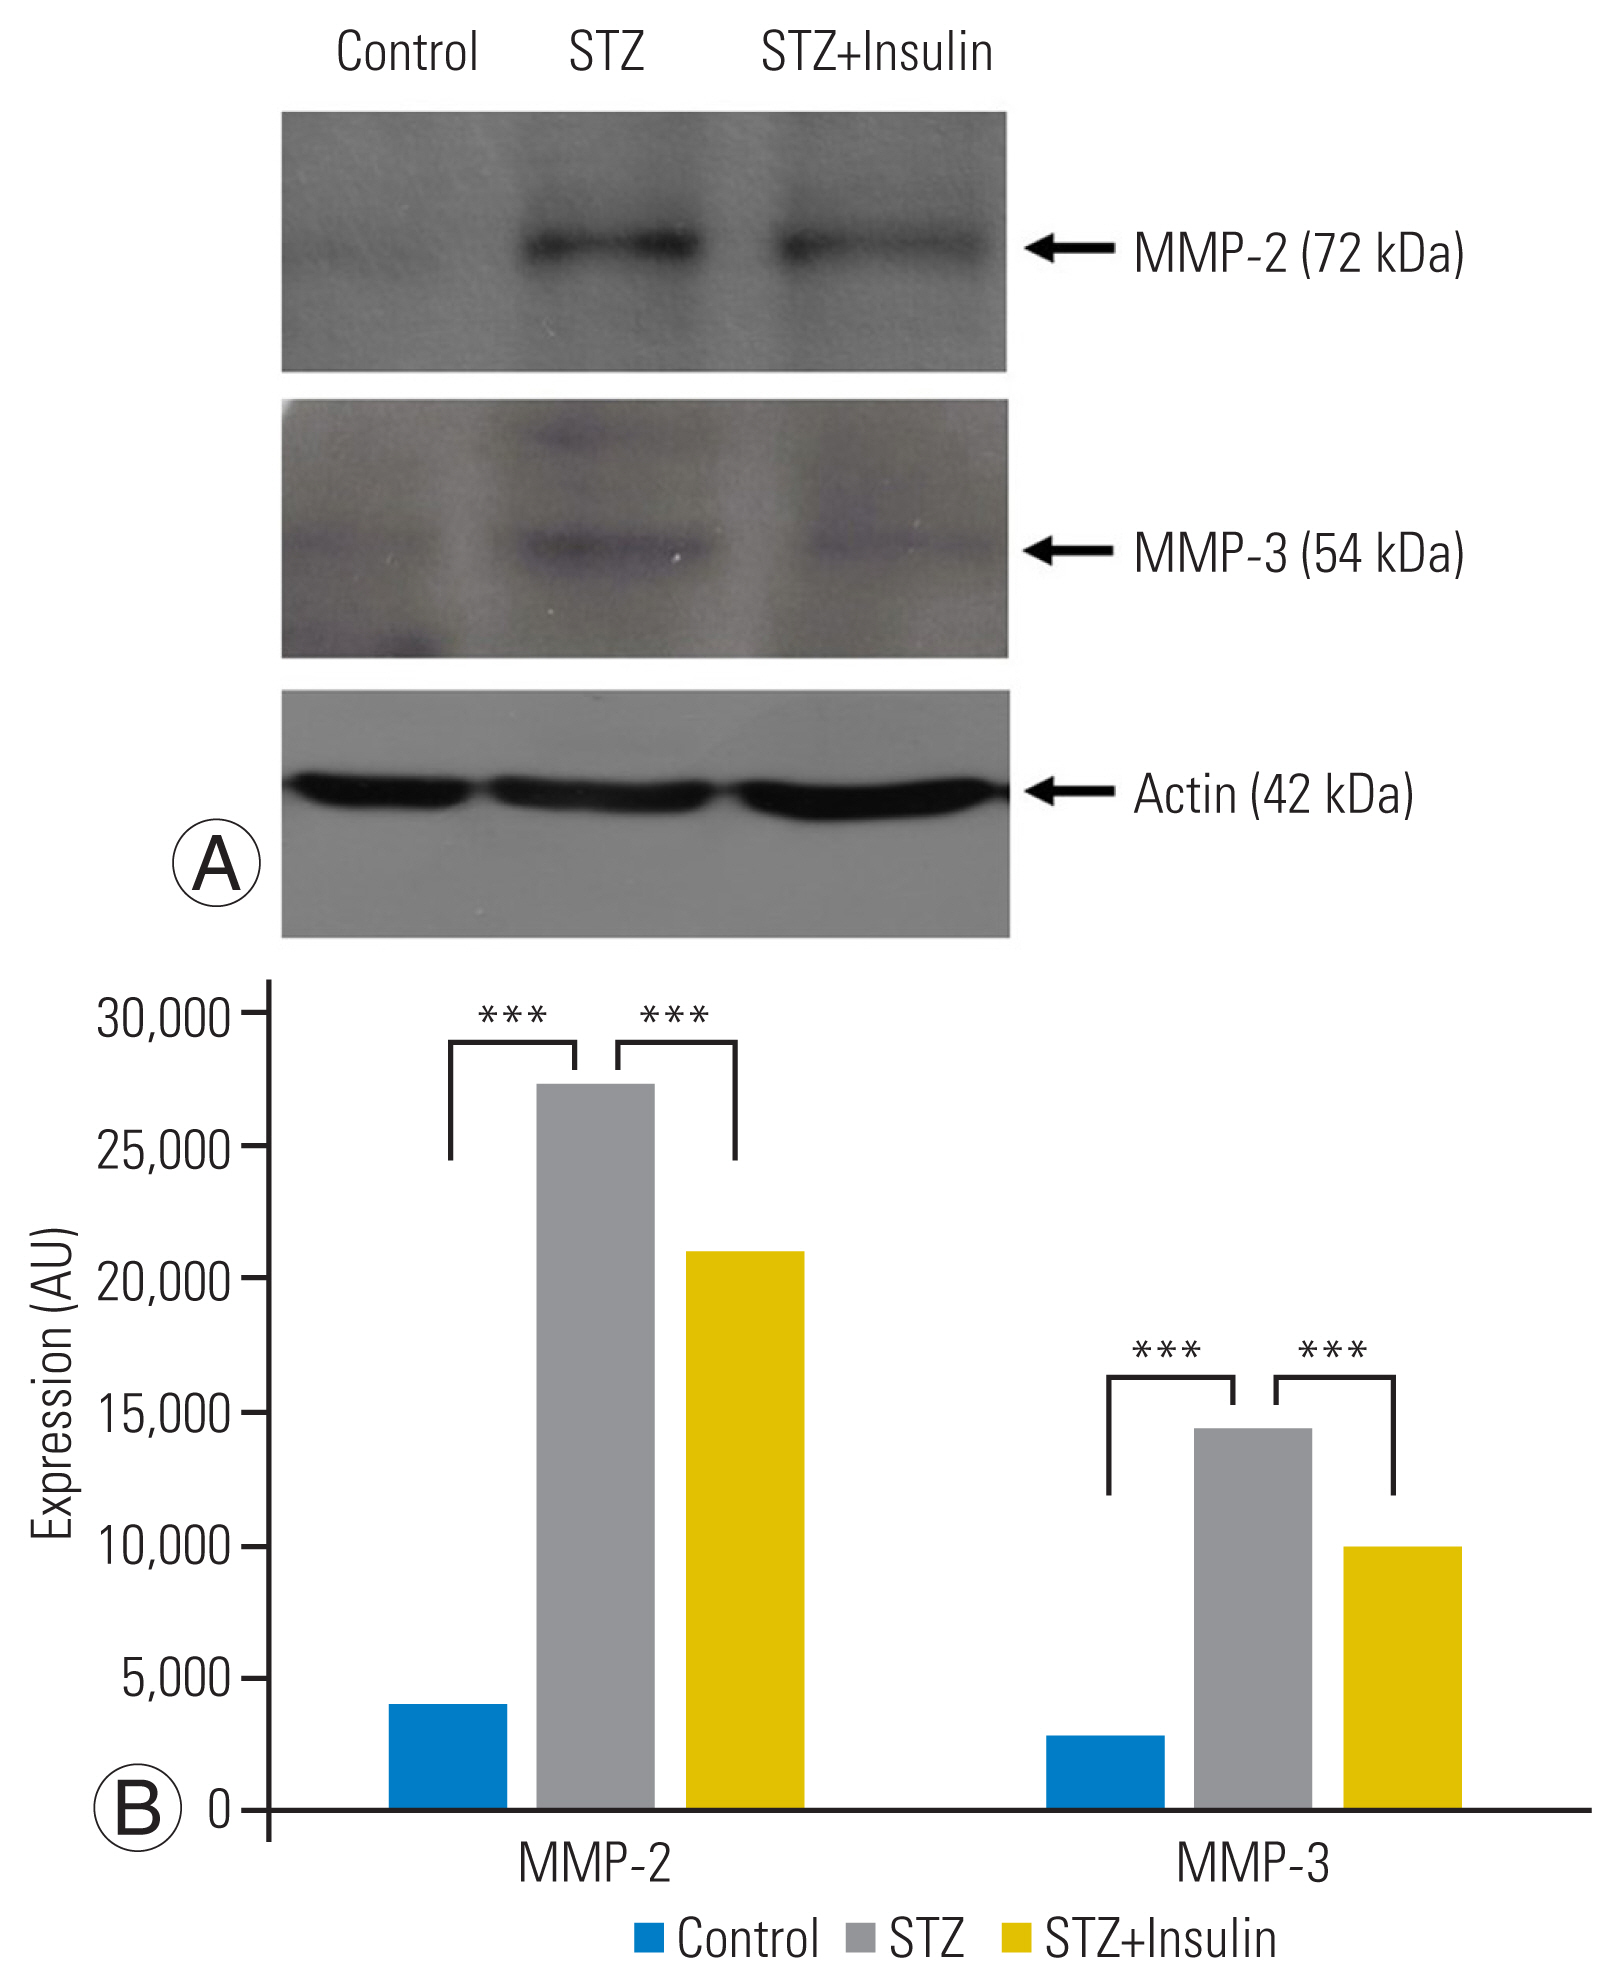
Western blot analysis showed that expression of MMP-2 (p<0.001) and MMP-3 (p<0.001) was significantly increased in the STZ group compared to that of the control group. However, insulin treatment significantly decreased the expression of MMP-2 (p<0.001) and MMP-3 (p<0.01) in the STZ-insulin group compared to the STZ group (Fig. 5A, B).
Discussion
Disc degeneration, one of the most prevalent degenerative diseases in the elderly, is characterized by excessive loss of disc cells and breakdown of the equilibrium between matrix degradation and synthesis. Park et al. [7–11] showed that hyperglycemia caused excessive Fas-mediated apoptosis of NP disc cells and matrix degradation in a genetically engineered diabetic rat model. The Otsuka Long-Evans Tokushima Fatty (OLETF) rat is a genetically engineered diabetic rat model that closely represents human type 2 diabetes [12]. The OLETF rat is characterized by mild obesity and late-onset hyperglycemia (after 4–5 months old). On the contrary, the STZ-induced diabetic rat is a chemically induced diabetic rat model that resembles human type 1 diabetes and is characterized by a loss of body weight and acute-onset hyperglycemia (3–5 days after STZ injection) [14–19].
In this study, a single peritoneal injection of STZ (65 mg/kg) successfully induced hyperglycemia three days after STZ injection, and the blood glucose level was consistently above 400 mg/dL until 6 weeks after STZ injection. Moreover, hyperglycemia decreased body weight in the STZ group compared to the STZ-insulin group. In addition, the blood glucose level of the STZ-insulin group, 1 week after insulin treatment, significantly decreased to a normal level and remained below 140 mg/dL until 4 weeks after insulin treatment. The results of the current study, which were consistent with those seen in human type 1 diabetes, suggest that the STZ-induced diabetic rat model is useful for various types of translational research projects related to disc degeneration and diabetes.
The results of the current study also demonstrated that STZ-induced diabetic rats underwent excessive apoptosis of NP disc cells simultaneously through Fas-mediated type-I and type-II pathways. The expression of type-I (caspase-8) and type-II (caspase-9) pathway proteins was significantly increased in the STZ group compared to the control group. In a previous study using the OLETF diabetic rat model, excessive Fas-mediated apoptosis of NP disc cells was identified but did not further investigate the apoptosis pathway [12]. Therefore, whether the pathways of Fas-mediated apoptosis in NP disc cells are similar between types 1 and 2 diabetes cannot be explained. Even in a similar cell phenotype, the apoptosis pathway can differ depending on the type of apoptotic stimulus.
The most important result of this study was that insulin treatment significantly decreased Fas expression in STZ-insulin rats compared to that in STZ rats. Diabetic patients have a higher incidence of degenerative disc diseases than nondiabetics and they undergo spine surgery more frequently [1,2], which can be attributed to the excessive apoptosis of disc cells in diabetic patients compared to nondiabetic people. Therefore, strict blood glucose control is purported to play a therapeutic role in slowing or delaying disc degeneration in diabetic patients. It is believed that this is the first study to demonstrate in vivo evidence that successful control of diabetes can reduce excessive Fas-mediated apoptosis of NP disc cells in diabetic rats.
MMP-2 and -3 degrade extracellular matrix components based on their substrate specificity [20,21]. Increased MMP-2 and -3 expressions are responsible for disc degeneration and disc herniation [12]. In this study, hyperglycemia significantly increased the expression of MMP-2 and -3 in the NP disc cells and tissue of STZ rats. On the contrary, insulin treatment significantly decreased MMP-2 and -3 expressions. The results of the current study suggest that successful control of diabetes could attenuate matrix degradation of NP disc tissues, thereby helping slow or delay disc degeneration in diabetic patients.
The primary limitation of this study is that terminal deoxynucleotidyl transferase dUTP nick end labeling assay or immunohistochemical study was not performed. However, based on the results of previous studies, Fas-mediated apoptosis was speculated to occur in the NP disc cells of STZ-induced diabetic rats and was reduced significantly by insulin treatment.
Conclusions
In conclusion, the results of the current study showed that insulin treatment attenuated excessive Fas-mediated apoptosis of NP disc cells and matrix degradation. Therefore, strict blood glucose control should be recommended to prevent disc degeneration in diabetic patients. This study was the first to demonstrate the therapeutic effect of insulin treatment on intervertebral disc cell apoptosis in the diabetic rat model.


