Quantifying Bone Marrow Edema Adjacent to the Lumbar Vertebral Endplate on Magnetic Resonance Imaging: A Cross-Sectional Study of Patients with Degenerative Lumbar Disease
Article information
Abstract
Study Design
Cross-sectional study.
Purpose
We aimed to quantitatively assess bone marrow edema (BME) on magnetic resonance imaging (MRI) for patients with degenerative lumbar diseases.
Overview of Literature
BME adjacent to a sclerotic endplate of the lumbar spine, detected using T2-weighted fat-saturated MRI, is closely associated with low back pain in patients with degenerative lumbar diseases. However, currently, there no quantitative evaluation methods for BME adjacent to the vertebral endplate.
Methods
Patients with degenerative lumbar diseases, whose MRIs detected BME, were enrolled. On a T2-weighted fat-saturated MRI, BME appeared as a high-intensity region adjacent to the vertebral endplate. We calculated the contrast ratios (CRs) of BME and normal bone marrow using the signal intensities of BME, normal bone marrow, and the spinal cord. On computed tomography, we calculated Hounsfield unit (HU) values in the same area as BME, the sclerotic endplate, and normal bone marrow to assess bone density.
Results
There were 16 men and 14 women, with an average age of 73.5 years. The mean CRs of BME and normal bone marrow were −0.015±0.056 and −0.407±0.023, respectively. BME’s CR was significantly higher than that of normal bone marrow (p<0.01). The HU values in the same area as BME, the sclerotic endplate, and normal bone marrow were 251.9±24.6, 828.3±35.6, and 98.1±9.3, respectively; these values were significantly different from each other (p<0.01).
Conclusions
The CR on MRI is a useful quantitative assessment tool for BME in patients with degenerative lumbar diseases.
Introduction
With an aging global population, low back pain (LBP), associated with lumbar degenerative diseases, has become a leading cause of functional disability and mental deterioration in the elderly. In the previous decade, most studies have focused on radiological parameters, such as global alignment and sagittal balance, as the cause of LBP in lumbar degenerative diseases. However, qualitative evaluations, such as magnetic resonance imaging (MRI), are lacking. Recent LBP studies have given more attention to the association of the vertebral endplate and LBP in elderly subjects [1,2]. Modic et al. [3] reported signal changes of the vertebral bone marrow extending from the vertebral endplate on MRI. In particular, they found a close association between bone marrow edema (BME) adjacent to an osteosclerotic vertebral endplate and LBP [4,5]. On a T2-weighted fat-saturated MRI, BME appears as a high-intensity region. However, there are currently no quantitative evaluations of BME adjacent to the vertebral endplate.
It is impossible to compare the signal intensity (SI) of the lesions directly on MRI because these can change depending on the imaging conditions [6]. The SI of MRI changes dynamically, depending on the machine’s receiver gain. Therefore, there is no way to compare MR signals between different patients or different machines directly. In order to compare the MR signals, the subject’s SI must be normalized with a common or similar substance. In radiology, the contrast ratio (CR) provides more objective and quantitative parameters [7]. The CR might provide quantitative information on the spinal issue experienced by patients with lumbar degenerative diseases. In the present study, we normalized the subject’s signal using a spinal cord that is known to have limited variability among patients and defined this as CR. The present study aimed to quantitatively evaluate the BME adjacent to the osteosclerotic lumbar vertebral endplate in patients with degenerative lumbar diseases using the CR on MRI.
Materials and Methods
1. Patients
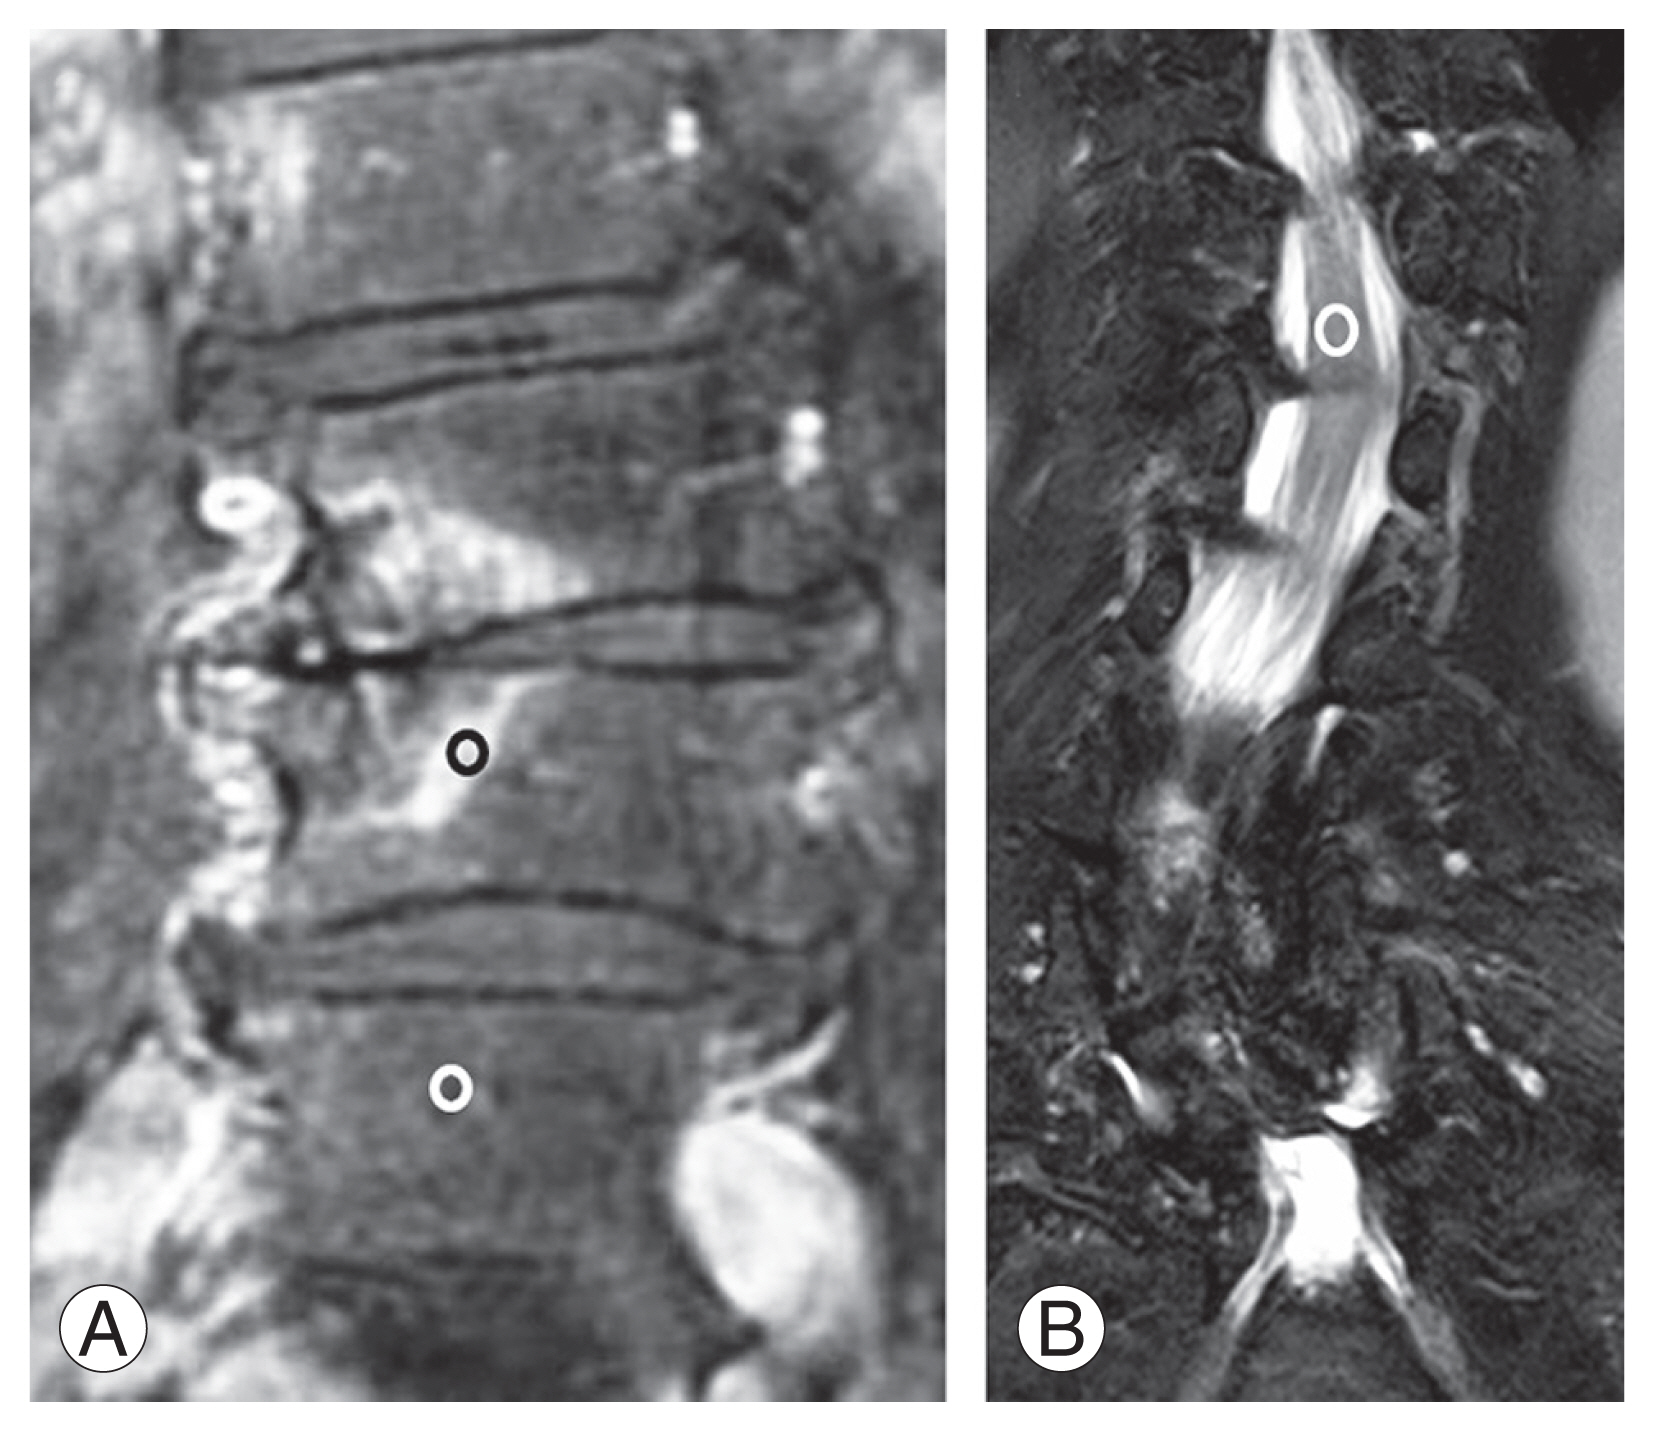
This cross-sectional observational study examined patients at Hiroshima University Hospital and JA Hiroshima General Hospital with lumbar degenerative diseases and accompanying LBP. We enrolled subjects who had LBP for >6 months and had a score of >50 mm on a Visual Analog Scale (VAS) (range, 0–100 mm; with 0 mm indicating no pain) in the study [8]. We included patients with lumbar BME on MRI and a lumbar tenderness point on the BME lesion. We defined BME as the area of bone showing a low or intermediate SI value on T1-weighted images and a high SI value on T2-weighed fat-saturated images, compared to equivalent values from normal bone marrow (Fig. 1A) [9]. BME existed in the vertebral bone marrow extending from the sclerotic vertebral endplate (Fig. 1A, B). The study excluded patients with infectious diseases or tumorous conditions of the spine. This study was approved by the institutional review board of Hiroshima University (approval no., E-1352), and all patients provided informed consent for participation.

Bone marrow edema is defined as the area of bone which shows a high signal intensity value on T2-weighed fat-saturated magnetic resonance imaging (MRI). (A) T2-weighted fat-saturated coronal image of MRI. Bone marrow edema exists in the vertebral bone marrow extending from the sclerotic vertebral endplate. (B) Coronal image of computed tomography.
2. Radiological investigation
We evaluated the outcomes of plain radiographs from the Cobb angle [10]. We performed high-resolution MRI, using T1-weighed images and T2-weighed fat-saturated images (Ingenia 3.0T; Philips Medical Systems, Amsterdam, The Netherlands), Vantage Titan 3.0T (Canon Medical systems, Otawara, Japan), 1.5T EX-HDX (GE Healthcare, Chicago, IL, USA), and 1.5T EX-HDX TWIN (GE Healthcare), for all the subjects. To assess bone density, we used computed tomography (CT) examinations to calculate the Hounsfield unit (HU) values by placing the regions of interest (ROIs) on the same area as BME, the sclerotic endplate, and normal bone marrow. Observers with >15-year experience (N.K. and K.Y.), who were blinded to the patients’ data, performed radiological examinations twice for each patient; we used the two observations’ average values in this study.
3. Magnetic resonance imaging contrast ratio
We obtained the SI values of BME on T2-weighed fat-saturated MRI of the patients, and the ROIs were manually placed in the center of the BME and measured (SIedema) by two observers, as mentioned. We measured SIedema in the highest-intensity zone in the bone edema. We measured ROIs over 50 pixels for each point manually to decrease image bias. The SI values of the vertebral bone marrow at the adjacent normal vertebrae were obtained, and the ROIs were measured (SIcontrol). We also obtained the spinal cord’s SI values at the T12 level and measured the ROIs (SIcord) (Fig. 2). To obtain the CR values of BME (CRedema) and the normal vertebrae (CRcontrol), we used the SI values of the spinal cord per the following formulas [11]:
The signal intensity values of the bone marrow edema on T2-weighed fat-saturated magnetic resonance imaging in the patients were obtained, and the range of interests were manually placed in the center of the bone marrow edema and were measured (SIedema). The signal intensity values of the vertebral bone marrow at the adjacent normal vertebrae were obtained, and the range of interests were taken (SIcontrol). The signal intensity values of the spinal cord at the T12 level were also obtained, and the range of interests were taken (SIcord). (A, B) T2-weighted fat-saturated coronal image.
4. Statistical analyses
We compared the edematous bone marrow area’s parameters and normal bone marrow area using the Mann-Whitney U-test to analyze the patients’ MRI data. To analyze the CT data, we compared the area parameters equivalent to BME, the sclerotic endplate, and normal bone marrow using one-way analysis of variance, followed by Tukey’s post-hoc test. We calculated correlations between the image findings and LBP using Pearson’s correlation coefficient. A p-value <0.05 was statistically significant for a two-sided hypothesis. All the values are expressed as the mean±standard deviation.
Results
1. Patient characteristics
There were 30 patients with lumbar degenerative disease and LBP, including 25 patients with lumbar scoliosis, three with lumbar spondylolisthesis, and two with lumbar canal stenosis. The subjects included 16 men and 14 women, with an average age of 73.5 years (range, 37–88 years). The mean VAS score for LBP severity was 74 mm (range, 50–95 mm) (Table 1).

Patients characteristics data
2. Radiological findings
There were 25 patients (83.3%) with degenerative lumbar scoliosis with a Cobb angle of >10° on plain radiography. Among these patients, the lumbar spine’s mean Cobb angle was 18.1° (range, 10°–52°).
On CT, the mean HU values in the same area as BME, the sclerotic endplate, and normal bone marrow were 251.9±24.6, 828.3±35.6, and 98.1±9.3, respectively; these values were significantly different from each other (p<0.01) (Fig. 3).

The Hounsfield unit values on computed tomography. Hounsfield unit values in the same area as bone marrow edema, the sclerotic endplate, and normal bone marrow were significantly different from each other. *p<0.01.
On MRI, all the patients showed BME in the vertebral bone marrow extending from the vertebral endplate. The mean SI values of BME, the spinal cord, and normal bone marrow were 716.4±148.9, 628.5±121.2, and 229.1±33.7, respectively; the SI of BME (p<0.01) and the SI of the spinal cord (p<0.05) were significantly higher than that of normal bone marrow. The mean CRs of BME and normal bone marrow were −0.015±0.056 and −0.407±0.023, respectively. The CR value of BME was significantly higher than that of normal bone marrow (p<0.01) (Fig. 4).

The contrast ratios on magnetic resonance imaging. The contrast ratio value of bone marrow edema (CRedema) was significantly higher than that of normal bone marrow (CRcontrol). *p<0.01.
All the correlations between CR or HU values and LBP intensity were either not observed or were weak. The correlations of the CR values of BME and VAS (r=−0.183), the HU values in the same area as BME and VAS (r=−0.218), and the CR values of BME and the HU values in the same area as BME (r=0.132) were not significant (all p>0.05) (Table 2).
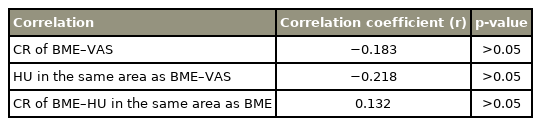
The correlations between the CR of BME, the HU values, and VAS of low back pain
Discussion
This cross-sectional study found that assessing the CRs of BME adjacent to the vertebral endplate on MRI was a useful quantitative tool for evaluating lumbar endplate lesions. The CR value of BME was higher than the CR value of normal bone marrow in patients with lumbar endplate lesions.
Modic et al. [3] reported signal changes in the vertebral bone marrow extending from the vertebral endplate on MRI. They classified signal changes into the following three types on MRI. Type 1 (edema type) is hypo-intense on T1- and hyper-intense on T2-weighted MRI, type 2 (fatty type) is hyper-intense on T1- and iso- or hyper-intense on T2, and type 3 (sclerotic type) is hypo-intense on T1- and T2. Different Modic types might represent the different stages of one pathological process in the vertebral endplate [12,13]. However, the T2-weighted fat-saturated MRI in Modic changes have not been mentioned, and sometimes two different types of signal change might co-exist in one vertebra. BME, the high-signal pattern area, observed on T2-weighted fat-saturated MRI in the subchondral bone marrow of the vertebral endplate, is a lesion that is considered an inflammatory reaction of the bone marrow [9,14]. Thus far, BMEs adjacent to the vertebral endplate are scored as the following three grades, depending on BME size: grade 0 (no findings of BME), grade 1 (BME affecting less than half of the height of the vertebral body), and grade 2 (BME affecting more than half of the height of the vertebral body) [4]. However, this classification is not a quantitative method, and the evaluated data are not continuous variables.
To measure the MRI value quantitatively, we usually need to use special MRI techniques, such as T2 mapping and T1 ρ mapping, because the SI values on MRI can change depending on the imaging conditions [15]. Some studies have evaluated the vertebral endplate’s signal change on MRI; however, they did not use the SI of the spinal cord and did not normalize the values [16]. Recently, the CR has been reported as a quantitative parameter for analyzing human tissues in radiology [11]. The CR indicates the relative difference in the signal between different tissues and can act as an independent MRI parameter [17]. In our study, we used the SI of the spinal cord as a control material. We can acquire the SI of the spinal cord in the thoracolumbar transition when taking the lumbar MRI with reasonably limited diffusion because the spinal cord tends not to be affected by degeneration [16,18].
Although some studies have reported on the use of CRs on MRI in the pulmonary and liver fields [7], few trials have reported on CR use in spine research [19,20]. In the present cross-sectional study, the CR value of BME adjacent to the vertebral endplate was significantly higher than that in the normal bone marrow. Although it is unclear what the CR of the BME itself means histopathologically, we were able to assess the quantitative value of BME adjacent to the vertebral endplate on MRI and establish that the CR value of BME was significantly higher than that of normal bone marrow. An area of high signal change on T2-weighed fat-saturated MRI may indicate inflammation and increased bone vascularity with high turnover and could be related to water-rich tissue [21]. Therefore, the high CR value of BME in this study might reflect high inflammation or accentuation of bone turnover.
Vertebral bone marrow signal changes (Modic changes) on MRI are associated with LBP in several studies [22]. Moreover, BME adjacent to an osteosclerotic vertebral endplate on MRI is closely associated with LBP [4,5]. One study correlated LBP severity with the degree of BME [4]. In contrast, our study shows no correlation between CR values and LBP severity. These studies differ in that the former focused on the extent of BME, while we focused on the SI of BME on MRI. Our findings agreed with those reported in a study showing no clinically relevant correlations with short tau inversion recovery signal increase on MRI [23]. The association between LBP severity and BME on MRI is controversial; further research is necessary to confirm any correlation between LBP severity and BME.
In vertebral bone marrow signal changes on MRI in patients with LBP, fibrosis, inflammation, and high bone turnover have been reported [24]. There may be some bone metabolic change in the vertebral endplate. BME adjacent to the vertebral endplate on MRI often appears around the osteosclerotic lesion on CT. BME with bone sclerosis might be explained by new bone formation [25]. BME and bone sclerosis sometimes co-exist under conditions of osteoblastoma and osteoid osteoma [26]. It is important to know what happens in the BME area. BME is connected to an osteoclastic environment in a mouse arthritis model [27]. Subchondral bone osteoclasts induce neuropeptides, such as calcitonin gene-related peptide (CGRP) [28], and CGRP accelerates bone formation in the subchondral bone [29]. In fact, in our study, the HU values in the same area as BME were higher than that in the normal bone marrow.
Our study has certain limitations. First, there was a lack of longitudinal evidence for the relationship between the image findings and clinical symptoms. Second, we did not collect histological data. Third, the number of patients was insufficient to detect a correlation between the image findings and clinical symptoms.
Conclusions
The BME’s CR value was significantly higher than the CR value of normal bone marrow. The CR for BME adjacent to the vertebral endplate on MRI is a useful quantitative assessment tool for endplate lesions with degenerative lumbar diseases.
Notes
Conflict of Interest
No potential conflict of interest relevant to this article was reported.
Author Contributions
Toshio Nakamae wrote and prepared the manuscript, and all of the authors participated in the study design. All authors have read, reviewed, and approved the article.