


Introduction
Intraoperative neurophysiological monitoring (IONM) is the standard of care during spine surgeries. IONM provides real-time feedback of impending or potential new neurological deficits and the opportunity for corrective action before an insult causes permanent neurological damage [1,2]. However, the diagnostic performance of IONM depends on selecting the appropriate monitoring techniques, based on surgical, anesthetic, and patient-related factors [2]. Transcranial motor evoked potentials (TcMEPs) effectively monitor the integrity of the motor pathway during spine surgery with a sensitivity and specificity as high as 100% and 95%ŌĆō100%, respectively [3,4]. However, successful TcMEP monitoring is critically dependent on the anesthetic technique; some anesthetic agents suppress TcMEP signals at commonly used concentrations, leading to inconsistent TcMEP recordings. Total intravenous anesthetics (TIVAs) are superior to inhalational agents for TcMEP monitoring [5]. TIVA, using propofol and a synthetic narcotic, is the most commonly used anesthetic regimen for TcMEP monitoring [6]. However, propofol inhibits TcMEP amplitude in a dose-dependent fashion [6,7]. Moreover, high dose propofol is associated with hypotension; thus, propofol is unsuitable for patients with hemodynamic and cardiovascular instability.
Ketamine [8], dexmedetomidine [9], and lidocaine [10] have been used as adjuvants to reduce propofol requirements with variable effects on TcMEPs. The ketamineŌĆōpropofol admixture (ketofol) has been used successfully in various procedures and produces rapid onset of sedation, appropriate hemodynamic conditions, and rapid recovery [11,12]. However, no study has evaluated the effects of ketofol infusion (ketamineŌĆōpropofol, 1:4 admixture) on TcMEPs during general anesthesia maintenance.
The primary objective of this study was to compare the effects of propofol versus ketofol on amplitudes and latencies of TcMEPs, when these agents are used with fentanyl for the maintenance of general anesthesia during thoracolumbar spine surgery. The secondary objectives included comparing intraoperative hemodynamic parameters between the two anesthetic regimens and comparing muscle power at hospital discharge. We hypothesized that the addition of low-dose ketamine to propofol TIVA would exert a favorable effect on TcMEPs.
Materials and Methods
1. Study design
In this study, 38 patients undergoing elective lower thoracic (below T5) and lumbar spine surgery with TcMEP monitoring were enrolled. Approval was obtained from the Institutional Ethics Committee of All India Institute of Medical Sciences, New Delhi (IECPG-594/20.12.2017, RT-71/31.01.2018), and written informed consent was obtained from all patients. The study is registered in the Clinical Trial Registry of India (REF/2017/12/016146).
Inclusion criteria included age between 18 and 65 years, American Society of Anesthesiologists (ASA) physical statuses I and II, upper extremity muscle power 5 (Medical Research Council Muscle Power Grading), and lower extremity muscle power Ōēź3. The exclusion criteria included the patientŌĆÖs refusal to consent, upper extremity muscle power <5 or lower extremity muscle power <3, pre-existing myopathies, morbid obesity, and a history of coronary artery disease, chronic renal and hepatic insufficiency, allergies to any study medications, seizures, or psychiatric disease.
2. Sample size determination
Sample size was calculated to detect effect size for mean amplitude or latency between the two groups up to 0.9 per standard deviation (SD) or more, with 95% confidence levels and 80% power. The calculated sample size was 19 evaluable patients per group. Thus, 38 patients were enrolled in the study.
3. Randomization, group allocation, and intervention
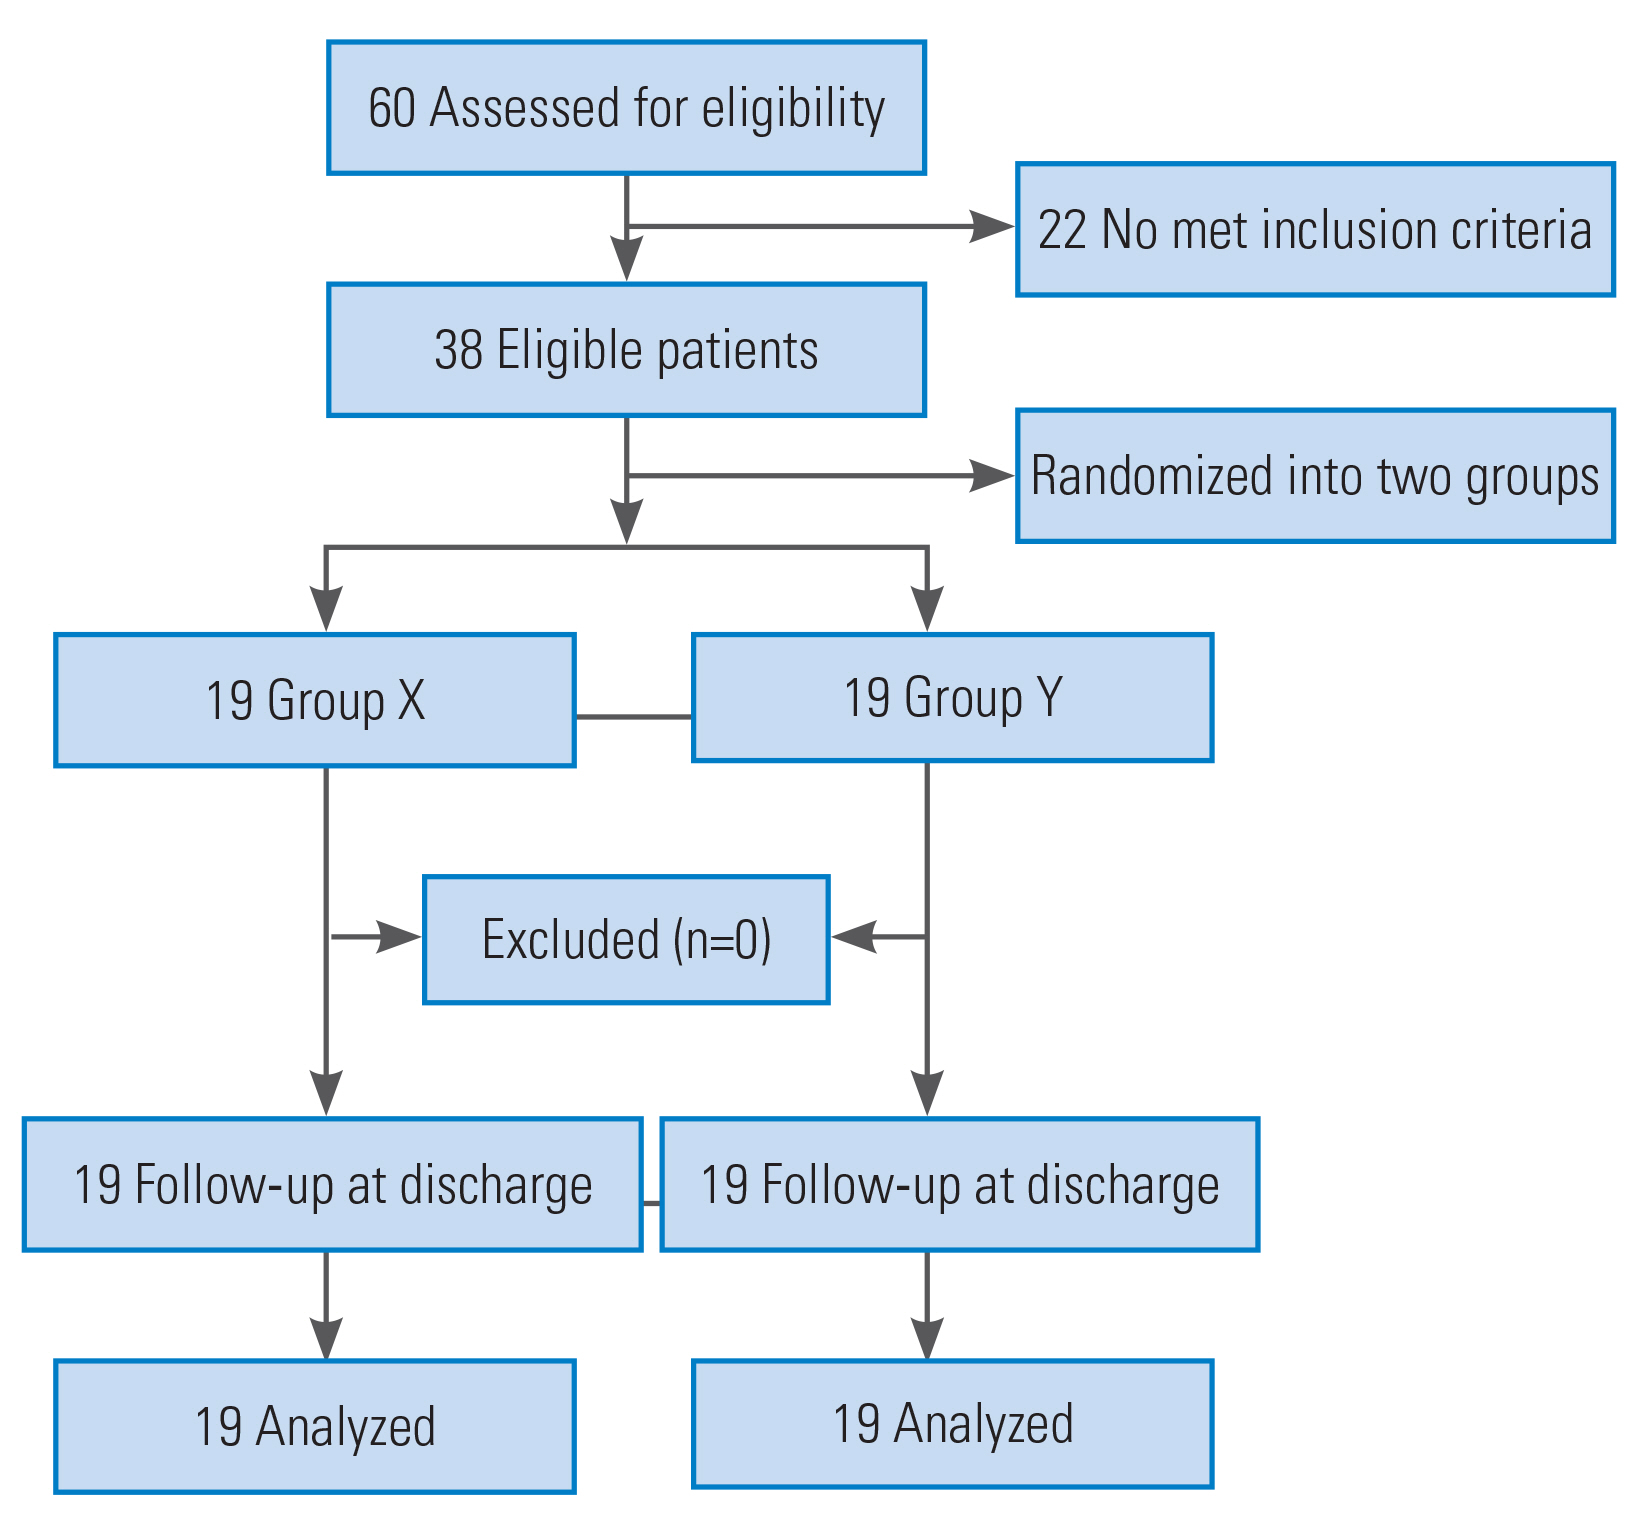
Sixty patients were assessed for eligibility, and 38 patients met the inclusion criteria (Fig. 1). The patients were allocated into two groups in a 1:1 ratio using computer-generated block randomization. Opaque sealed envelopes were used for group allocation, and the study drugs were prepared by an independent neuroanesthesiologist who was not involved in administering the drugs or the postoperative patient follow-up. All study medications were prepared in identical 50 mL disposable syringes. For group X, a 50 mL syringe was filled with 1% propofol (10 mg/mL). For group Y, ketofol solution (total 50 mL) was prepared by adding 2 mL of ketamine (100 mg; 50 mg/mL), 40 mL of 1% propofol (400 mg; 10 mg/mL), and 8 mL of saline. Thus, the effective concentration of ketamine (2 mg/mL) and propofol (8 mg/mL) was 1:4 (mg) in the prepared solution. Fentanyl was prepared in a separate 50 mL syringe containing 10 mcg/mL of fentanyl.
All participants were pre-medicated with intramuscular glycopyrrolate (0.2 mg) 30 minutes before surgery. In the operating room, standard ASA monitors, including non-invasive blood pressure, electrocardiogram, and pulse oximeter (SpO2), were attached to the patients. Bispectral index (BIS) sensors were applied to the patientsŌĆÖ forehead to monitor the depth of anesthesia. After pre-oxygenation with 100% oxygen, general anesthesia was induced with fentanyl (2 mcg/kg) and propofol (2ŌĆō2.5 mg/kg) titrated to loss of verbal command. Cisatracurium (0.15 mg/kg) was administered to facilitate tracheal intubation. An arterial line was inserted, and a temperature probe was placed in the nasopharynx for intraoperative temperature monitoring. A soft bite block was placed to prevent tongue bite and oral cavity injuries secondary to TcMEP stimulation. Mechanical ventilation was carried out at a fresh gas flow of 2 L/min with oxygen and air (0.5 fraction of inspired oxygen). Tidal volume was fixed at 8 mL/kg, and respiratory rate was adjusted to maintain the partial pressure of carbon dioxide between 35 and 40 mm Hg. Anesthesia maintenance was commenced with intravenous (IV) infusions of fentanyl (1 mcg/kg/hr) and propofol titrated to maintain BIS at 40ŌĆō60. A threshold voltage of TcMEP was recorded once T4/T1 (train-of-four [TOF] stimulation test, neuromuscular monitoring) was more than 75%. After the threshold voltage was obtained, stimulation voltage was given at 10% above the threshold for eliciting baseline TcMEP parameters (amplitude in microvolts and latency in milliseconds) in all patients. Once the baseline amplitude and latency of the monitored muscles were recorded, anesthesia was maintained in each group. In group X, anesthesia was maintained with IV infusions of fentanyl (1 mcg/kg/hr) and propofol titrated to maintain BIS at 40ŌĆō60. In group Y, anesthesia was maintained with IV infusions of fentanyl (1 mcg/kg/hr) and ketofol titrated to maintain BIS at 40ŌĆō60. In both groups, mean arterial pressure (MAP) was maintained within 20% of baseline values. If hypotension (decrease in MAP >20% of baseline) developed, a fluid bolus (200 mL) was administered. If hypotension persisted after the fluid bolus, phenylephrine boluses in incremental doses of 20 mcg were administered to maintain MAP. If hypertension (increase in MAP >20% of baseline) developed, labetalol (5 mg) was considered. Intermittent fentanyl boluses (0.5 mcg/kg) were administered at the discretion of the attending neuroanesthesiologist. Intraoperative body temperature was maintained between 36┬░C and 37┬░C.
4. Acquisition of transcranial motor evoked potentials
TcMEP responses were elicited after transcranial electrical stimulation through corkscrew electrodes placed at C3 and C4 positions according to the 10ŌĆō20 electrode placement system. Stimulation consisted of a train of eight square wave pulses of 75 ╬╝s duration each, with a frequency of 250ŌĆō500 pulses/sec (software version NIM ECLIPSE 4.0, NIM ECLIPSE NS System; Medtronic, Minneapolis, MN, USA). TcMEPs were recorded bilaterally from the abductor pollicis brevis (APB) muscle (control muscle) of the upper limbs and abductor hallucis (AH) muscle (affected muscle) of the lower limbs through paired needle electrodes.
The effects of muscle relaxants were assessed using the TOF modality. The threshold voltage was recorded once T4/T1 was more than 75%. After determining the threshold voltage, the stimulation voltage was given at 10% above threshold for eliciting baseline (T0) MEP parameters (amplitude and latency). The same stimulation voltage was used in each respective patient throughout the surgery for recording amplitude and latency at 30 minutes intervals for 2 hours; the 30-, 60-, 90-, and 120-minute time points are labeled as T1, T2, T3, and T4, respectively.
5. Blinding
The patients, investigator, and neurophysiologist were blinded to the anesthetic regimen.
6. Statistical analysis
Data were analyzed using IBM SPSS ver. 25.0 (IBM Corp., Armonk, NY, USA). Normality was determined using the Shapiro-Wilk test. Descriptive statistics were determined. Normally distributed or parametric data are presented as mean┬▒SD, whereas non-normally distributed or non-parametric data are presented as medians (quartile difference [QD]). Parameters were compared within the same group over time using repeated-measures analysis of variance and the Friedman test for parametric and non-parametric data, respectively. Bonferroni post hoc test was applied when p-values were significant. Parameters were compared between the two groups using unpaired t-tests or Mann-Whitney U-tests for parametric and non-parametric data, respectively. The statistical significance threshold was p<0.05.
Results
1. Demographics and spinal pathology
There were no significant differences between the two groups regarding sex, age, height, or weight (Table 1). Spinal disorders included spinal cord tumor (n=22), spinal canal stenosis (n=7), disc herniation (n=5), lumbar listhesis (n=3), and ossification of the posterior longitudinal ligament (n=1).
2. Transcranial motor evoked potentials parameters
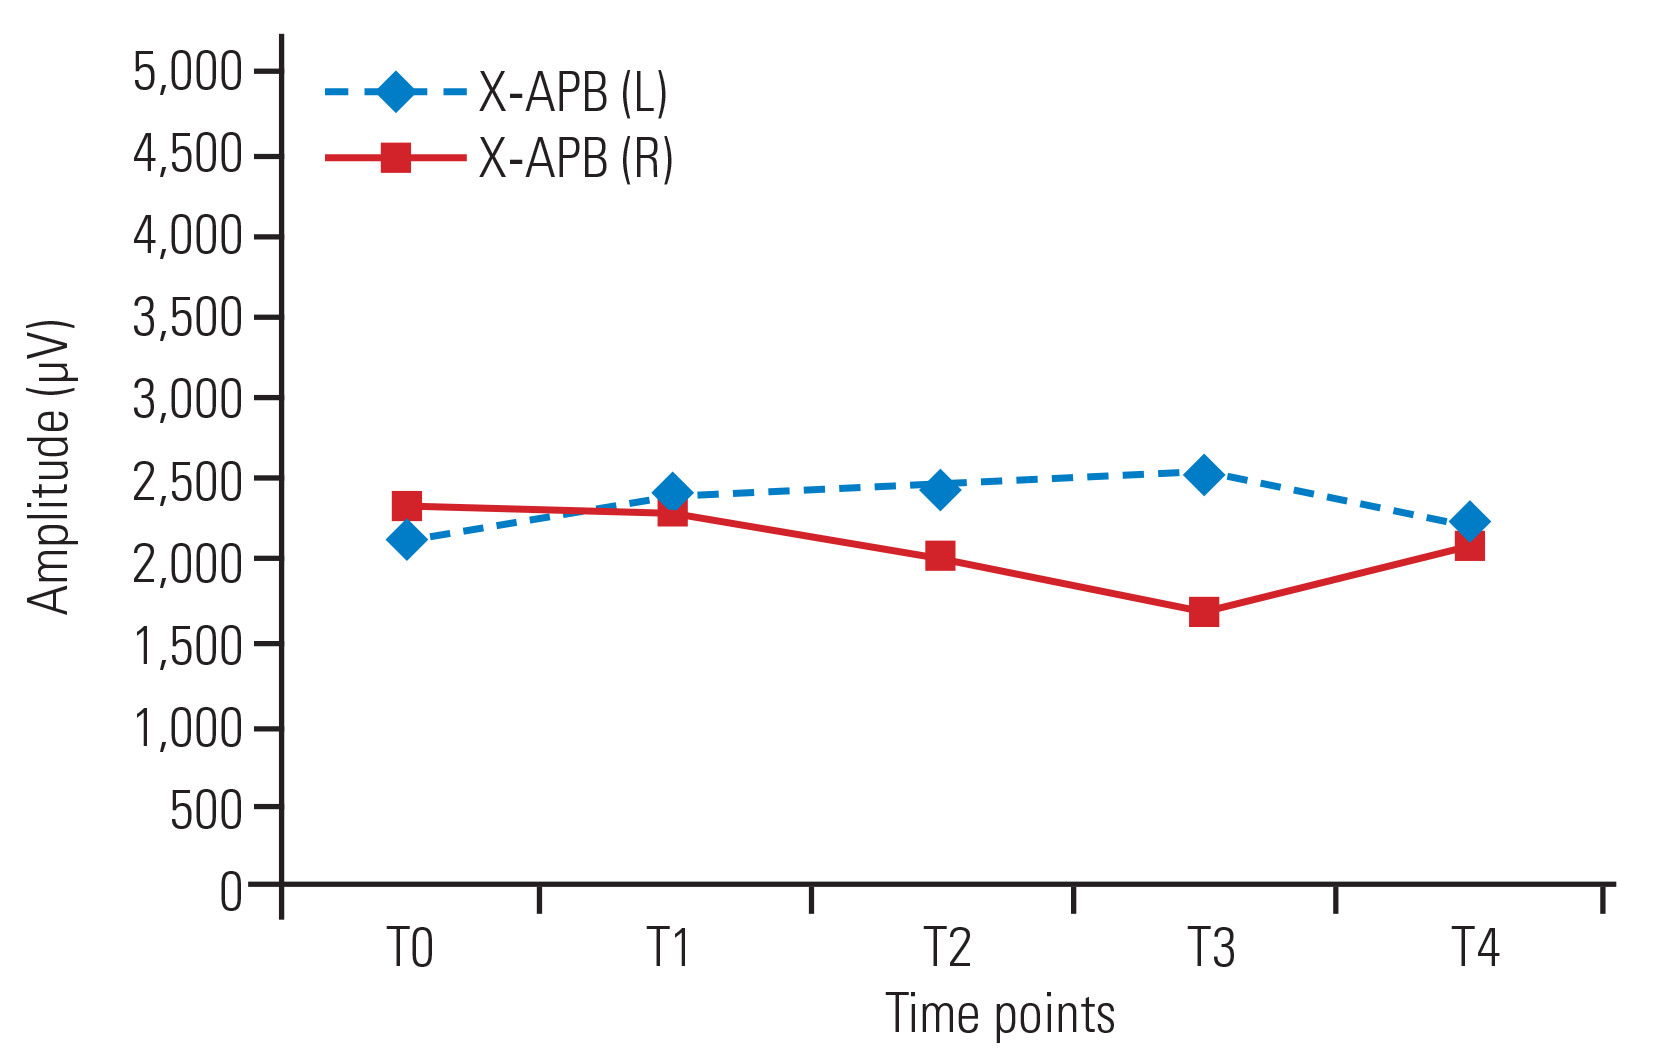
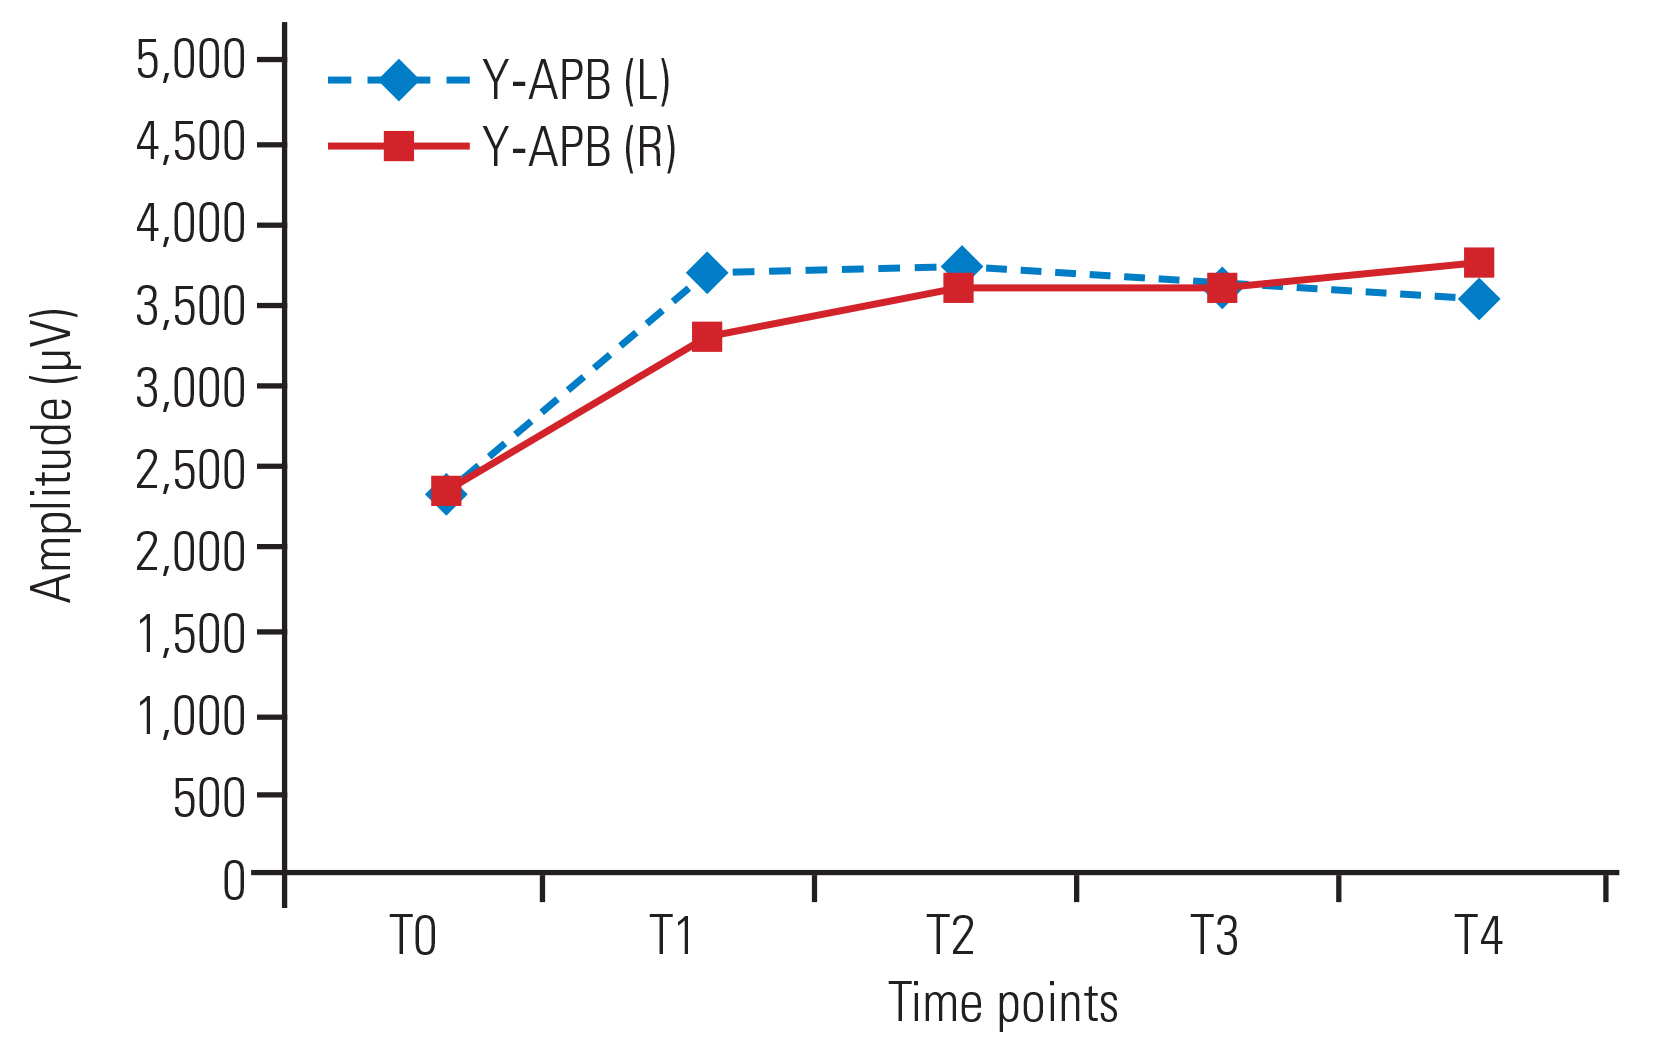
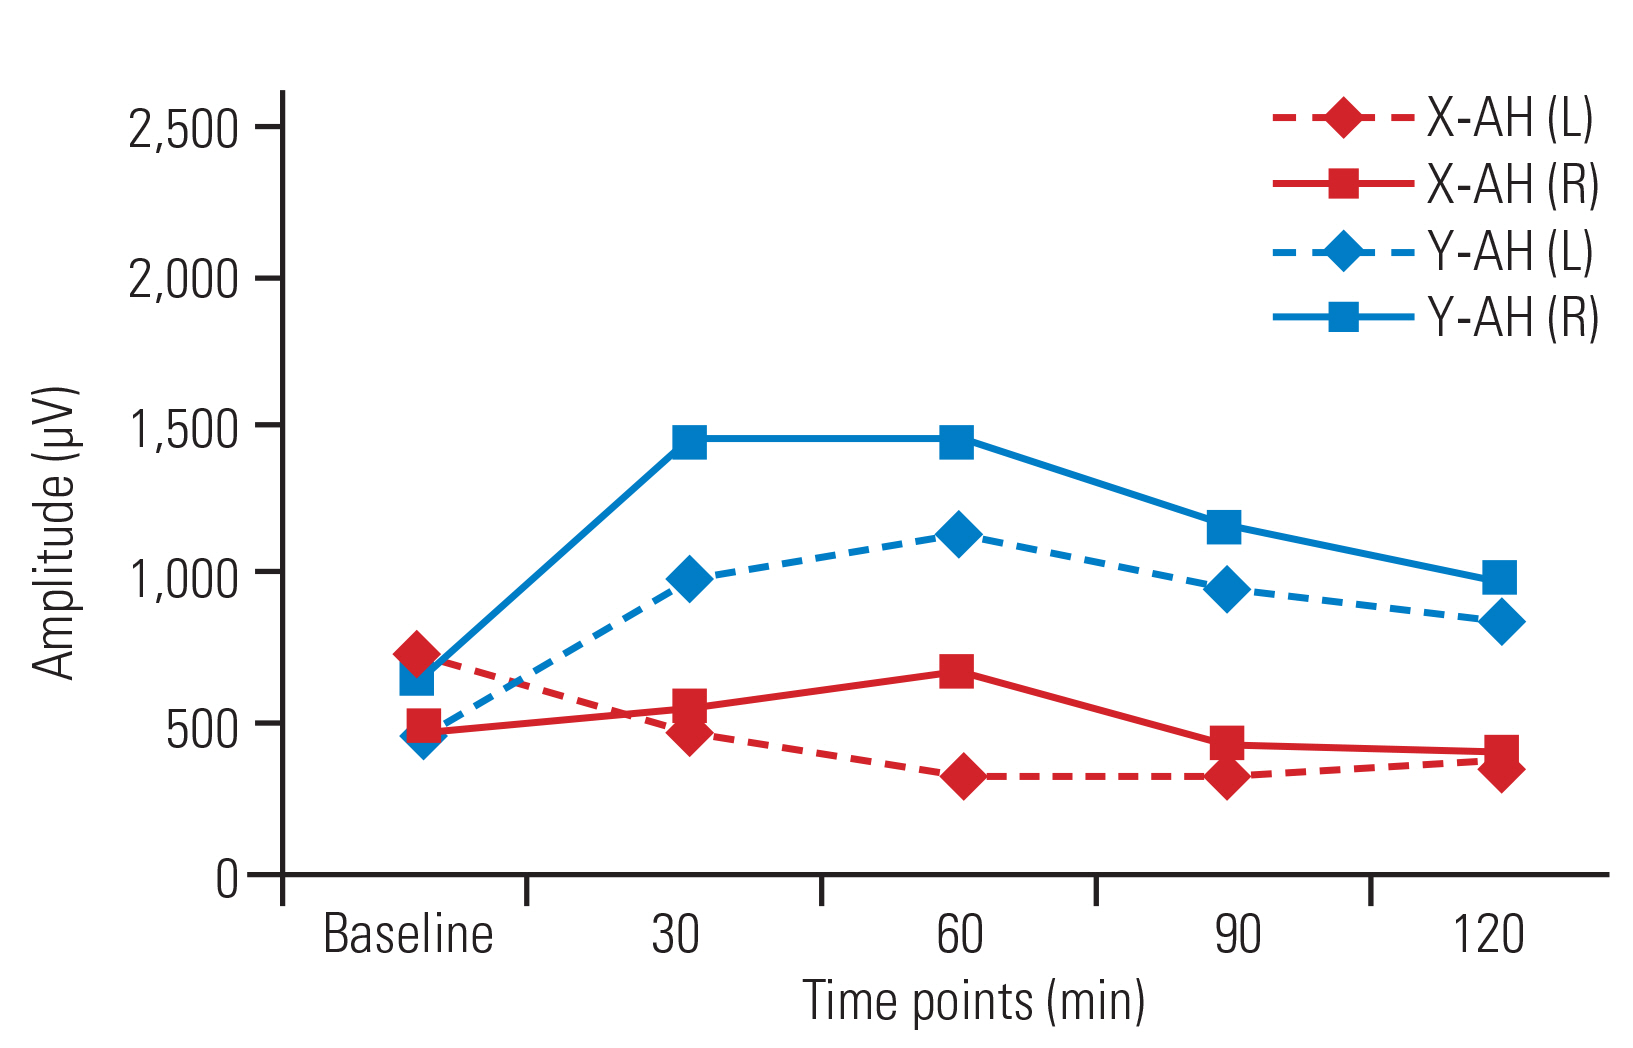
No significant changes in amplitude were detected over time in the bilateral APB (Fig. 2) and AH muscles in group X. In group Y, amplitude increased at all time points compared with baseline in the bilateral APB muscles (Fig. 3) and at T2, T3, and T4 versus T0 in the AH (left [L]) muscle. In the AH (right [R]) muscle, no significant increases in amplitude in T1ŌĆōT4 compared with baseline (T0) were detected (Fig. 4). No significant changes in amplitude were detected between any successive time points (T1ŌĆōT4) in either group (Table 2).
Amplitudes in group Y were significantly higher in the APB (L) at T2, T3, and T4 and in the APB (R) at all time points compared with those in group X. In the bilateral AH muscles, the amplitudes were higher at all time points in group Y compared with those in group X, though the differences were only significant at T4 (Table 3).
There were no significant differences in latency at any time points (T1ŌĆōT4) compared with baseline (T0) in either group (Table 4). When the two groups were compared, the latency was similar at all time points (Table 5).
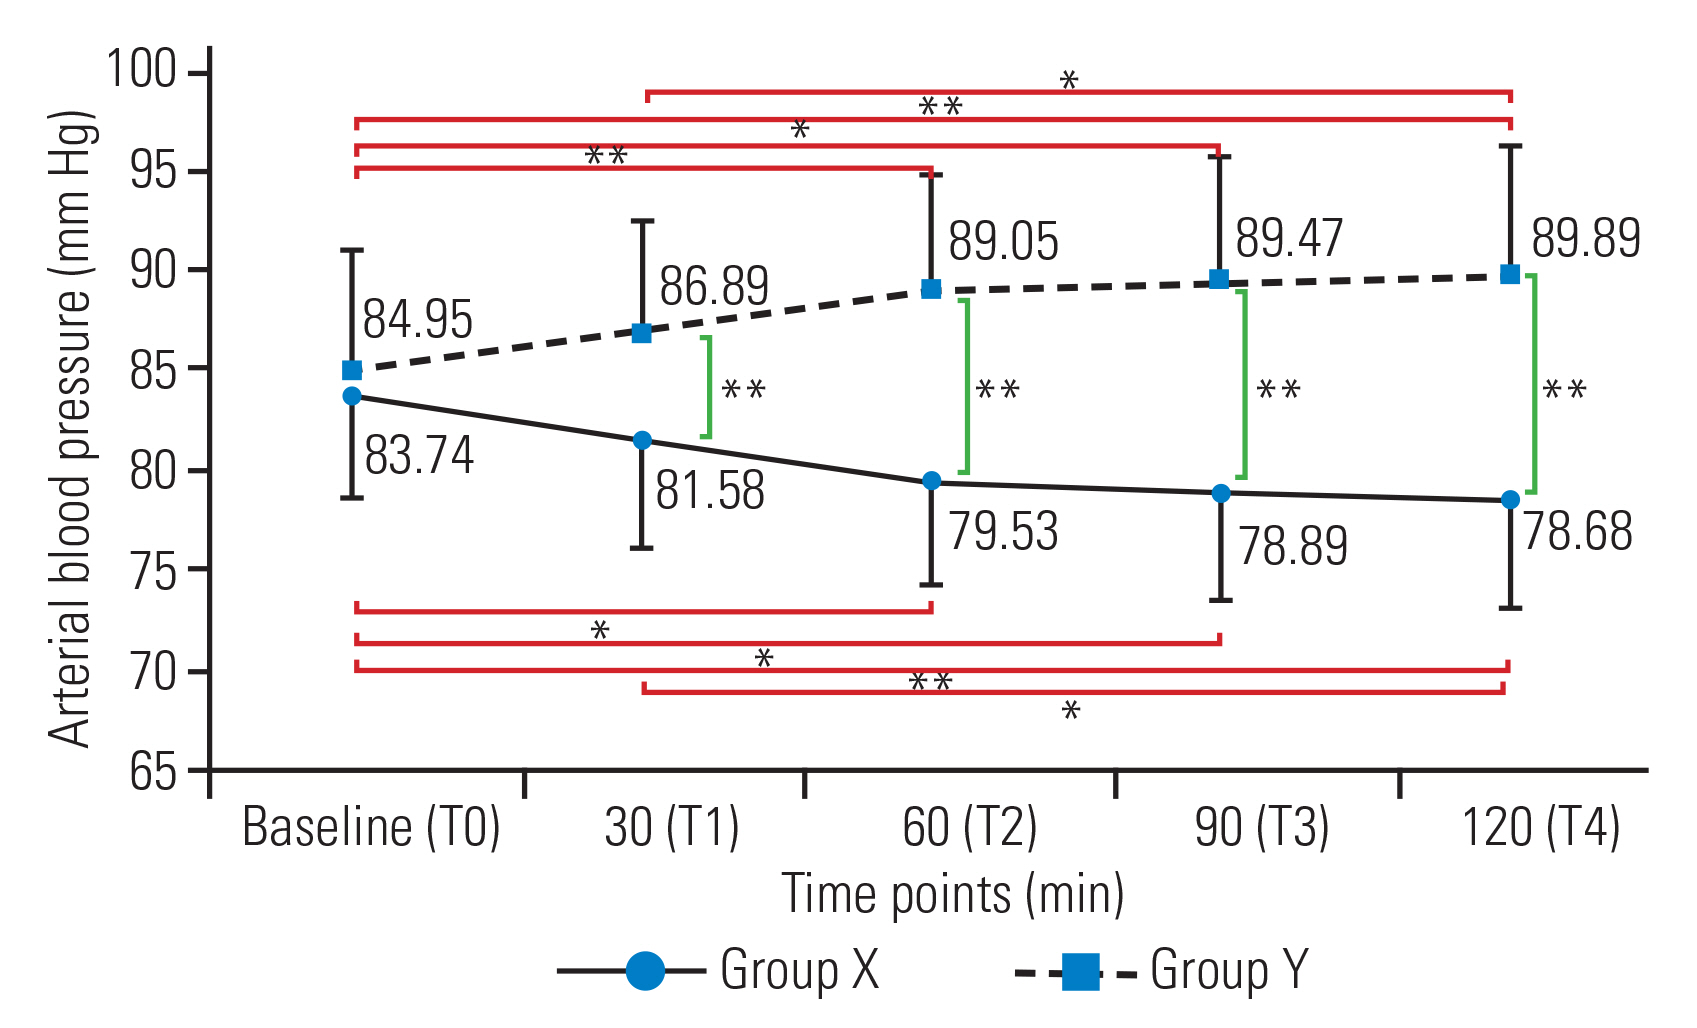
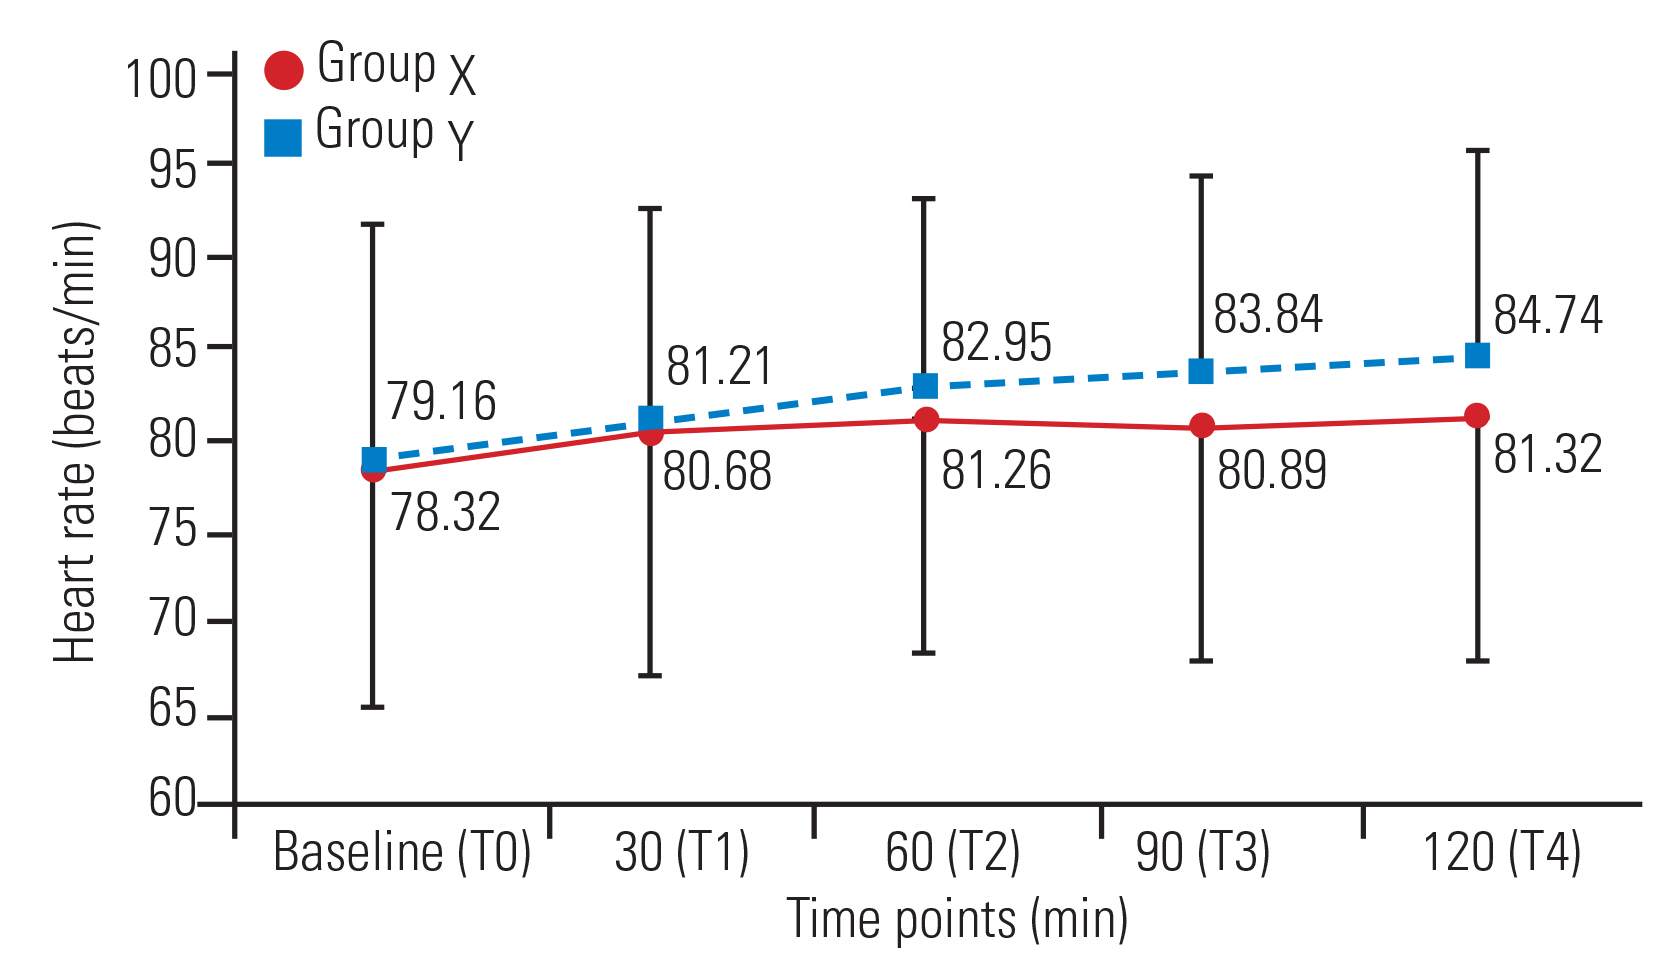
In group X, MAP decreased significantly at T2 (mean┬▒SD, 79.53┬▒5.26 mm Hg), T3 (78.89┬▒5.47 mm Hg), and T4 (78.68┬▒5.48 mm Hg) compared with T0 (83.74┬▒5.22 mm Hg). In group Y, MAP increased significantly at T2 (89.05┬▒6.38 mm Hg), T3 (89.47┬▒6.17 mm Hg), and T4 (89.89┬▒6.33 mm Hg) compared with T0 (84.95┬▒6.09 mm Hg). MAP was similar between the two groups at T0. However, at all other time points, BP was significantly higher in group Y compared with that in group X (Fig. 5). No significant differences in HR were detected within the two groups or between the two groups (Fig. 6).
3. Intraoperative parameters
BIS values did not change significantly in group X at any time points compared with baseline (T0). In group Y, BIS increased significantly at all time points compared with baseline; however, there were no significant changes among the time points (T1 to T4). BIS was similar at baseline between the two groups; however, BIS was significantly higher at all other time points in group Y compared with that in group X (Table 6). BIS was always within the range of 40ŌĆō60 in both groups at all time points. The mean consumption of IV fluids (3,005.26┬▒605.96 mL in group X versus 2,594.74┬▒402.04 mL in group Y) and phenylephrine use (178.95┬▒66.82 mcg in group X versus 90.53┬▒61.23 mcg in group Y) were significantly higher in group X compared with that in group Y. The mean blood volume loss, median blood transfusion volume, surgery duration, and anesthesia duration were similar between the two groups. Blood transfusions were required in five patients in group X (300 mL each) and four patients in group Y (300 mL each). The median (QD) time to tracheal extubation was significantly shorter in group X compared with that in group Y (20 [2] minutes versus 28 [3.5] minutes) (Table 7).
4. Complications
One patient in group Y developed intraoperative hypertension, which was treated with labetalol (5 mg). One patient in group Y suffered a tongue laceration secondary to TcMEP stimulation. No other patients developed major intraoperative and postoperative complications. None of the patients in group Y developed ketamine-induced psychedelic effects during the postoperative period.
There were no significant differences in muscle power preoperatively versus postoperatively in either the upper or lower limb muscles in the two groups (Table 8). The median (QD) duration of hospital stays (from the day of surgery till the day of discharge) was similar between the two groups (4 [1] and 4 [1] in groups X and Y, respectively; p=0.751).
Discussion
TcMEPs were recorded successfully in all patients. The effects of ketofol on TcMEPs have not been investigated to our knowledge; thus, we compared our results with those studies that utilized ketamine as an adjuvant with propofol TIVA during TcMEP monitoring.
No significant changes in amplitude and latency in the bilateral APB and AH muscles over time were observed with propofol. However, with ketofol, amplitude increased significantly at all time points in the bilateral APB muscles and at 60, 90, and 120 minutes in the AH (L) muscle compared with baseline, without changes in latency. In the AH (R) muscle, there was no significant increase in amplitude from T1 to T4 compared with baseline (T0). Also, there were no significant changes in amplitude between the times after baseline (T1ŌĆōT4) in group Y, indicating that ketofol maintained a stable depth of anesthesia, which is the prime requirement for accurate intraoperative neurophysiological interpretation of TcMEPs. Ketamine increases muscle tone and could well be the reason for the ketofol induced increased amplitudes, as we did not administer muscle relaxant during maintenance of anesthesia [13].
Lam et al. [14] observed that ketamine infusion (0.5 mg/kg bolus followed by 0.2ŌĆō0.5 mg/kg/hr infusion) and dexmedetomidine (0.1ŌĆō0.4 ╬╝g/kg/hr) had comparable effects on intraoperative TcMEP parameters during stable propofol-opioid anesthesia and suggested that ketamine is the preferred drug for major spinal surgeries. In an experimental study, three groups of rodents received either 75 mg/kg of intramuscular ketamine followed by IV infusion at 125 ╬╝g/kg/min or 10 mg/kg IV of propofol followed by IV infusion at 400 ╬╝g/kg/min (standard dose) or 800 ╬╝g/kg/min (high dose). Propofol infusion suppressed the TcMEP amplitude and the amplitude with ketamine was higher than the amplitude when high dose propofol was used. Furthermore, with ketamine, MEP amplitude progressively increased with increasing deep brain stimulation pulse frequency, but no such effect was observed with propofol infusion. These results demonstrated that ketamine increased the amplitude of MEPs with and without a conditioning stimulus [15]. In another study, patients received low-dose ketamine (0.5 mg/kg bolus followed by 4 ╬╝g/kg/min infusion) or an equal volume of saline along with stable propofolŌĆōremifentanil anesthesia during spine surgery. Ketamine did not increase the minimum voltage needed to elicit maximum amplitude of the MEP response, suggesting that ketamine can be utilized to reduce the dose of propofol and prevent remifentanil-induced acute opioid tolerance via its NMDA receptor antagonistic property [8]. In a study by Inoue et al. [16], patients received either 1 mg/kg/hr of ketamine or 4 mg/kg/hr of propofol as maintenance anesthetic agents along with 50% N2O in oxygen and 4ŌĆō5 ╬╝g/kg/hr fentanyl. Amplitudes were significantly higher in the ketamine group compared with that in the propofol group, whereas the latency was similar [16]. Kawaguchi et al. [7] conducted a study to evaluate TcMEPs with ketamine with and without propofol and observed that propofol inhibited TcMEP amplitudes dose-dependently; TcMEP amplitudes recovered only after applying a train of pulses.
Studies using a bolus dose of ketamine are difficult to compare because of variations in doses, administration times, TcMEP evaluation times, stimulation modes, recording duration, and age-groups. Furutani et al. [17] compared the effects of a bolus dose of ketamine (1 mg/kg) versus 0.9% saline on TcMEP during stable propofolŌĆōremifentanil anesthesia in female children. Ketamine significantly decreased amplitude and increased relative onset latency compared with saline. However, the suppressive effect of ketamine on TcMEP amplitude lasted only 10 minutes and returned to the approximate baseline value by 30 to 60 minutes after administration. Thus, the authors recommended administering a continuous infusion of ketamine after a bolus dose [17]. In contrast, Ubags et al. [18] reported that a bolus dose of ketamine (0.5 mg/kg) during opioid-N2O anesthesia did not significantly change TcMEP amplitude and latency in patients (12ŌĆō57 years) undergoing spinal surgery; the amplitudes increased from a baseline value of 311 ╬╝V to 349, 450, 387, and 392 ╬╝V at 2, 5, 10, 15 minutes, respectively, after the administration of ketamine. Kalkman et al. [13] demonstrated that a 1 mg/kg bolus dose of ketamine increased the MEP amplitude within 10 minutes to as high as 150%ŌĆō220% in three of five human volunteers. Similarly, Yang et al. [19] reported that intraoperative TcMEP monitoring was feasible under ketamine-opioid anesthesia in spinal surgery. Thus, owing to inconsistent results of TcMEP with bolus doses, an infusion dose of any agent should be considered for reliably recording effects on TcMEP parameters.
The 1:4 ketofol dose resulted in a significantly higher MAP at T1ŌĆōT4 compared with propofol use. Moreover, IV fluids and vasopressor requirements were significantly lower in the ketofol group. These differences may be due to the nearly 50% lower requirement for propofol in the ketofol group. Propofol causes a dose-dependent suppression of TcMEP amplitudes secondary to inhibition of spinal ╬▒ motor neurons [20]. Scheufler et al. [21] reported that plasma propofol concentrations between 2 and 6 ╬╝g/mL did not significantly affect MEPs. Although plasma concentrations of propofol were not measured in our study, the suppression of TcMEP by propofol was most likely due to sympatholytic effects. In the absence of muscle relaxation, the high dose of propofol required to maintain an immobile patient causes hypotension and interferes with TcMEP signal acquisition. Ketamine maintains hemodynamic stability and tissue perfusion via its sympathomimetic properties; thus, the sympatholytic and sympathomimetic properties of propofol and ketamine, respectively, are balanced in ketofol. This property of ketofol is particularly useful in conditions known to result in weak amplitudes, such as muscle spasticity, preoperative motor dysfunction, children, and concomitant use of inhalational anesthetics [22]. Ketofol is also a very useful drug in hemodynamically unstable patients.
The BIS is a processed electroencephalography variable widely used to guide the administration of hypnotic drugs [23]. BIS values were significantly higher at T1ŌĆōT4 in group Y than in group X. However, BIS values remained within the range required for general anesthesia in both groups. Moreover, BIS values at all time points after baseline were similar in group Y. This is attributed to the minimal effects of low-dose ketamine on BIS and is consistent with previous studies [24,25]. When ketamine (1 mg/kg) was administered as a bolus during stable propofolŌĆōremifentanil anesthesia, BIS increased from 45┬▒8 to 56┬▒10, similarly to that in group Y in our study [17].
Ketamine may produce undesirable psychedelic effects, including unpleasant dreaming, extracorporeal experiences, illusions, and hallucinations, during emergence from anesthesia. These effects are often associated with excitement, confusion, euphoria, and fear [26]. However, the psychedelic effects of ketamine are reduced significantly when propofol is administered along with ketamine [7,27]. In our study, 1:4 ketofol was used, and postoperative behavior was normal in all patients; no patients suffered emergence reactions after surgery. These findings are consistent with the study by Guit et al. [27]; TIVA using ketamine (2 mg/hr) and propofol infusion caused no postoperative psychomimetic effects in patients. Miner et al. [28] also found that the rate of emergence reactions was significantly lower with 1:4 ketofol than with 1:1 ketofol.
Measurement of TcMEPs is the standard of care during spinal surgeries and is crucial in preventing/limiting new motor deficits. TcMEPs are highly sensitive and specific for predicting postoperative motor deficits [4,29]. However, TcMEP amplitudes are significantly affected by several modifiable factors, such as patient core temperature, systemic blood pressure, oxygenation, ventilation, and the depth and type of general anesthesia [30]. Amplitude changes due to these factors may lead to false positives or negatives, which are undesirable for ideal patient outcomes. These modifiable factors were kept constant in our study, and no significant surgery-related TcMEP alarms developed. Amplitude and BIS values did not change significantly from T1 to T4 during ketofol infusion, indicating stable anesthetic depth critical for accurate neurophysiological interpretation. Moreover, postoperative motor power assessment also demonstrated the absence of any new motor deficits in all cases, suggesting that the intraoperative neurophysiological interpretation under ketofol infusion showed a clinical correlation with the postoperative neurological status.
For patients with preoperative neurological deficits, direct wave (D-wave) monitoring is a viable technique for assessing corticospinal tract function; unlike that in TcMEP monitoring, the activity of the motor tract is directly recorded in D-wave monitoring and is not dependent upon the temporal summation over the anterior motor horn. Similarly to that for TcMEP, the stimulation for eliciting D-wave is given through electrodes placed in the scalp over the putative motor cortex. However, recording is done directly from the spinal cord through the electrodes placed in the subdural or epidural space. Nevertheless, the D-wave amplitude is directly proportional to the number of conducting axons at the recorded level. As such, one cannot record a caudal D-wave if the lesion is below the D9 level. Moreover, D-wave reliability is poor in patients with a history of irradiation and previous surgery. Thus, TcMEP monitoring under ketofol anesthesia is a better technique for lower thoracic and lumbar spine surgeries.
Several limitations of this study should be recognized. The study population was small; future studies should be conducted with larger sample sizes. Ketofol neither increased BIS values beyond 60 nor resulted in psychedelic effects in any patient. However, higher concentrations of ketamine in ketofol may not produce the same results. The plasma concentrations of the study drugs were not determined owing to feasibility issues; future studies should consider measuring plasma drug concentrations when measuring the effects on TcMEPs.
Conclusions
In our study, TcMEPs were recorded successfully in all patients. Under comparable BIS values and no muscle relaxant use during the maintenance of general anesthesia, we found that ketofol facilitates TcMEPs amplitudes without affecting latency. Ketofol use resulted in better and more stable hemodynamic profiles than did propofol use. Moreover, adverse sequelae like psychedelic effects were not observed. Thus, ketofol can be used effectively and safely in spine surgery with TcMEP monitoring.