Radiographic Analysis of the Sagittal Alignment of Spine and Pelvis in Asymptomatic Indian Population
Article information
Abstract
Study Design
This is a descriptive observational study.
Purpose
The objective of this study is to analyze and document the sagittal alignment of the spine and pelvis in normal Indian adult volunteers and compare these parameters with the study population of other races and ethnicities.
Overview of Literature
Given the importance of the spinopelvic parameters, there is a need to describe the parameters differentially in relation to the ethnicity of the studied individual. Very few reports have defined the normal physiological value. Ethnic differences are a significant factor not only when describing the anthropometric data but also when applying the findings to a different ethnic group. We have compared these values with other races and ethnicities so that we can know whether the principles of spinal fixation can be applied globally.
Methods
In total, 100 participants were studied by using their anteroposterior and lateral radiographic images of whole of pelvic and spinal area. Additionally, various spinal and pelvic parameters were also measured. Subsequently, the outcomes were analyzed with respect to age, sex, and body mass index (BMI). The correlation between different parameters and differences in these parameters between Indians and other races/ethnicities along with population groups were also analyzed.
Results
There was a significant increase in thoracic kyphosis (TK) from T1–T12 and T4–T12 with increasing age. Lumbar lordosis (LL), sacral translation (sagittal vertical axis), and pelvic tilt were significantly higher among females. Additionally, sacral slope (SS), pelvic incidence, C7 sagittal offset, and T9 sagittal offset were also higher in females. TK (T4–T12 and T1–T12), LL, SS, and pelvic incidence showed a significant correlation with BMI. As compared to European population, TK, segmental LL, and sacral translation were found to be significantly lesser in Indian population.
Conclusions
There is a statistically significant difference between Indians and other races/ethnicities and population groups with respect to TK, LL, and sacral translation. The values obtained can be considered as the physiological normal values for Indian population. Importantly, these values can serve as the reference values for future studies.
Introduction
Sagittal alignment has been given an increasing importance in maintaining the normal functioning of spinal column and its various disease states. The Scoliosis Research Society has defined the existence/presence of normal sagittal alignment as when the plumb line dropped from the center of C7 body lies within ±2 cm of the sacral promontory. The reciprocal curves of cervical, thoracic, and lumbar spine allow an optimal absorption of loads applied to the spine with minimal energy expenditure. These curves, especially lumbar lordosis (LL), play a significant role in maintaining an efficient upright posture. Many researchers have reported the negative effects of a reduced LL with fixed sagittal imbalance after spinal instrumentation; this condition is also known as a flatback deformity [1]. The relevant parameters for the sagittal alignment of the spinal column in an upright posture are well described in literature. However, very few reports have defined its normal physiological value. Moreover, it has been proven that the physiological upright standing posture may be attained in multiple ways for and by every individual with an exclusive sequence of spinopelvic alignment and sagittal plane contour. These patterns may be affected by numerous variables, such as age, gender, weight, and, especially, pelvic morphology and orientation of the pelvis. Hence, it is important to study the normative values and relationships among all the parameters of spinopelvic balance in asymptomatic patients.
Ethnic differences are a significant factor not only while describing the anthropometric data, but also while applying the findings to a different ethnic group. Given the importance of spinopelvic parameters, there is a need to describe the parameters differentially with respect to the ethnicity of the studied individual. Although the reference values defined as “normal” have been reported, we believe that this observation constitutes a simplistic view of the variability observed for individual anthropometric values. As there is no documentation of normative values of these parameters of spinopelvic alignment for Indian population, we aimed at determining these radiographic parameters in the normal adult volunteers from India. We have compared these values between Indian cohort with cohort from other races and ethnicities so that we can know whether the principles of spinal fixation can be applied globally. The objective of this study is to postulate the reference values while considering future work on spinal alignment in the Indian population.
Materials and Methods
The study was conducted at a tertiary care spine institute for a duration of 2 years (January 2018–January 2020). Our institute receives patients from pan-India with different geographical representations. In total, 100 normal adult volunteers aged between 20 and 60 years were included in this study. The Institutional Review Board of Indian Spinal Injuries Centre, New Delhi granted approval for study's conduct and protocol prior to its commencement (ISIC/RP/2018/027). Additionally, written informed consent along with a statement explaining radiation exposure was obtained from all the volunteers. Patients with a history of chronic back pain, spinal disorders, previous spine surgery, and radiographic abnormality detected before or during the study, hip, knee and ankle abnormality, and limb length inequality were excluded. An anteroposterior and lateral radiograph of spine and pelvis of 105 volunteers (four were excluded in view of presence of radiographic abnormalities and one patient had a discrepancy in the limb length) was taken in standing position.
Technique of taking the radiographs: al the radiographs were supervised by the authors for the purpose of standardization. A 91.44-cm vertical cassette was used. The distance between the radiographic source and the film was maintained at 2.5 m. The mean parameters were 90 kV/100 mAs for the lateral X-ray and 70 kV/160 mAs for the anterior X-ray. The diagnostic X-ray system (Rx Only; Samsung Electronics Co. Ltd., Suwon, Korea; Model no. XGEO GC80, System Cabinet ID. SDR-OGCA72B) was used in this study. The radiograph was centered on the 12th thoracic vertebra. All the radiographs were taken during inhalation. For male participants, a gonadal lead protection was used. For the anteroposterior X-ray, the patient was asked to stand in an erect posture, barefoot, feet slightly apart, knees in extension, facing the cassette and keeping the arms hanging (in females, a lead protection for breasts was used). For the lateral X-ray, the patient was naturally standing up, looking straight ahead and hands resting on a vertical support, with relaxed upper limbs and slightly flexed elbows. In this position, the upper limbs do not obscure the spine or change the natural alignment of the spinal column. Using this standardized technique, regardless of the patient’s size, it was possible to visualize the whole spine including skull and pelvis (in some cases, even head and the proximal parts of femur were observed). The criteria for acceptable X-ray were that the posteroanterior view should visualize from occiput to the femur head entire width of rib cage. The lateral view should visualize occiput to the femur head.
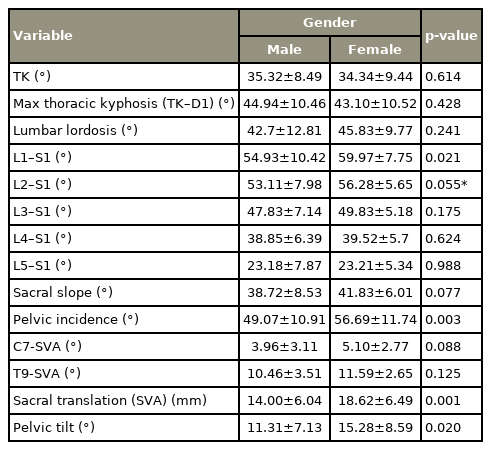
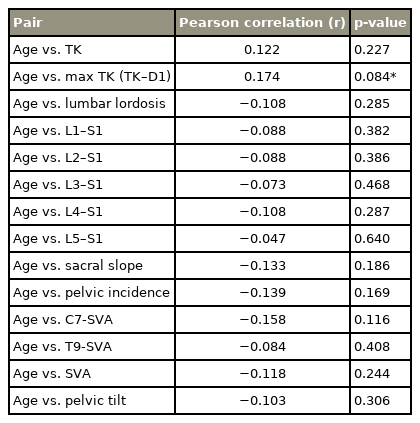
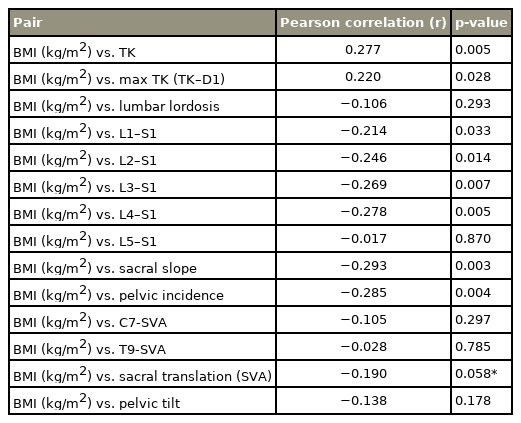
The following parameters were measured on every radiograph by a spine surgeon who is also the lead author of this paper along with a radiologist, and the mean value of each observation was taken (Fig. 1). (1) Pelvic tilt (PT): it is the angle subtended within the perpendicular and the line communicating midpoint of endplate of sacrum and center of the bicoxo-femoral axis. (2) Pelvic incidence (PI): it is the angle between the line perpendicular to the midpoint of the cranial sacral endplate and the line joining the center of bicoxo-femoral axis. (3) Sacral slope (SS): it is the angle of the sacral plateau to the horizontal. (4) Sacral translation (sagittal vertical axis, SVA): it was measured as the perpendicular distance from the vertical line through the hip axis to the vertical line through the posterior superior sacral corner. (5) LL: it is the angle between the cranial endplate of L1 and the caudal endplate of L5 vertebral body. (6) Thoracic kyphosis (TK): it is the angle between the cranial endplate of T4 and the caudal endplate of T12. (7) Maximum thoracic kyphosis (MTK): it is the angle between the cranial endplate of T1 and the caudal endplate of T12. (8) C7 sagittal offset (C7-SVA): it is the angle between the vertical plumb line and the line between the center of the vertebral body of C7 and the center of bicoxo-femoral axis. (9) T9 sagittal offset (T9-SVA): it is the angle between the vertical plumb line and the line between the center of the vertebral body of T9 and the center of bicoxo-femoral axis. (10) Segmental lumbar lordosis: it was measured between each segment L5–S1, L4–S1, L3–S1, L2–S1, and L1–S1.
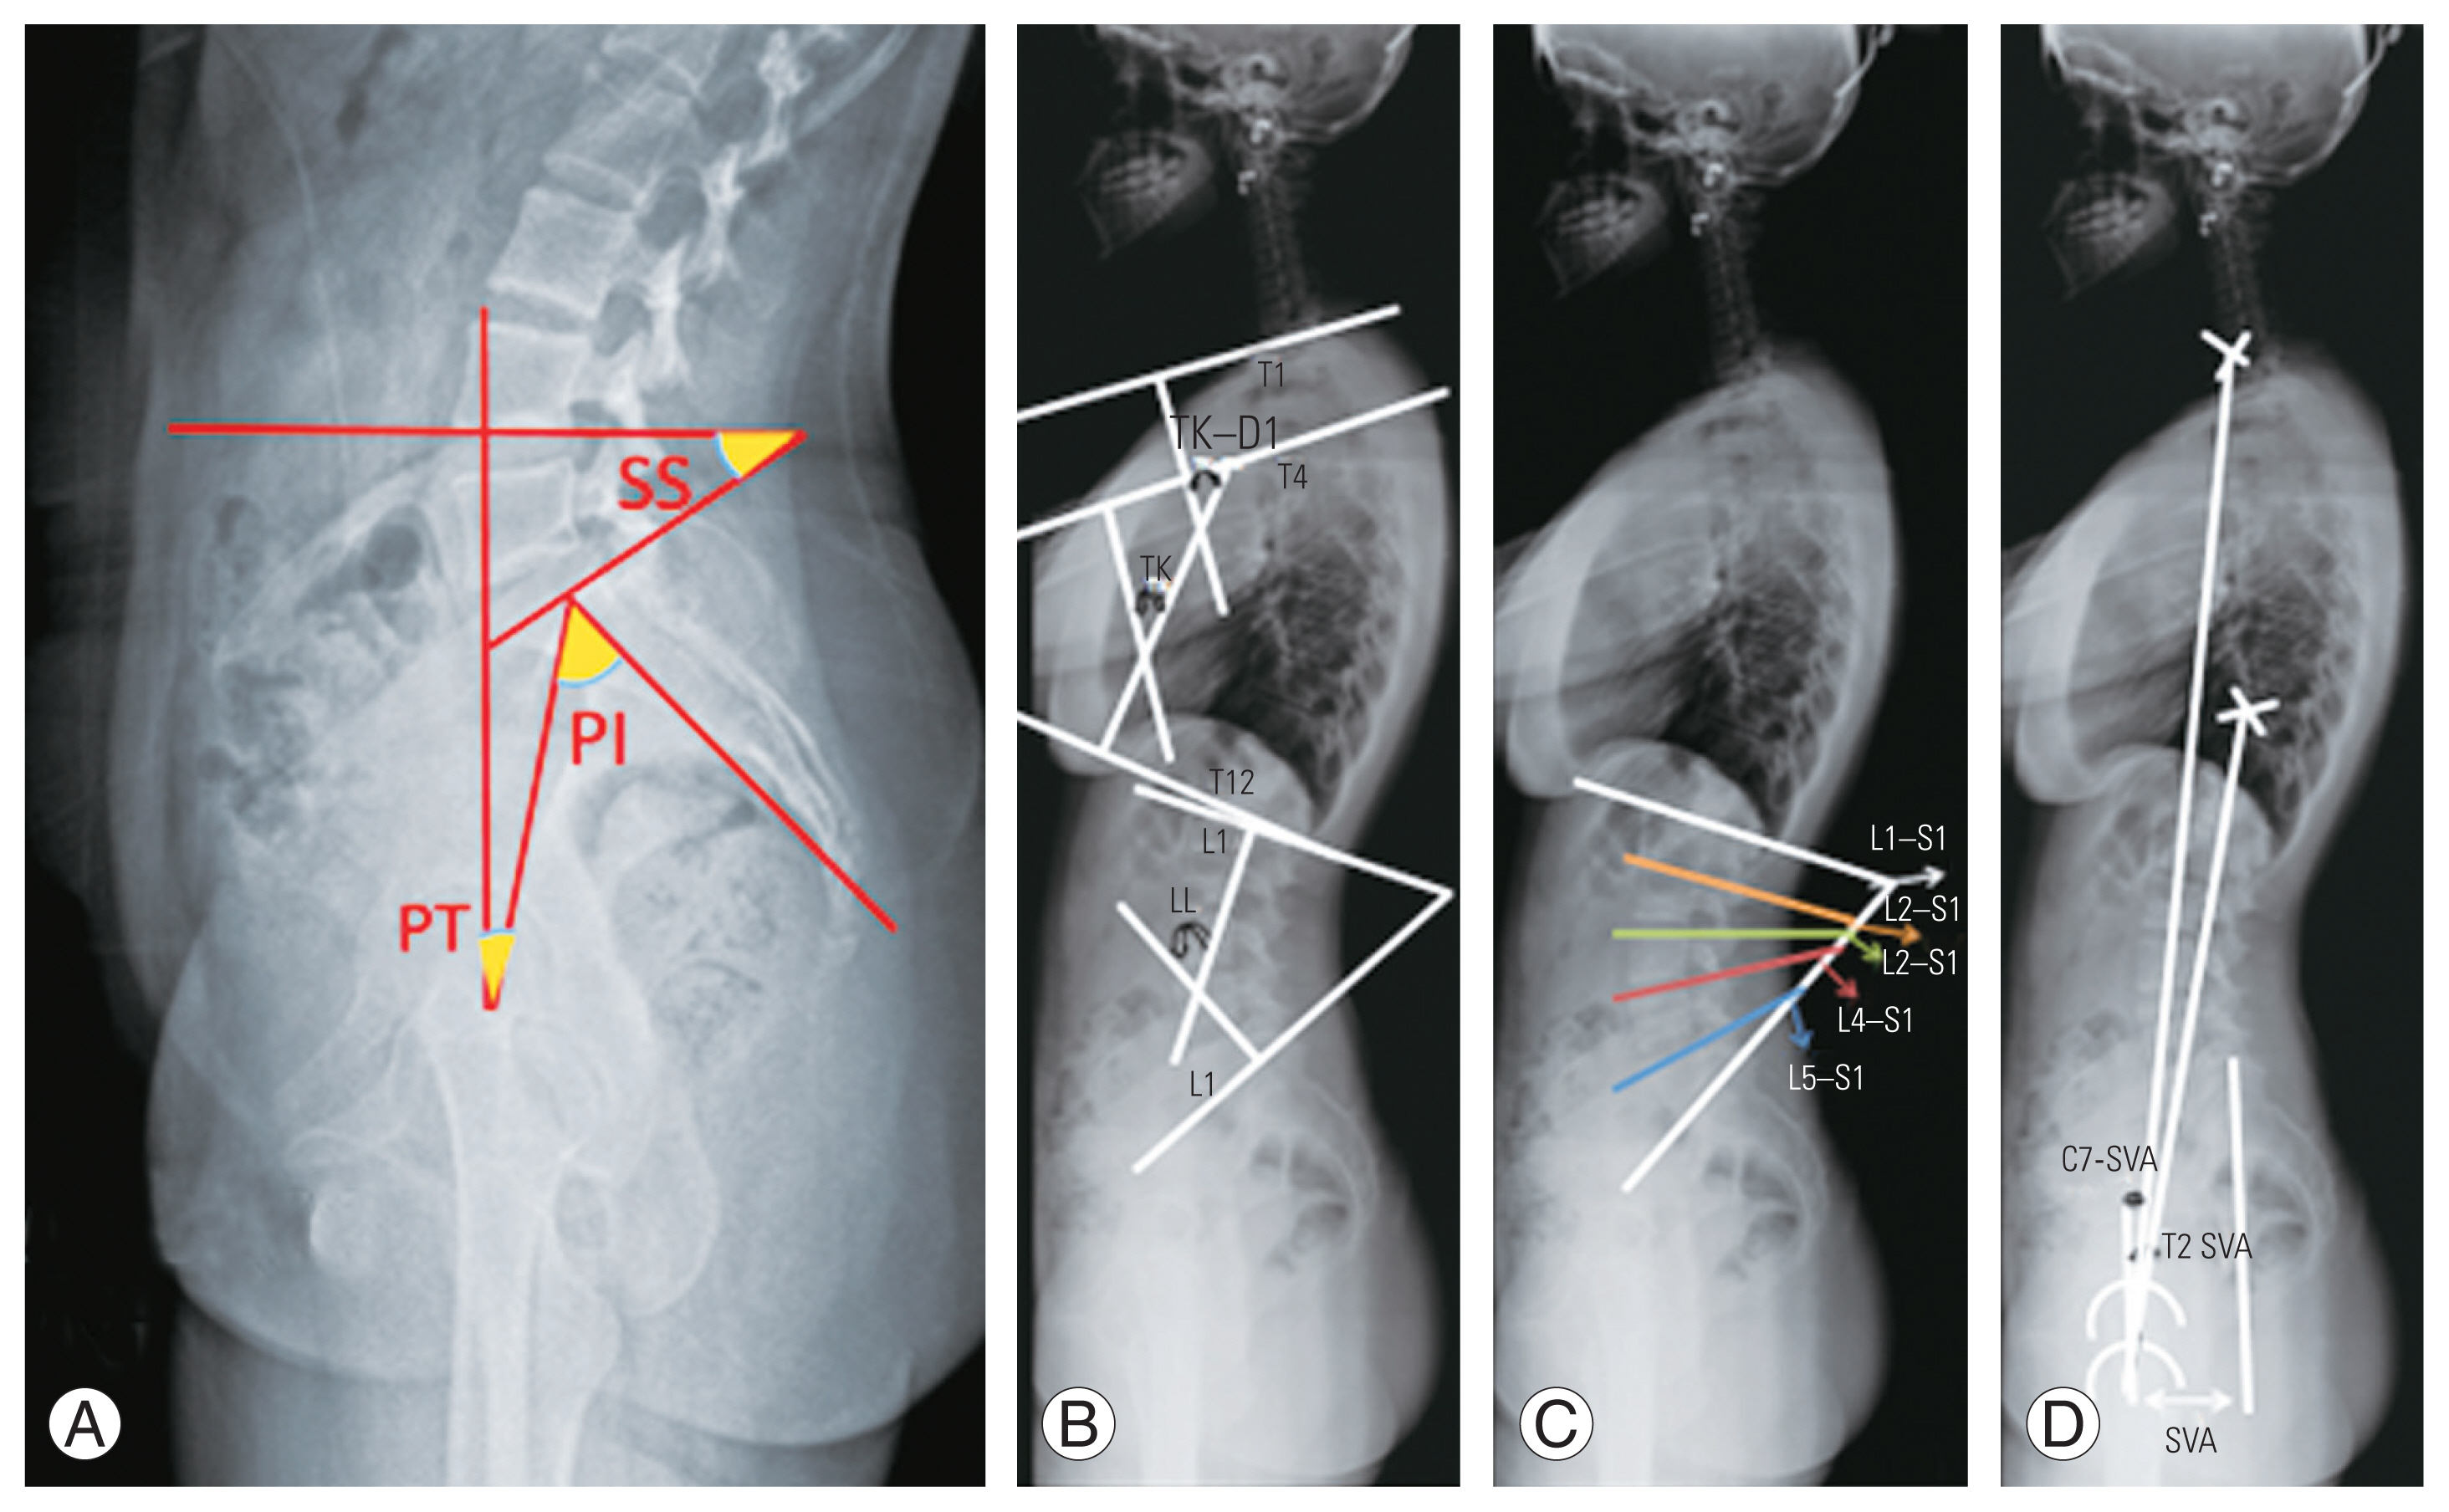
Sagittal parameters measured on the standing lateral radiograph. (A) Pelvic parameters: PI, pelvic incidence; PT, pelvic tilt; SS, sacral slope. (B) Segmental kyphosis: LL, lumbar lordosis; TK, thoracic kyphosis; TK–D1, maximum TK. (C) Segmental lumbar lordosis between each lumbar segments. (D) Sagittal offset measurements: SVA, sagittal vertical axis (sacral translation); T9-SVA, T9 sagittal offset; C7-SVA, C7 sagittal offset.
All the parameters were compared with the parameters of other population groups/races and ethnicities in the previously published literature to document any racial differences between the two data values. Moreover, a case record form was prepared.
The data were analyzed using statistical software SAS ver. 9.2 (SAS Institute Inc., Cary, NC, USA), IBM SPSS ver. 25.0 (IBM Corp., Armonk, NY, USA), Stata ver. 10.1 (Stata Corp., College Station, TX, USA), MedCalc ver. 9.0.1 (MedCalc Software Ltd., Ostend, Belgium), Systat 12.0 (Systat Software Inc., San Jose, CA, USA), and R environment ver. 2.11.1 (The R Foundation for Statistical Computing, Vienna, Austria). Microsoft Word and Excel (Microsoft Corp., Redmond, WA, USA) were used to generate graphs, tables, and other necessary elements. Descriptive statistical analysis was also performed in this study. Results on continuous measurements were presented as mean±standard deviation (min–max), and results on categorical measurements were presented in numbers (%). Significance was assessed at 5% level of significance. Analysis of variance was used to find the significance of study parameters between three or more groups of patients. Student t-test (two-tailed, independent) was used to find the significance of study parameters on the continuous scale between the two groups; inter-group analysis) on metric parameters. Pearson correlation coefficient was measured to assess the relationship of study variables with age and BMI.
Results
This was a cross-sectional correlation study that was conducted on 105 asymptomatic volunteers. Each subject underwent one lateral radiograph; however, four persons were excluded from the study as their radiographs showed spondylolisthesis at L4–L5 (one subject) and at L5–S1 (two subjects) and one subject had discrepancy in the limb length. In total, 100 subjects who qualified for the study were analyzed and their sagittal parameters of spine and pelvis were noted. Mean range of all the variables were studied along with their standard deviation (Table 1). Most of the subjects were males (59%), and females accounted for 41% of the participants. Most of the subjects were between 20 and 30 years (67%) with average age of 27.52±6.1381 years. The volunteers had a body mass index (BMI, kg/m2) of less than 25.0 kg/m2, and 19 volunteers had a BMI value of over 25.0 kg/m2. The average BMI was 22.71±2.85 kg/m2.

Mean and range of all the variables studied with their standard deviation
There was significant increase in the MTK from T1–T12 along with a suggestible significant increase in TK from T4–T12 with increasing age. Other than TK, no other parameters showed any correlation with age (Table 2). LL, SVA, and PT were significantly higher in females than in males. The other parameters such as SS, PI, C7-SVA, and T9-SVA were higher in females but the difference was not statistically significant (Table 3). Only MTK showed suggestible correlation with the age (Table 4). TK, MTK, LL, SS, and PI showed a significant correlation with BMI (Table 5). Table 6 shows Pearson correlation coefficient among the study variables.

Correlation of study variables according to age
Correlation of study variables according to gender
Pearson correlation of study variables with age in years
Pearson correlation of study variables with BMI (kg/m2)

Pearson correlation among the study variables
A strong correlation was found between the LL and SS (r=0.701, p<0.001); LL and PI (r=0.695, p<0.001); SS and PI (r=0.738, p<0.001); PI and SVA (r=0.668, p<0.001); PI and PT (r=0.738, p<0.001); C7-SVA and T9-SVA (r=0.808, p<0.001); and SVA and PT (r=0.946, p<0.001).
When the study variables were compared with the values of the European population, TK, LL of L1–S1, L2–S1, L3–S1, L–S1, and SVA were found to be significantly lesser in Indian population as compared to European population (p<0.05) (Table 7). Moreover, we compared the spinopelvic parameters of our cohort with other populations, and found that the differences were statistically significant [2–13] (Tables 8, 9).

Correlation of Indian population with mean of control group

Comparison with other races and ethnicities

Statistical analysis comparing present study with other races and ethnicities
Discussion
The human spine is a biomechanical masterpiece. It enables bipedalism through unique skeletal alterations and the “S-shape” spinal curvature. For example, the LL maintains the center of gravity over a narrow area between the feet, thus maximizing energy efficiency and minimizing the effect of gravity on joints, muscles, and ligaments. Longstanding investigations on spine evolution, functions, and pathologies have renewed a desire to study the sagittal spinopelvic alignment. Focused research has converted theoretical concepts into clinically relevant guidelines, further establishing the role of sagittal contour in the treatment of various spinal pathologies. Orientation of the spinal column and the resulting posture change with age, gender, and weight of an individual. The combination of angular orientation and translation of each vertebra with respect to the gravity line constitutes a global sagittal alignment. Physiologically aligned spine is an essential component of the appearance and normal functioning of human body.
In some of the spinal disorders, spinal malalignment is observed only in the sagittal plane (i.e., Scheuermann’s kyphosis or spondylolisthesis), whereas other conditions such as idiopathic scoliosis, the alignment is altered in multiple planes. While addressing the spinal deformity, one should not only include the correction of the coronal and transverse plane deformities but also the restoration of normal sagittal contour, which is one of the important parameters with respect to global spinal balance. The interference of spinal mobility with fusion causes an increased stress on adjacent discs. The inadequate restoration of sagittal alignment is bound to increase stresses at the adjacent level, thereby leading to drop off at a higher level or disc degeneration at a lower level, implant failure, and a flat back. This phenomenon initially described as proximal junctional kyphosis was first described in 1999 and was initially assumed to be radiographic change with limited functional relevance [14]. This sanguine assessment was short lived; however, as subsequent reports document a frequent need for revision surgery and the occurrence of catastrophic failures, it was termed as proximal junctional failure [15]. This observation further highlights the importance of the restoration of sagittal balance.
In view of these problems, the primary of aim of this study was to document the sagittal alignment of spinal column and pelvis in normal volunteers so that these values can be taken as the reference values for the restoration of normal sagittal alignment during spinal surgeries. This study also aimed to compare these values with the other populations to document whether these is any difference between two populations with respect to ethnicity or race. As per our knowledge, this is the first study where these spinopelvic parameters of Indian population have been studied and this is the first study that has documented the racial differences between two population groups.
In studies involving both healthy adult volunteers and patients with spine pathologies, pelvic morphology has been shown to affect the standing lumbosacral lordosis and pelvic balance around the hips [16]. The parameters for sagittal spinopelvic alignment and balance appear complex and inter-related. A comprehensive evaluation of the sagittal profile must consider several factors, including individual pelvic morphology.
It is important to take radiographs in a standard manner so that there can be uniformity and an easy comparison. According to Vedantam et al. [17], positioning the arms at 90° rather than at 30° resulted in a negative shift of the sagittal vertical axis in the patients undergoing spinal fusion but it did not significantly alter the SVA in the normal individuals. This phenomenon may occur due to the compensatory adjustment by the mobile segments. According to Marks et al. [18], the shoulder flexion of 45° is the best position to use when a lateral radiograph is taken. We took radiographs with arms flexed to 45° as it was believed to be the best position and to eliminate any bias of arm positioning while comparing with previous study of Vialle et al. [13], which also took the radiographs with the arms flexed forwards to 45°. Additionally, all the radiographs were supervised by the lead author for the purpose of standardization and elimination of bias.
Prost-Proctor and Bleck [19] and Vialle et al. [13] preferred measuring lordosis from the top of L1 to the bottom of L5 and kyphosis from top of T4 to the bottom of T12 (T1 was not used because it was difficult to find the superior endplate of T1 in 50% of the radiographs). However, we did not face much difficulty in locating the superior endplate of T1. We did measure TK from both T4 (for the comparison) and T1 (true total kyphosis) and found TK (T4–T12) of 16°–52° and TK (T1–T12) of 20°–68°. LL was determined as 12°–66°. We also documented the LL of different segments and found that maximum LL exists between L2–S1 (24%) and L1–S1 (76%) and these findings were similar to those of Vialle et al. [13].
The mean values of LL and SS were different for men and women in the studies conducted by Gelb et al. [20], Legaye et al. [21], and Korovessis et al. [22]. In contrast, LL and TK were independent of gender in the studies on 50 adult volunteers by Jackson et al. [16]. In our study, we found that LL (L1–S1), SVA, and PT were significantly higher in females than in males. The other parameters such as SS, PI, C7-SVA, and T9-SVA were higher in females but the difference was not significant. This result shows that females have a relatively more negative balance than males. Prost-Proctor and Bleck [19] found that kyphosis in both genders tend to increase slightly with age, with the upper limit of normal in the elderly adults being as high as 56°. We also noted an increase in kyphosis with age, with upper limit being 52°.
The results of the correlation between all the parameters among themselves were consistent with the results as mentioned by Vialle et al. [13] and Vedantam et al. [17]. They found a strong correlation between LL and TK (r=0.9); LL and SS (r=0.86); LL and PI; and SS and PI (r=0.8). We also found a strong correlation between the LL and SS (r=0.701, p<0.001); LL and PI (r=0.695, p<0.001); SS and PI (r=0.738, p<0.001); PI and SVA (r=0.668, p<0.001); PI and PT (r=0.738, p<0.001); C7-SVA and T9-SVA (r=0.808, p<0.001); and SVA and PT (r=0.946, p<0.001).
We compared our study’s parameters with the studies conducted earlier on other population groups and ethnicities [2–13] (Tables 8, 9). Analysis of the table reveals differences in the values across different races and we recommend values specific to a particular population for comparison. We found TK, LL of L1–S1, L2–S1, L3–S1, L4–S1, and SVA were significantly lesser in Indian population as compared to European population, as confirmed by the study of Vialle et al. [13]. The clinical correlation of this comparison is that Indian population can be more prone to low back pain (LBP) as indicated by their less LL. This concept is supported by the studies by various other authors [16,23,24]. There are multiple schools of thought regarding this hypothesis. Jackson and McManus [25] cautioned that drawing the conclusion that the loss of LL is directly correlated with LBP may be erroneous. It can also be noted that although there is a statistically significant difference between these parameters, the differences remain quantitatively small. Our values for spinopelvic parameters of PI, PT, and SS are similar to that of previously published study in Indian population by Bhosale et al. [26], but differ from those conducted by Singh et al. [27]. Cho [28], in their study on sagittal alignment in Korean population, found statistically significant gender differences (p<0.05) for the parameters PI, PT, SVA, and spino-sacral angle [13,26–29] (Table 10). The authors attributed this result to the relative pelvic retroversion because of the female reproductive system. This result correlates with our study where LL, SVA, PT, and PI values were higher in females as compared to males. Additionally, this result correlated with the study of Bhosale et al. [26] who also found a statistically significant difference in the PT and PI values between the genders. Singh et al. [27] also found higher PI values in females. Yukawa et al. [29], in the study on sagittal alignment in Japanese population, noticed a higher PI in women aged over 40 years as compared to younger women and males.

Sagittal parameters among the different ethnic groups
Previous studies have focused only few of the sagittal parameters involving spine and pelvis; however, our study is the only one that has considered all the parameters comprehensively [13,26–29]. Our study proves that the normal sagittal alignment varies across different races and ethnicities and one size does not fit all. Hence, spinopelvic parameters for surgical planning may not be universal and should be based on individual race and ethnicity.
Although there are notable and characteristic changes in the sagittal alignment of the spine with aging, pelvic parameters show a minimal variability over the years, as described in recent publications [3,16,30]. Vialle et al. [13] also observed a weak statistical relationship between age and PI (r=0.14), which is not likely to be clinically significant. The SS and PT were not related to age [13]. Hammerberg and Wood [31] evaluated 50 asymptomatic subjects aged 70–85 years, and did not find any relationship between increasing age and sacropelvic parameters of balance and morphology. Moreover, there was a tendency for PT and SS to increase and decrease with age, respectively.
This observation suggests that not only does the growth of the pelvis in the sagittal plane between the femoral heads and the upper sacral endplate ceases during adulthood, but also that the normal degenerative changes to the hips, sacrum, and sacro-iliac joints do not significantly affect the PI. In contrast, PT and SS increased and decreased slightly with aging, respectively, thereby indicating an increased retroversion of the pelvis presumably to compensate for degenerative processes (bone and soft tissues) occurring in the spine that tend to decrease the LL and induce a positive spinal balance (forward displacement of the spine) with increasing age, as observed in previous studies [20,31]. PI and SS observed in this population seemed smaller in our study than in other studies describing white populations. This concept is important because different surgical correction strategies may be appropriate in the patients of different ages.
We recognize the differences in the mean ages of the compared groups and that our patients were similar. However, we do not believe that this result explains the significant differences observed for the angular values of the different groups. Our study reveals differences in the values for pelvic parameters that may be attributable to ethnicity. Regardless of the cause of the differences, our study’s data serve as a reference for clinical practice in our environment.
To our knowledge, this is the first report that specifically describes the normal value of sagittal spinal and pelvic parameters in Indian population comparing with other ethnicities. Through this study, a cross-sectional database depicting the sagittal spinal alignment in asymptomatic adults was established, which can be referred to as a comparison for patients with spinal pathologies. Moreover, this study demonstrated that sagittal spinopelvic alignment in a standardized standing position was highly variable and significantly affected by ethnicity. This result reminds the surgeon of the necessity to differentiate the patients according to their age and ethnicity while considering whether their spinal alignments are in a normal range. The values obtained in our study should be useful in establishing goals (surgical or treatment) and planning an optimal therapeutic course for Indian population.
There are few limitations in our study. First, our study includes a single tertiary care center results extrapolated to a pan-India population. Second, being an observational study, the clinical implications of the study will be understood only after these baseline values are used in the surgical cases considering Indian population. The third limitation lies in the cross-sectional nature of the analysis for the effect of age on spinopelvic parameters. A longitudinal study should be preferable to clarify the relationship between the age and variations of spinopelvic parameters.
Conclusions
This study provides the baseline values of the sagittal alignment of thoracic, lumbar, and sacral vertebrae in asymptomatic individuals. These findings provide useful data for spine surgeons to measure the surgical corrections and fusions in thoracic, lumbar, and lumbo-sacral areas.
Notes
No potential conflict of interest relevant to this article was reported.