p38 Mitogen-Activated Protein Kinase Is Involved in Interleukin-6 Secretion from Human Ligamentum Flavum–Derived Cells Stimulated by Tumor Necrosis Factor-α
Article information
Abstract
Study Design
Human ligamentum flavum–derived cells (HFCs) were obtained from surgical samples for a basic experimental study.
Purpose
We sought to evaluate the inflammatory response of human ligamentum flavum cells to investigate hypertrophic changes occurring in the ligamentum flavum.
Overview of Literature
Lumbar spinal stenosis (LSS) is a disease commonly observed in the elderly. The number of patients with LSS has increased over time, yet the pathomechanisms of LSS still have not been fully elucidated. One of the clinical features of LSS is hypertrophy of the ligamentum flavum, which results in narrowing of the lumbar spinal canal. Some reports have suggested that ligamentum flavum hypertrophy is associated with inflammation and fibrosis; meanwhile, the p38 mitogen-activated protein (MAP) kinase is involved in the hypertrophy of human ligamentum flavum cells.
Methods
HFCs were obtained from patients with LSS who underwent surgery. HFCs were stimulated by tumor necrosis factor-α (TNF-α) and a p38 MAP kinase inhibitor, SB203580. Phosphorylation of the p38 MAP kinase was analyzed by western blotting. The concentration of interleukin-6 (IL-6) in the conditioned medium was measured by enzyme-linked immunoassay and IL-6 messenger RNA expression levels were determined by real-time polymerase chain reaction.
Results
TNF-α induced the phosphorylation of p38 MAP kinase in a time-dependent manner, which was suppressed by the p38 MAP kinase inhibitor, SB203580. TNF-α also stimulated IL-6 release in both a time- and dose-dependent manner. On its own, SB203580 did not stimulate IL-6 secretion from HFCs; however, it dramatically suppressed the degree of IL-6 release stimulated by TNF-α from HFCs.
Conclusions
This is the first report suggesting that TNF-α stimulates the gene expression and protein secretion of IL-6 via p38 MAP kinase in HFCs. A noted association between tissue hypertrophy and inflammation suggests that the p38 MAP kinase inflammatory pathway may be a therapeutic molecular target for LSS.
Introduction
Lumbar spinal stenosis (LSS) triggers severe pain in the lower back and extremities and has become a common condition afflicting elderly people worldwide [1,2]. Moreover, patients with LSS may experience specific gait disturbance characterized by intermittent claudication [3,4]. Given both the pain and gait disturbance, patients’ capacity to conduct activities of daily living when experiencing LSS is extremely limited, often leading to a decrease in the quality of life [5,6]. As the number of elderly people has increased in recent years, so too has the LSS patient population. Although surgical treatment of LSS has been discussed to a significant degree in the literature, the pathomechanisms of this disease have still not been fully elucidated.
One of the clinical features of LSS is hypertrophy of the ligamentum flavum, which, in turn, causes stenosis of the lumbar spinal canal, ultimately compressing the spinal cord or cauda equina [7,8]. However, the mechanisms responsible for ligamentum flavum hypertrophy in this context are not known. Therefore, standard treatments for LSS include drugs such as nonsteroidal anti-inflammatories, gabapentinoids, and certain opioids, which only reduce the pain without addressing the root of the problem [9,10]. When these medicines do not work well for patients, surgical interventions such as decompression are considered [11]. Therefore, there is a clear need to understand the mechanisms underpinning hypertrophy of the ligamentum flavum to facilitate the development of new therapeutic strategies to manage or even prevent LSS.
Several studies to date have focused on understanding the phenomenon of hypertrophy of the ligamentum flavum. Histological research has shown that, in elderly patients with LSS, the elasticity of the ligamentum flavum is decreased and the number of collagenous fibers is increased [12,13]. Molecular studies on ligamentum flavum cells have also been performed. Transforming growth factor-β (TGF-β) stimulated collagen messenger RNA (mRNA) expression in fibroblasts derived from ligamentum flavum tissue, suggesting that scar formation is linked to the onset of hypertrophy [14]. On the other hand, it was also reported that TGF-β is only associated with ligamentum flavum hypertrophy in the early stages of this process [15]. Other reports also support that hypertrophy of the ligamentum flavum is correlated with the onset of inflammation and fibrosis; along these lines, the expression of both fibrosis and inflammation-related genes has been observed in ligamentum flavum tissues [16,17]. In one in vitro experiment, human ligamentum flavum–derived cells (HFCs) produced interleukin-6 (IL-6) in response to leptin [18]. Elsewhere, Moon et al. reported that HFCs secreted several cytokines, including IL-6, and vascular endothelial growth factor in response to TGF-β and tumor necrosis factor-α (TNF-α) signaling [19]. Recently, Saito et al. [20] developed an animal model of lumbar ligamentum flavum hypertrophy, where the gene expression level of inflammatory cytokines was increased in the ligamentum flavum.
To explore novel treatment targets, it is important to continue to uncover the cellular and molecular mechanisms responsible for a disease. With regard to LSS, major mitogen-activated protein (MAP) kinases such as p38 MAP kinase and extracellular signal-regulated kinase (ERK)1/2 have been confirmed to be stimulated by recombinant human growth and differential factor in ligamentum flavum cells [21]. Other research indicates TGF-β stimulates connective tissue growth factors in HFCs through the p38 MAP kinase pathway [22].
While there are indications that inflammation is involved in ligamentum flavum hypertrophy, to date, only limited evidence regarding the signaling mechanism exists. In this study, we focused on TNF-α and IL-6, which are representative inflammatory cytokines. The purpose of this study was to evaluate the involvement of p38 MAP kinase in the gene expression and secretion of IL-6 stimulated by TNF-α in HFCs.
Materials and Methods
1. Study design
We conducted this study in compliance with the principles of the Declaration of Helsinki. The study’s protocol was reviewed and approved by the Institutional Review Board of Nagoya City University (IRB approval no., 60-18-0215). Ligament flavum tissues were collected from patients who underwent surgery due to LSS and who provided written informed consent for involvement in this research. The study population included five men and two women aged 63–78 years (mean age, 70.6 years). The surgical level ranged from L1/2 to L5/S and the mean thickness of ligamentum flavum as measured by magnetic resonance imaging was 5.1 mm (Table 1).
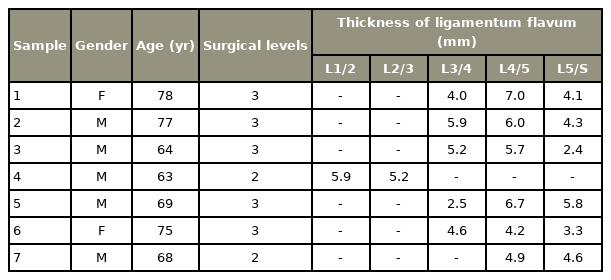
Sample list
2. Isolation of cells from human ligamentum flavum tissue
HFCs were isolated according to the method of a previous report [23]; briefly, surrounding tissue was carefully removed and washed clean of blood with physiological saline solution. Hard tissue was removed with a large enough margin so as to exclude ossified tissue. After the tissue was obtained, it was minced with scissors into pieces of approximately 3 mm3, then subjected to sequential enzyme-digestion with 0.2% collagenase type I (Wako Pure Chemical Industries, Osaka, Japan) in Dulbecco’s Modified Eagle Medium (DMEM; Wako Pure Chemical Industries, Osaka, Japan) without fetal bovine serum (FBS; Gibco, Gaithersburg, MD, USA) for 1 hour. Tissue washed with phosphate-buffered saline was then digested with 0.025% collagenase type I in DMEM containing 5% FBS overnight at 37°C in a humidified atmosphere of 5% CO2. HFCs were finally obtained by filtration through a 70-μm membrane and seeded into a 75 cm2 flask with DMEM containing 10% FBS. The medium was changed twice a week and, after 2 weeks, the cells reached subconfluency and were subcultured for experiments. HFCs appear as spindle-shaped cells like fibroblastic cells. Cells from passages 1 through 3 were used for the experiments.
3. TNF-α stimulation and p38 MAP kinase inhibition of HFCs
HFCs were seeded in six-well plates at a density of 2.0×10⁵ cells/well in 10% DMEM supplemented with FBS. After the cells reached subconfluency, the medium was replaced with 0.3% DMEM supplemented with FBS. For TNF-α (Funakoshi, Tokyo, Japan) stimulation experiments, when indicated, the p38 MAP kinase inhibitor SB203580 (10 μm; Cayman Chemical, Ann Arbor, MI, USA) was added 1 hour prior to the addition of TNF-α (0.1–10 ng/mL). To analyze the phosphorylation of p38 MAP kinase, cells were harvested using radioimmunoprecipitation assay (RIPA) buffer (NACALAI, Kyoto, Japan) at the indicated time and cell protein was extracted for use in western blotting. To assess IL-6 production, the conditioned medium was collected at the indicated times up to 48 hours and examined by enzyme-linked immunosorbent assay (ELISA). For gene expression analysis, cells were harvested using TRIzol (Thermo Fisher Scientific, Waltham, MA, USA) and mRNA was extracted for use in reverse transcription-quantitative polymerase chain reaction (RT-qPCR).
4. Western blot analysis
Cells were harvested using RIPA buffer with protease inhibitor. Sodium dodecyl sulfate–polyacrylamide gel electrophoresis was performed on 10% polyacrylamide gels and western blot analysis was performed using antibodies against p38 MAP kinase and phospho-p38 MAP kinase, with peroxidase-labeled antibodies adopted as secondary antibodies (Cell Signaling, Danvers, MA, USA). The peroxidase activity on the polyvinylidene difluoride membrane was detected using ECL substrate (Bio-Rad, Hercules, CA, USA) and visualized with an Amersham Imager 680 blot and gel imager (Cytiva, Tokyo, Japan). The listed experiments were repeated using different cell preparations.
5. IL-6 assay
The levels of IL-6 in conditioned medium from HFCs were measured using the D6050 human IL-6 Quantikine ELISA kit (R&D Systems, Minneapolis, MN, USA), according to the manufacturer’s protocol. The data are presented as the average of biological triplicates with standard deviation values. The experiments were repeated using different cell preparations.
6. Gene expression analysis
Cultured cells were harvested using TRIzol (1 mL). After adding 0.2 mL chloroform and centrifuging the samples, total RNA was extracted from the aqueous phase. Total RNA was then obtained after further purification using a PureLink RNA Mini Kit (Thermo Fisher Scientific). Complementary DNA was synthesized using the iScript RT Supermix for RT-qPCR (Bio-Rad) and was amplified with specific primers (glyceraldehyde 3-phosphate dehydrogenase; Hs.PT.39a.22214836, IL-6; Hs.PT.58.40226675, IDT) using the Fast SYBR Green Master Mix (Thermo Fisher Scientific). Gene expression was determined by RT-qPCR using the QuantStudio 12K Flex real-time PCR system (Thermo Fisher Scientific). The PCR process was as follows: one cycle at 95°C for 20 seconds, then 40 cycles of 95°C for 1 second and 60°C for 20 seconds. Relative mRNA expression levels of IL-6 were normalized to GAPDH (glyceraldehyde 3-phosphate dehydrogenase) mRNA levels and calculated using the 2−ΔΔCt method. The data are presented as the average of biological triplicates with standard deviation values. The experiments were repeated using different cell preparations.
7. Quantitative data presentation and statistical analyses
As mentioned, the compiled data were analyzed using biological triplicates per condition. Data are presented as the average of the experimental values of biological triplicates with standard deviation values. A two-tailed Student t-test was used for statistical analysis and differences were considered significant when the p-value was less than 0.05. Experiments were repeated at least twice to demonstrate reproducibility.
Results
1. TNF-α–induced phosphorylation of p38 MAP kinase in HFCs
We first examined whether p38 MAP kinase was phosphorylated in response to TNF-α stimulation in HFCs. While the phosphorylation of p38 MAP kinase was not detected in the absence of TNF-α stimulation, the addition of TNF-α did induce p38 MAP kinase phosphorylation in a time-dependent manner (Fig. 1A), which reached its maximum level 10 minutes after TNF-α stimulation. However, this phosphorylation was suppressed by SB203580, a p38 MAP kinase inhibitor (Fig. 1B).
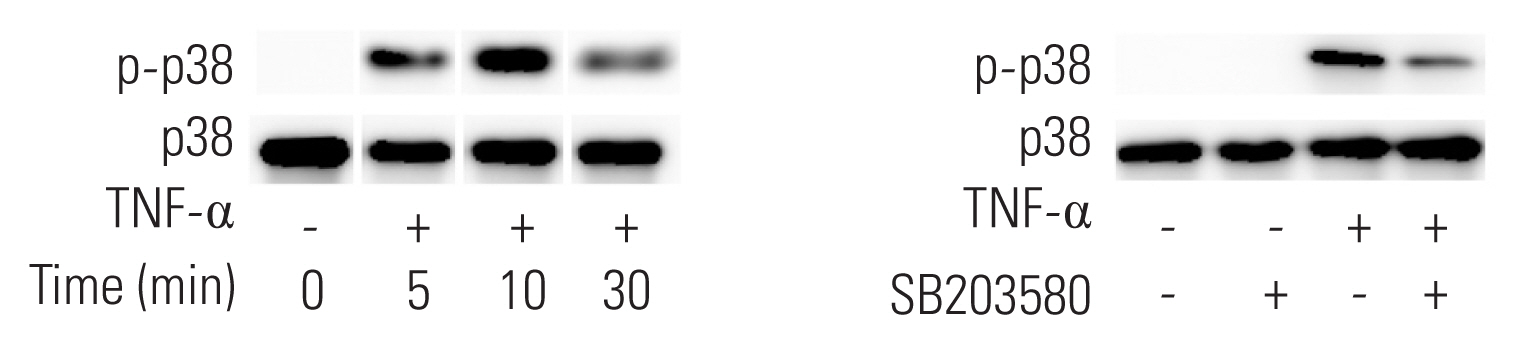
Tumor necrosis factor-α (TNF-α) induces the phosphorylation of p38 MAP kinase. p38 mitogen-activated protein (MAP) kinase phosphorylation was detected by western blotting. (A) TNF-α (10 ng/mL) time-dependently induces p38 MAP kinase phosphorylation (p-p38). Maximum phosphorylation is observed at the 10-minute time point. (B) A p38 MAP kinase inhibitor, SB203580 (10 μM), suppresses TNF-α–induced phosphorylation of p38 MAP kinase.
2. TNF-α–induced IL-6 release from HFCs
Next, we investigated whether TNF-α triggered IL-6 release from HFCs. For this assessment, TNF-α (10 ng/mL) was added to the culture medium and the medium was collected at the indicated times up to 48 hours after stimulation. Fig. 2A indicates that TNF-α induced IL-6 release in a time-dependent fashion for up to 48 hours. Next, we tested whether IL-6 release from HFCs was linked to the concentration of TNF-α. TNF-α (0.1–10 ng/mL) was added to the culture medium and the medium was collected at 48 hours after TNF-α stimulation. Fig. 2B confirms that TNF-α dose-dependently stimulated IL-6 release from HFCs.
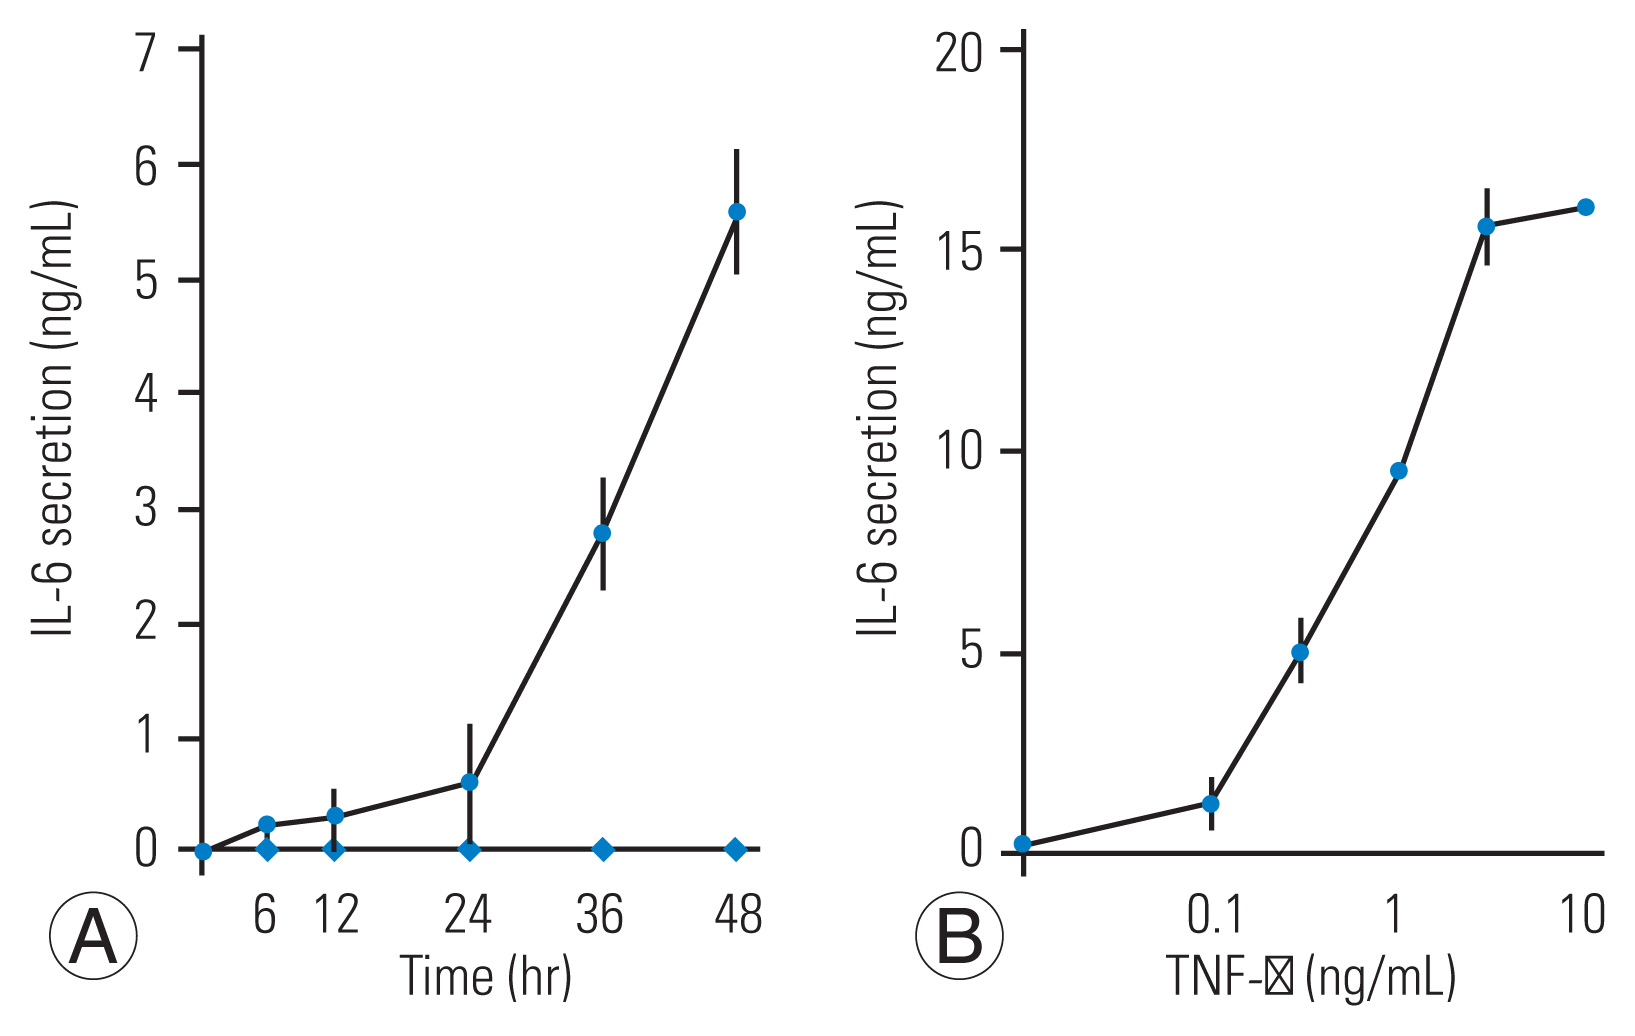
Tumor necrosis factor-α (TNF-α) stimulates interleukin-6 (IL-6) stimulates IL-6 secretion from human ligamentum flavum–derived cells (HFCs). (A) TNF-α (10 ng/mL, ●) or vehicle (◆) was added to the culture medium, after which conditioned medium was collected at the indicated time and IL-6 was measured by enzyme-linked immunosorbent assay. TNF-α (10 ng/mL) stimulates IL-6 secretion up to 48 hours after TNF-α stimulation. (B) Various doses of TNF-α were added to HFCs, and the conditioned medium was collected at the 48-hour time point. TNF-α dose-dependently stimulates IL-6 secretion.
3. p38 MAP kinase is involved in IL-6 release from HFCs
We also tested whether p38 MAP kinase was involved in IL-6 production from TNF-α–stimulated HFCs. SB203580 (10 μM) was added to the culture medium for 1 hour prior to TNF-α (10 ng/mL) treatment and the conditioned medium was collected at 48 hours after TNF-α stimulation. Fig. 3 shows that, when administered on its own, SB203580 did not trigger IL-6 release from HFCs, although it did dramatically suppress TNF-α–stimulated IL-6 release from HFCs (92% suppression).
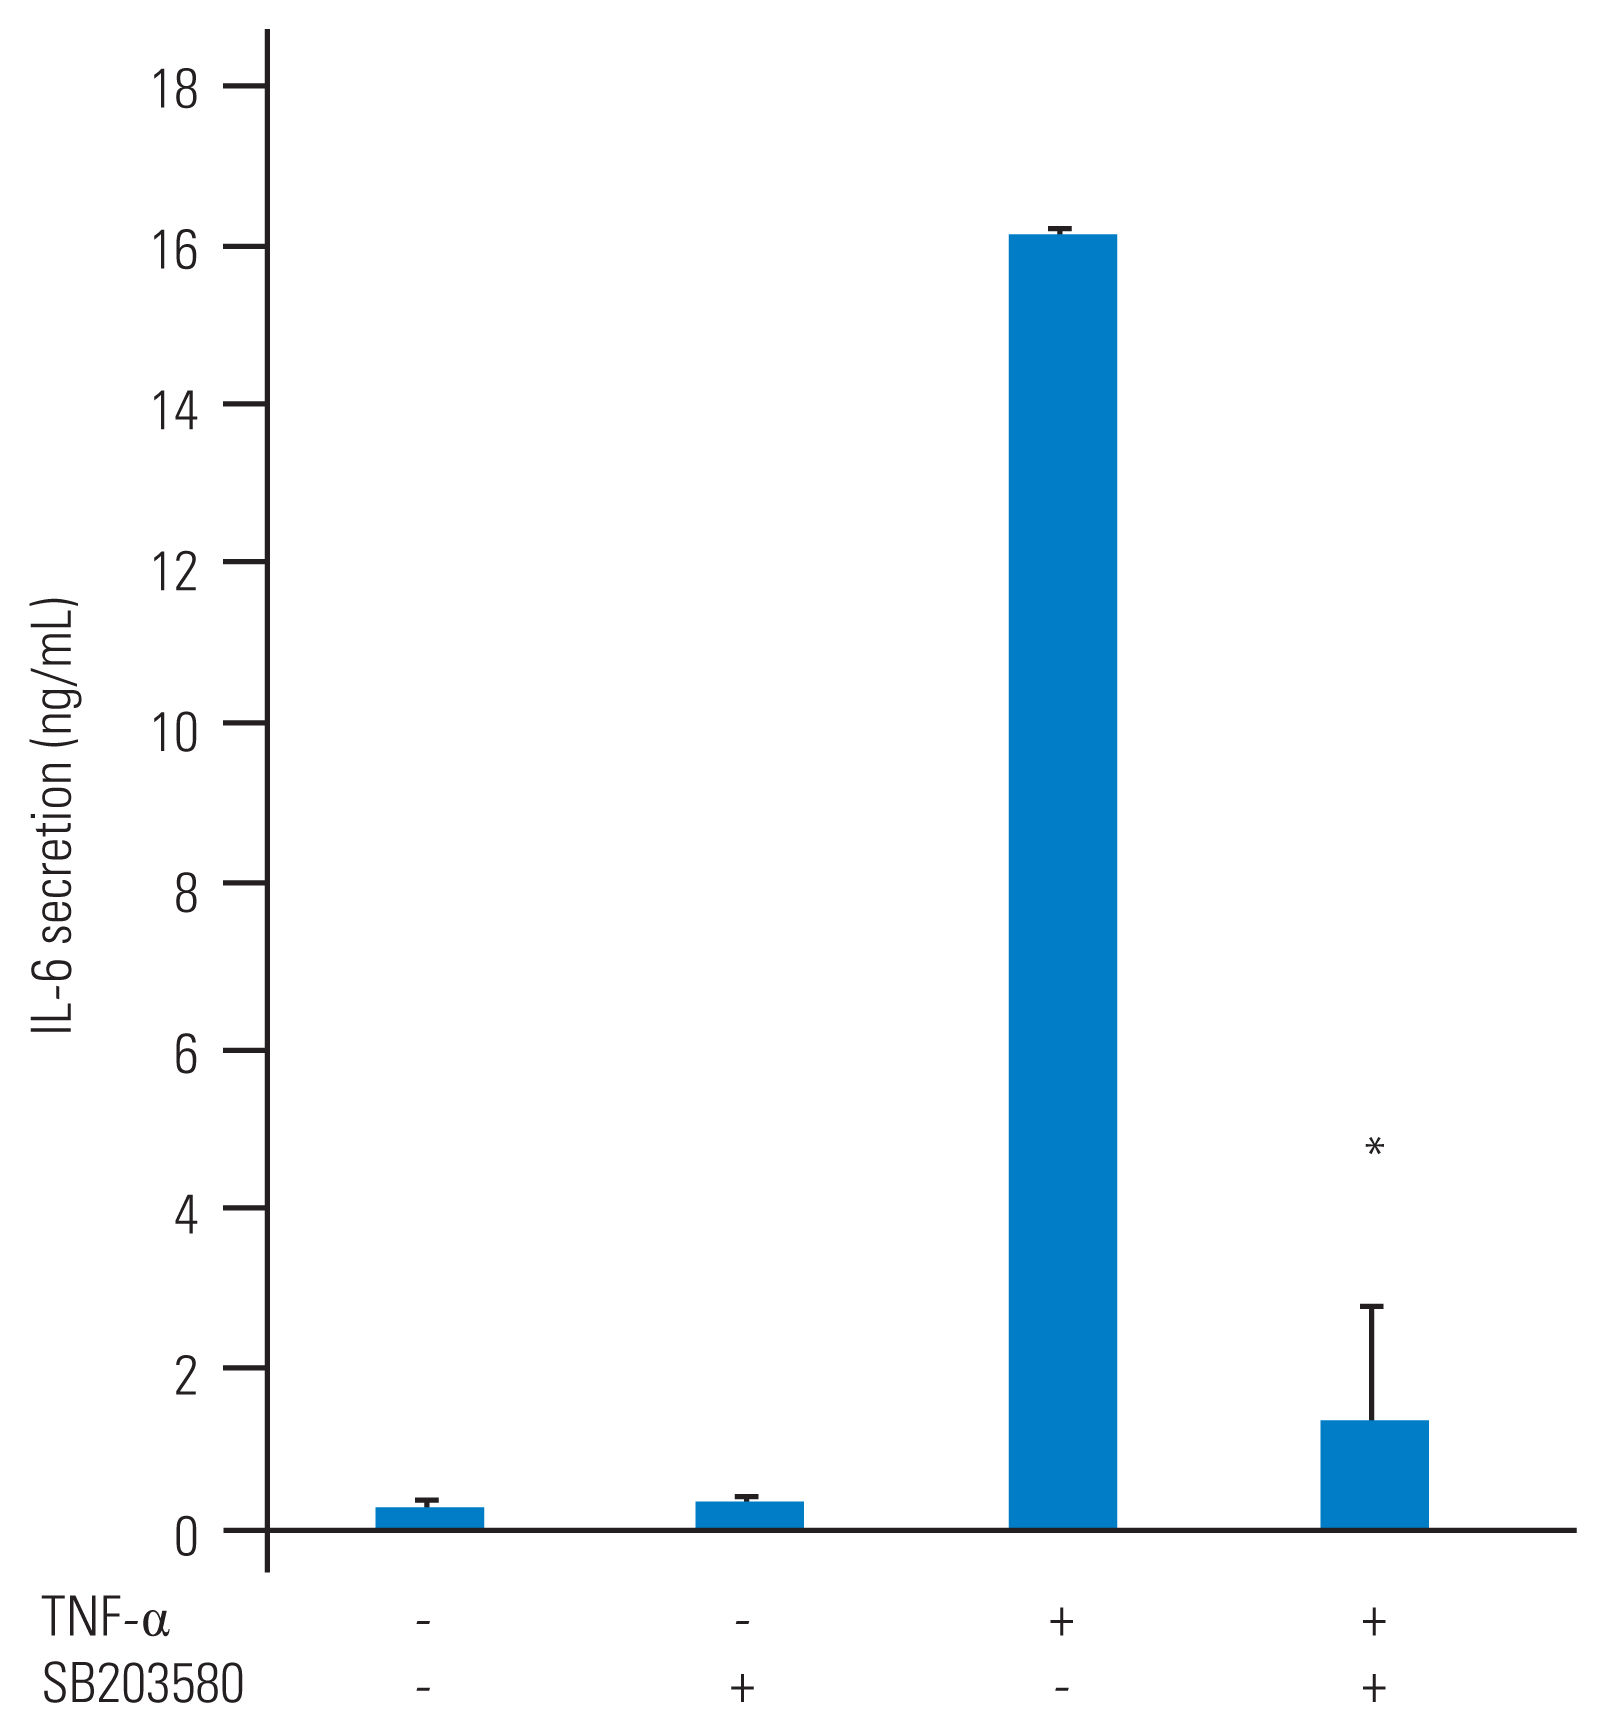
p38 mitogen-activated protein (MAP) kinase regulates tumor necrosis factor-α (TNF-α) stimulated interleukin-6 (IL-6) secretion from human ligamentum flavum–derived cells (HFCs). SB203580, a p38 MAP kinase inhibitor (10 μM), was added to HFCs as a pretreatment and TNF-α (10 ng/mL) was added 1 hour later. The conditioned medium was collected at the 48-hour time point. SB203580 significantly suppresses TNF-α stimulated IL-6 secretion from HFCs. *p<0.05, compared to TNF-α.
4. p38 MAP kinase controls TNF-α–stimulated IL-6 mRNA expression
Finally, we attempted to discern the level at which p38 MAP kinase controls TNF-α–stimulated IL-6 production in HFCs. Since p38 MAP kinase was activated at an early time point (10 minutes) after TNF-α stimulation, we hypothesized that p38 MAP kinase may regulate IL-6 gene expression. To explore this possibility, total RNA was extracted from HFCs 6 hours after TNF-α stimulation and processed for RT-qPCR analysis. Notably, IL-6 gene expression was strongly stimulated by TNF-α, while, interestingly, TNF-α–stimulated gene expression was significantly suppressed by SB203580 (Fig. 4).
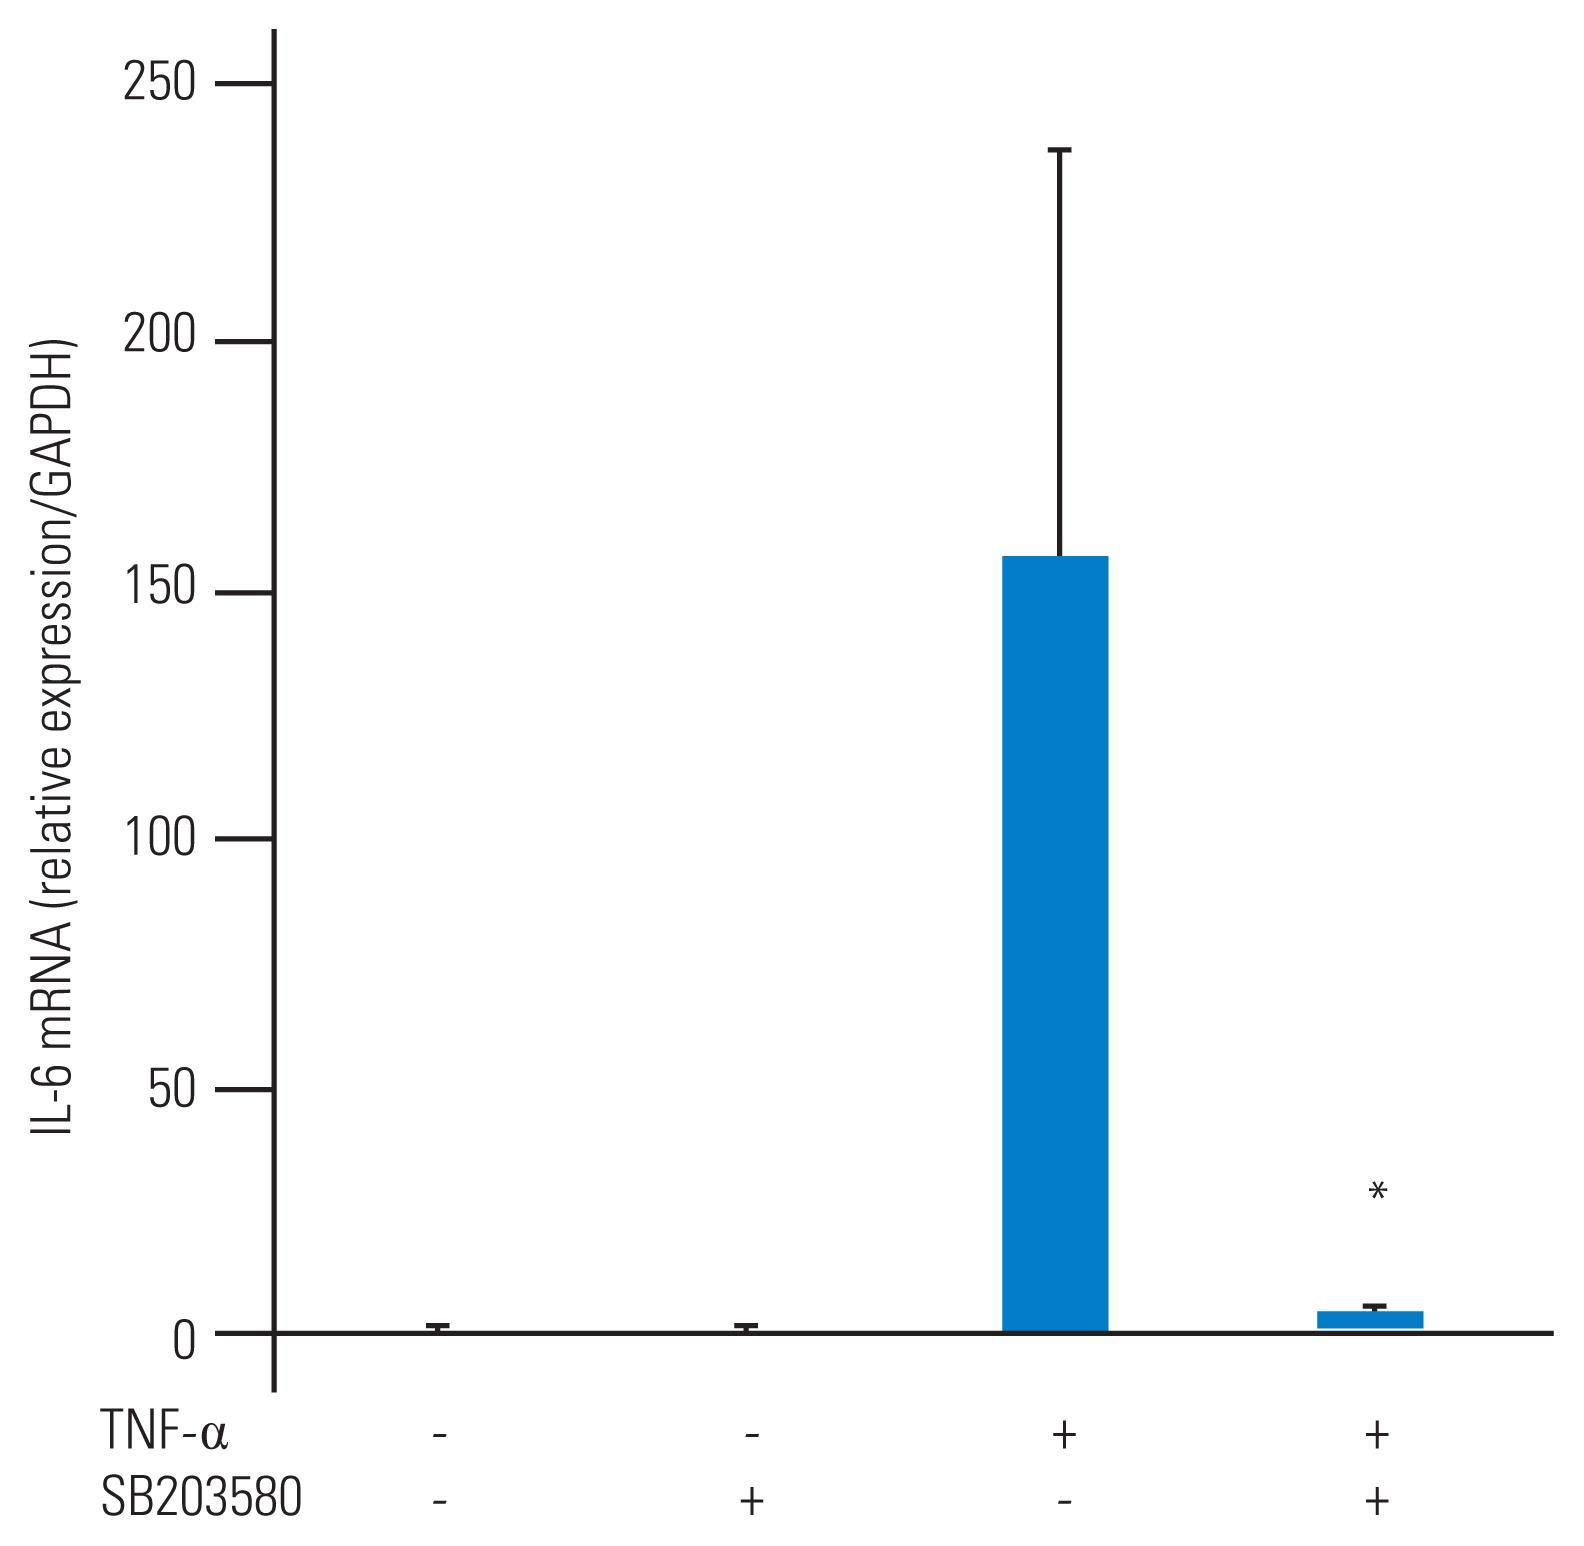
Tumor necrosis factor-α (TNF-α)–stimulated interleukin-6 (IL-6) gene expression is regulated by p38 mitogen-activated protein (MAP) kinase. SB203580, a p38 MAP kinase inhibitor (10 μM), was added to human ligamentum flavum–derived cells (HFCs) as a pretreatment and TNF-α (10 ng/mL) was added 1 hour later. Cells were harvested by TRIzol after 6 hours of TNF-α stimulation. Gene expression was measured by real-time polymerase chain reaction. Normalized gene expression is shown as 2-ΔΔCt (glyceraldehyde 3-phosphate dehydrogenase [GAPDH] was used as a housekeeping gene). TNF-α stimulates IL-6 mRNA expression. SB203580 significantly suppresses TNF-α-stimulated IL-6 mRNA level. *p<0.05, compared to TNF-α.
Discussion
To our knowledge, this is the first report to show that TNF-α stimulates the gene expression and secretion of IL-6 via p38 MAP kinase in HFCs. To date, some reports have considered TNF-α–stimulated tissue hypertrophy or fibrotic changes as a pathomechanism of disease. For example, in osteoarthritis, TNF-α has been linked to chondrocyte hypertrophy, which is the starting point of abnormal modulation [24]. Moreover, both TNF-α and IL-6 are often reported as key molecules associated with cardiac hypertrophy in heart failure [25]. p38 MAP kinase was also shown to be activated in cardiac hypertrophy, where treatment using a p38 MAP kinase inhibitor able to enhance the survival of hypertensive stroke-prone rats [26]. Furthermore, TNF-α–induced p38 MAP kinase is related to cardiac pathophysiology [27]. Therefore, p38 MAP kinase may be a possible therapeutic molecular target for diseases that encompass tissue hypertrophy. However, though studies on cardiac hypertrophy have been accumulating in the literature, little is known about the role of the inflammatory response in ligamentum flavum hypertrophy, which is a phenotype in LSS patients.
As a molecular mechanism, p38 MAPK was reported to be involved in TNF-α–stimulated IL-6 synthesis in rheumatoid synovial fibroblasts or osteoblasts [28,29]. However, there are no reports suggesting the relationship between TNF-α and p38 MAP kinase in ligamentum flavum tissue to date. On the other hand, some studies have suggested the involvement of cellular signaling pathways such as p38 MAP kinase or ERK1/2 activation by other stimulators in the ligamentum flavum [21,22]. Growth and differentiation factor 5 (GDF5) was shown to induce the osteogenic differentiation of HFCs through the activation of ERK1/2 and p38 MAP kinase, while human ligamentum flavum fibroblast inflammation was induced by p38 MAP kinase and JNK (c-Jun N-terminal kinase) stimulation [30]. These findings pushed us to investigate the inflammatory mechanism of ligamentum flavum hypertrophy, especially considering the role of cellular signaling.
In the present study, we confirmed that TNF-α stimulated the phosphorylation of p38 MAP kinase in HFCs that were obtained from patients with LSS who underwent surgery. Although p38 MAP kinase has been reported to be activated by GFD5 in HFCs [21], our results constitute the first study suggesting that TNF-α activates p38 MAP kinase in HFCs. The phosphorylation of p38 MAP kinase was induced as early as five minutes after TNF-α stimulation and the phosphorylation decreased after 30 minutes. This time course is earlier than that associated with GDF5, which is probably due to the difference in stimulating agents involved. We confirmed that the phosphorylation of p38 MAP kinase was suppressed by SB203580, a p38 MAP kinase inhibitor, in HFCs. We then examined whether TNF-α stimulated IL-6 in HFCs, ultimately determining that TNF-α dose-dependently (0.1–10 ng/mL) stimulated IL-6 secretion from HFCs. Notably, the secretion of IL-6 continued for up to 48 hours after TNF-α stimulation. Interestingly, SB203580 did not alter the IL-6 secretion at all yet significantly suppressed TNF-α–stimulated IL-6 secretion from HFCs. SB203580 pretreatment also significantly suppressed mRNA gene expression stimulated by TNF-α. These findings suggest that TNF-α–stimulated IL-6 secretion mediates the inflammatory response in the ligamentum flavum through p38 MAP kinase.
In the present study, some limitations exist. First, we used ligamentum flavum cells collected from LSS patients—ligamentum flavum cells taken from healthy controls or patients with other conditions might behave differently. Assessing ligamentum flavum tissue from young patients such as lumbar disc herniation or scoliosis might be useful in future research. Second, the in vitro environment is different from the in vivo environment. To further evaluate the clinical relevance of whether IL-6 is related to hypertrophy of the ligamentum flavum, further investigations of IL-6 and p38 MAP kinase expression levels in clinical samples are necessary. Considering this research, eventually, when a p38 MAP kinase inhibitor is applied to LSS patients to prevent ligamentum flavum hypertrophy, the level of suffering attributed to LSS may decrease and patients could lead a life with less pain or disturbance to their gait. To explore new therapeutic strategies targeting the pathomechanism of ligamentum flavum hypertrophy, more detailed cellular signaling mechanisms should be investigated using HFCs.
Conclusions
We isolated HFCs from patients who underwent LSS surgery and cultured them as monolayers. We showed that p38 MAP kinase mediates mRNA and the protein expression of IL-6 in TNF-α–stimulated HFCs
Notes
Conflict of Interest
No potential conflict of interest relevant to this article was reported.
Author Contributions
Kiyoshi Yagi and Kenji Kato wrote and prepared the manuscript. Kiyoshi Yagi, Yuta Goto, and Kenji Kato planed, collected, and analyzed experimental data. Kiyoshi Yagi, Yuta Goto, Kenji Kato, Nobuyuki Suzuki, Akira Kondo, Yuya Waseda, Jun Mizutani, Yohei Kawaguchi, Yuji Joyo, Yuko Waguri-Nagaya, and Hideki Murakami discussed the design of this study. All authors have read, reviewed, and approved the article.
Acknowledgements
This work was supported by the Grants-in-Aid for Scientific Research of the Japan Society for the Promotion of Science (Grant no., 17K16697 and 19K18506). The authors are grateful for the assistance of the Research Equipment Sharing Center at Nagoya City University.