


Introduction
Cervical spondylotic myelopathy (CSM) is a very common degenerative disease of the spine in the elderly [1]. Spondylotic compressive myelopathy develops progressively owing to long-standing segmental compression of the spinal cord. Reduction of the anteroposterior diameter of the spinal canal is the primary pathophysiological change with secondary spinal cord compression. Clinical symptoms include gait instability, weakness, numbness or loss of fine motor skills in the upper limb, and urinary urgency [2]. Although conventional magnetic resonance imaging (MRI) is an excellent modality for the determination of spondylotic changes, it is known to have a sensitivity as low as 65% in the identification of myelopathy [3]. In several patients who exhibit apparent clinical symptoms, such as extremity numbness and motion dysfunction, conventional magnetic resonance (MR) imaging shows no abnormal cord signal intensity. Conservative treatment options, such as bracing and traction, are effective for mild myelopathic symptoms. However, if prolonged without improvement, the opportunity for surgery would be lost, leading to poor postoperative outcomes [4].
Diffusion anisotropy in the white matter originates from its specific organization in bundles of myelinated axonal fibers that run in parallel. Apparent diffusion coefficient (ADC) is the average magnitude of molecular displacement by diffusion; thus, the higher the ADC, more isotropic the medium. Fractional anisotropy (FA) depicts the directionality of the molecular displacement via diffusion, with values ranging from 0 (isotropic) to 1 (infinite anisotropic diffusion). It is now known that in nerve fiber impairment, the medullary sheath is destroyed, and the diffusion of water molecules in one particular direction or anisotropy is lost. Hence, diffusion tensor imaging (DTI) is superior to conventional MRI for detecting disease processes that alter the water movement in the spinal cord at a microscopic level. Demyelination of the neural tracts reduces FA because the diffusion of water molecules is easier across damaged axonal membranes than across intact myelin sheaths. Therefore, DTI could be used for the evaluation of the axonal pathology underlying CSM [1,5–7]. However, its efficacy should be substantiated for use by the treating clinicians. The present study was designed to evaluate the quantitative parameters of the DTI matrix (FA and ADC values) and determine the subsequent correlation with the clinical assessment of disease severity in CSM.
Materials and Methods
A prospective observational study was conducted for patients aged ≥18 years who were clinically suspected of CSM and were referred to the department of radiology from February 2018 to May 2019 (16 months) for MRI of the cervical spine. Approval by the Ethics Committee of Medanta-The Medicity, Gurugram, India was obtained before study initiation (IRB approval no., MICR No. 840/2018). Each subject underwent comprehensive physical and neurological examinations that were conducted by orthopedic or neurosurgeon from the research team, and the diagnosis of cervical compressive myelopathy was established based on the clinical scoring that was derived by the clinician as per the signs and symptoms described in the established modified Japanese Orthopaedic Association (mJOA) system [8]. All patients with claustrophobia, metal implants, pacemaker, previous spinal surgery, cervical trauma history, stroke, and/or other neurological disease(s), cervical radiculopathy with no clinical evidence of cervical myelopathy, absence of radiological evidence of cervical canal stenosis, and multilevel compression/stenosis were excluded from the study. Written consent was obtained from all the patients before MR imaging. MRI examinations was performed using a 3T MRI system (Siemens Verio; Siemens Healthineers AG, Erlangen, Germany) with a DTI protocol (Table 1) that comprised a 20 direction echo planar imaging-based DTI sequence (at B value 0, 700) in an axial plane in addition to routine imaging that included sagittal T1, T2, short-tau inversion recovery, and axial T1, T2 weighted fast spin echo sequences and a sagittal T2 SPACE (sampling perfection with application-optimised contrasts using different flip angle evolutions) three-dimensional (3D) acquisition. Fiber tractography (FT) image was generated via the integration of 3D white matter trajectories and was only used as a visualization tool. DTI images were processed using the MR scanners 3D software (Syngo; Siemens Healthineers AG) and analyzed by a fellowship-trained single reader (>6 years’ experience) who was blinded to clinical findings to produce FA and ADC values of the acquired axial slices with regions of interest (ROIs) placed within the stenotic and non-stenotic segments. Proper precautions were taken while placing the ROI to avoid partial-volume effects from the adjacent bone and cerebrospinal fluid, hemorrhage, necrosis, and calcifications. The cross-sectional area of the spinal cord is different in the stenotic and non-stenotic segments; therefore, the sizes of the ROIs were not always the same in stenotic and non-stenotic segments, ranging from 30–45 mm2. Multiple measurements were obtained, and the mean FA and ADC values were selected for the analysis. Inter-observer and intra-observer coefficients of variations were 30% and 32%–41%, respectively, for this technique [9,10]. The final quantitative radiological derivations were matched with the clinical scoring system. Comparison of the FA and ADC values was performed using analysis of variance (ANOVA) test, and the results were subjected to multiple comparison Bonferroni test. Receiver operating characteristic (ROC) analysis was performed to obtain a cut-off value for FA and ADC at different spinal levels. We compared the sensitivity, specificity, negative predictive value, and positive predictive value of FA, ADC, and T2WI in recognizing myelopathy.
Results
In this prospective study, we enrolled 52 subjects (28 [53.8%] women and 24 [46.2%] men) with a mean age of 53.16 years who had different symptoms of myelopathy, graded as mild (n=11), moderate (n=25), and severe (n=16) according to the mJOA scoring system and had undergone MRI of the cervical spine with the DTI protocol. The part studied for all these patients was from the craniovertebral junction up to the C7 vertebral level, using the parameters set by us; the level most affected in our study was C5–C6 in 28 patients (53.8%), followed by C4–C5 in 12 (23.1%), C3–C4 in 6 (11.5%), C6–C7 in 5 (9.6%), and C2–C3 in 1 (1.9%).
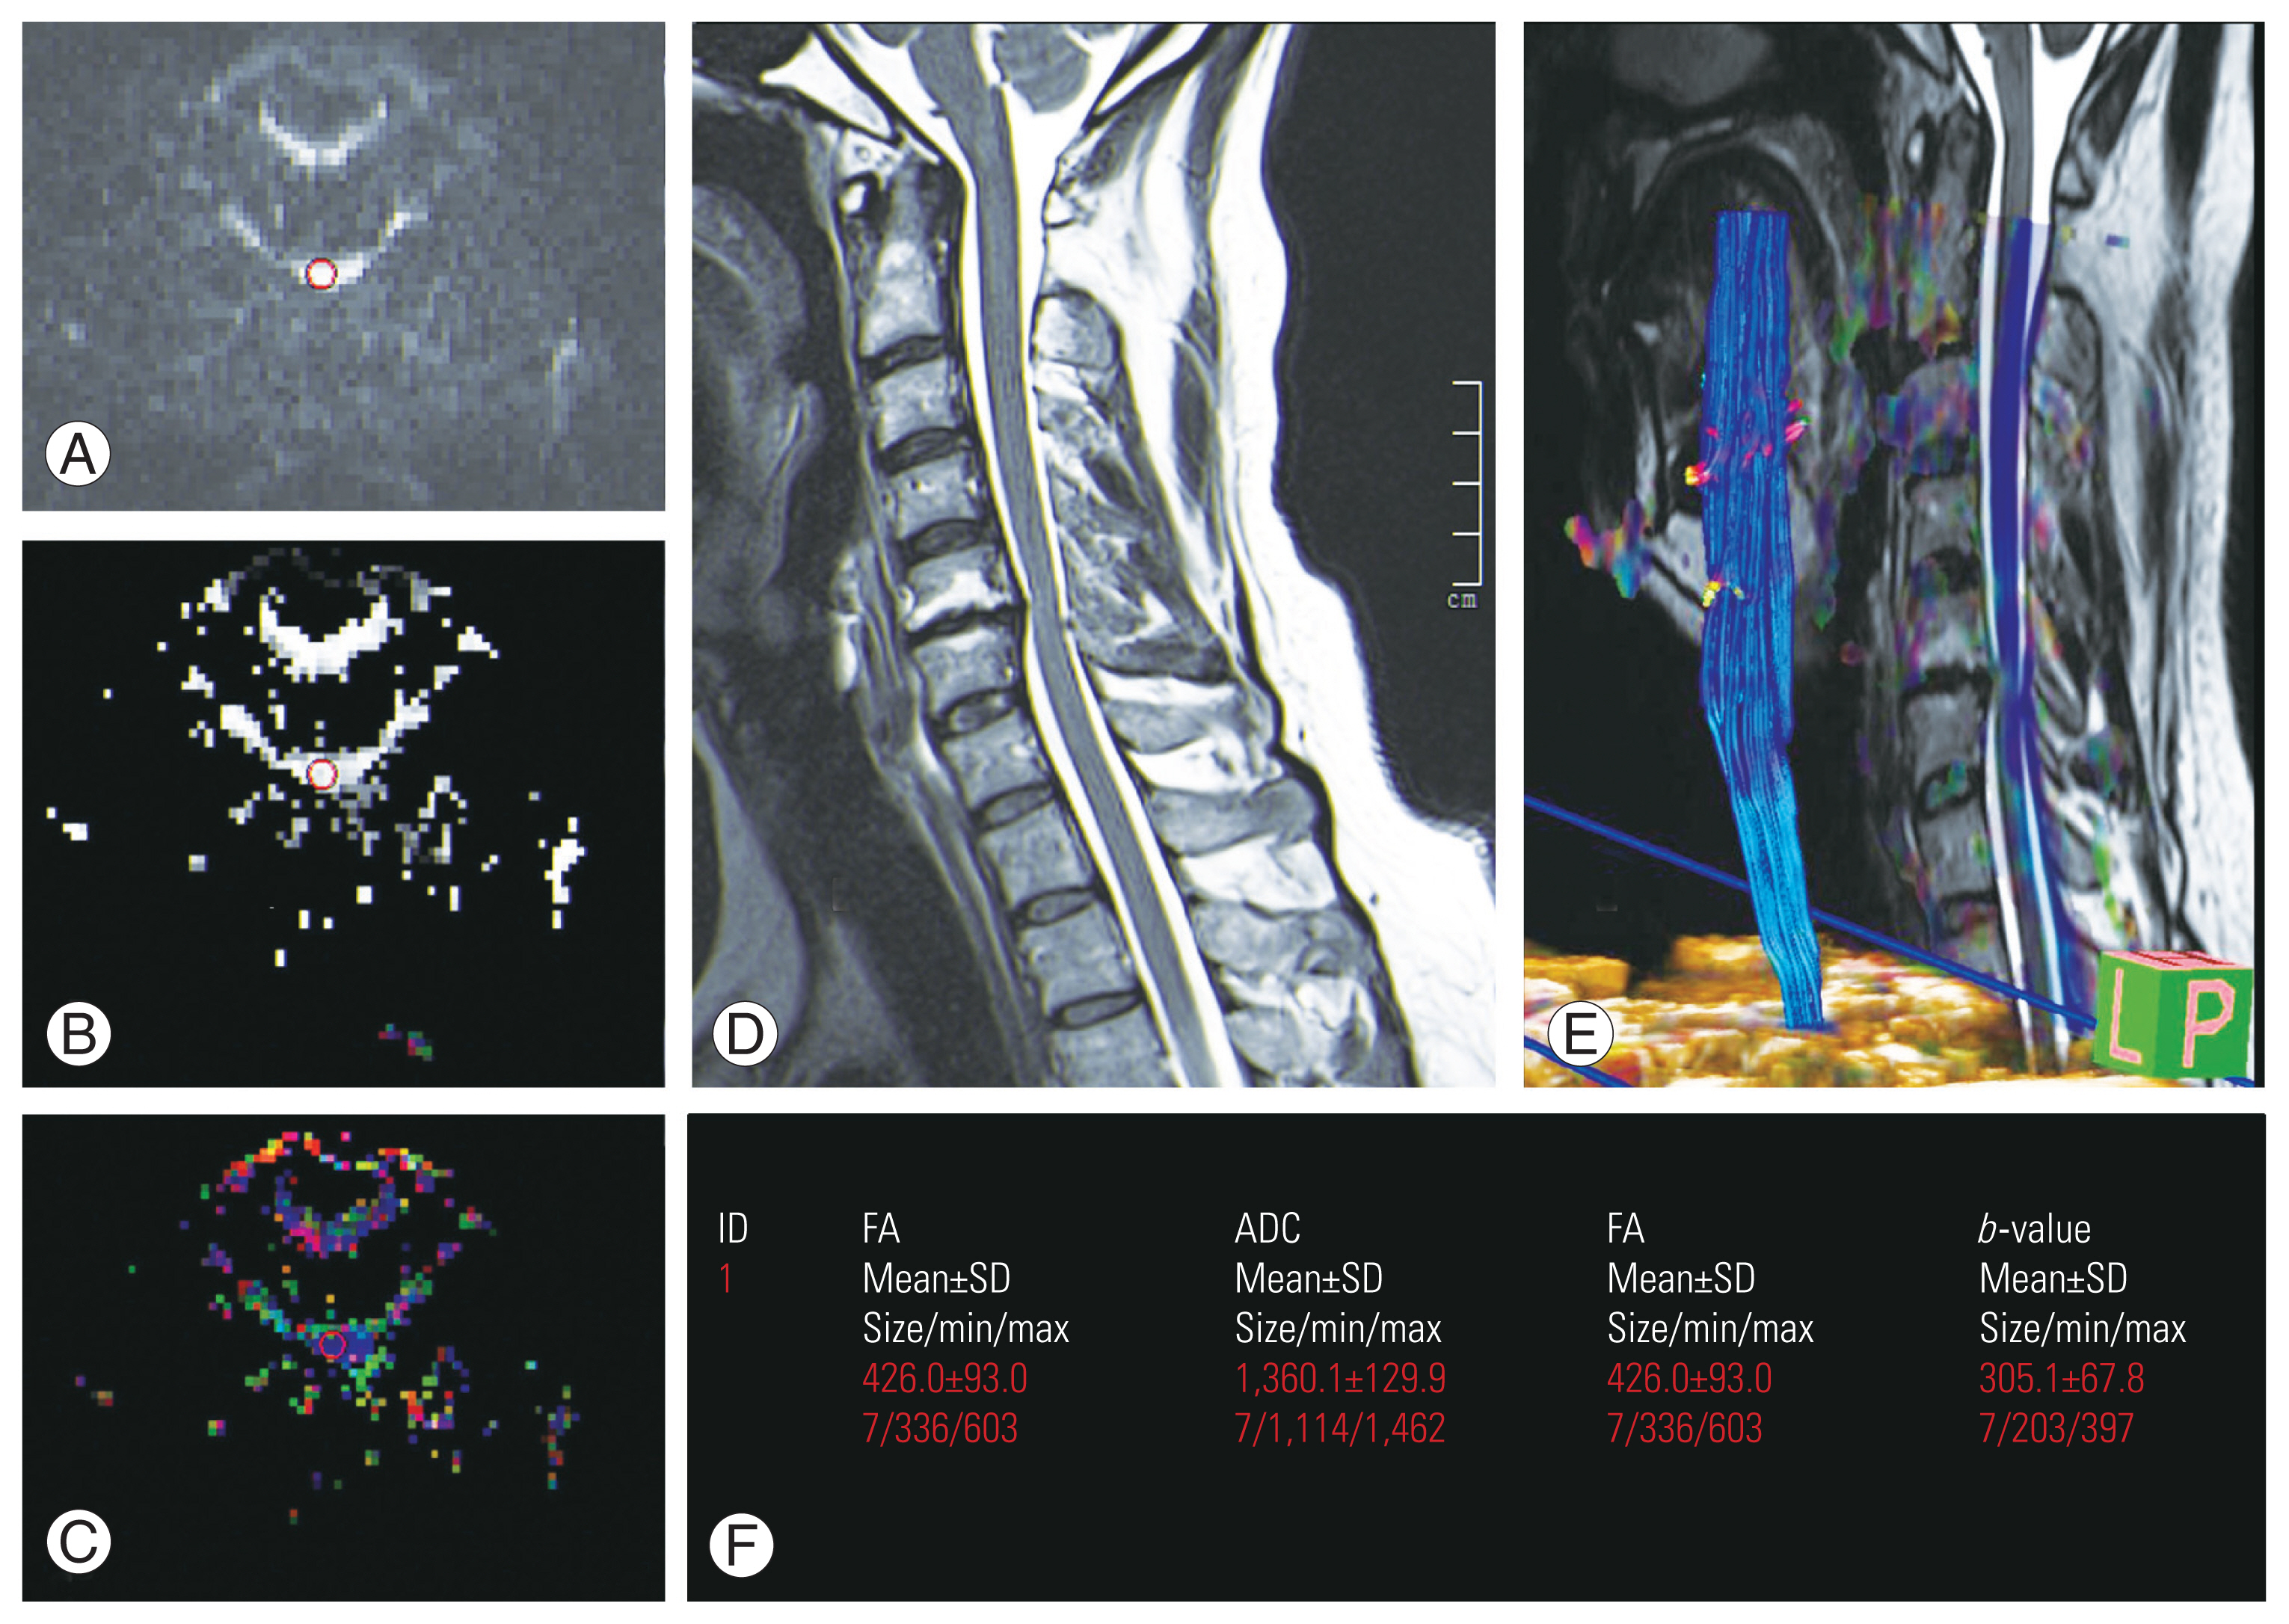
In the most stenotic segments, the mean FA value was significantly lower (0.5009±0.087 versus 0.655.7±0.104, p<0.001), and the mean ADC value was significantly higher (1.196.5±0.311 versus 0.9370±0.284, p<0.001) than that in the non-stenotic segments. Stenotic segments showed a decrease in the FA and an increase in the ADC values of the spinal cord (Fig. 1). Comparison of the values performed using ANOVA suggested high significance with p-value <0.05 at certain levels (Table 2). These results were subjected to multiple comparison Bonferroni test that showed p-values from 0.000 to 0.024 at different level of the spinal canal to differentiate between the different grades of severity using FA and ADC value (Table 3).
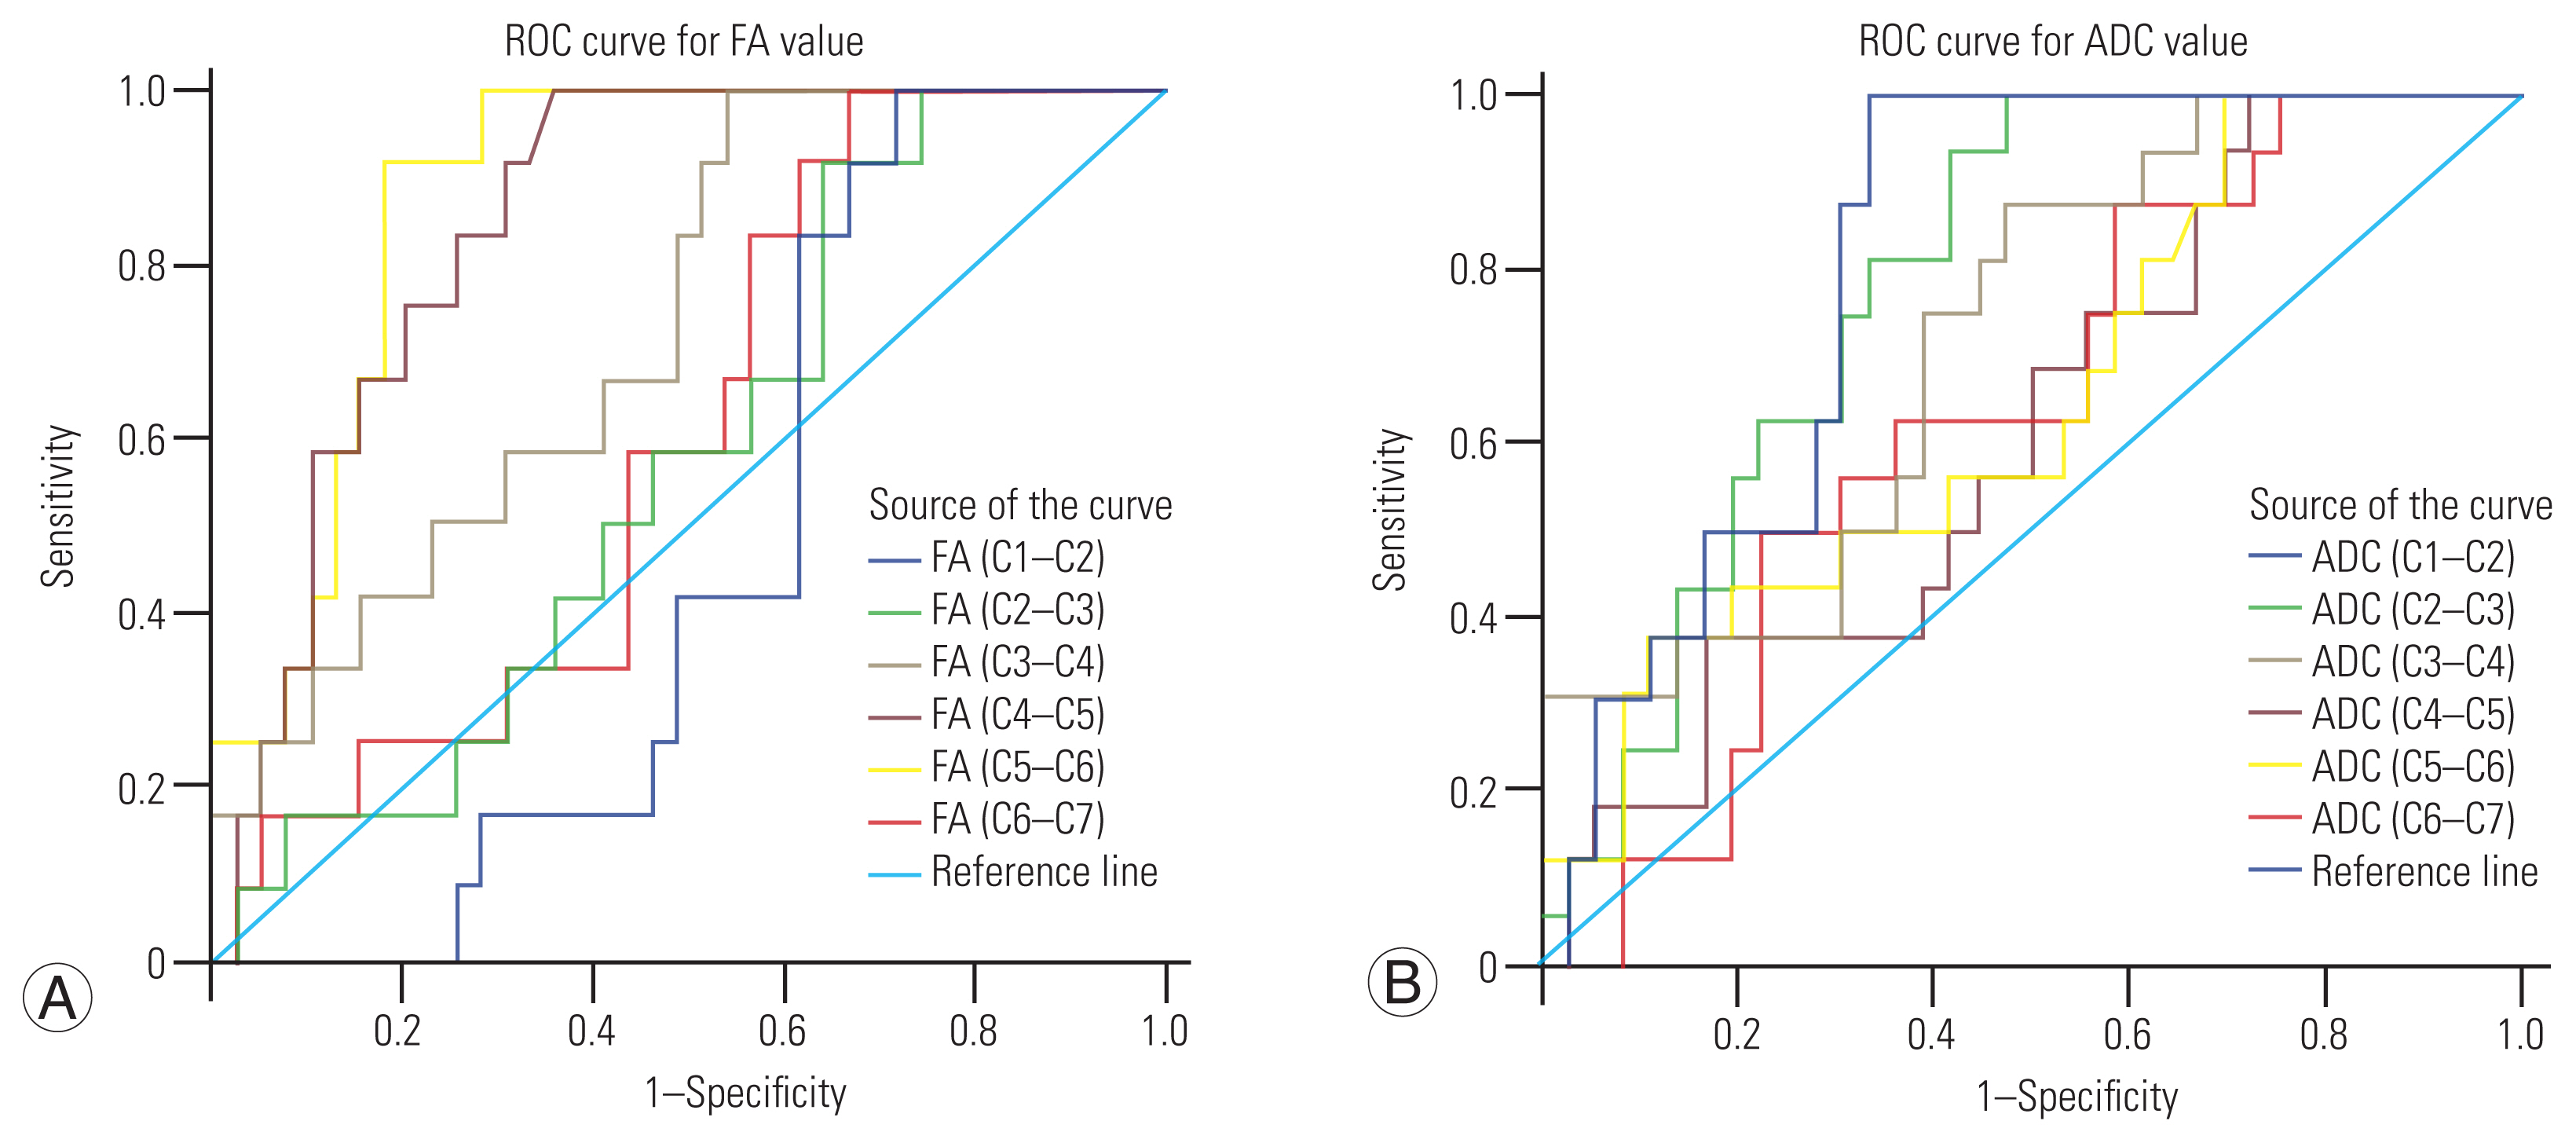
We performed ROC to determine the accuracy of the FA and ADC values (Fig. 2). Based on the co-ordinate on the curve, we propose a cut-off index at different spinal levels for both FA and ADC (Table 4). The proposed optimum cut-off values for FA and ADC at C1–C2 level were 0.669 and 0.908, those for C2–C3 were 0.603 and 0.996, those for C3–C4 were 0.499 and 1.063, those for C4–C5 were 0.547 and 1.068, those for C5–C6 were 0.460 and 1.296, and those for C6–C7 were 0.591 and 1.137, respectively.
In addition, we found a negative correlation between the FA and ADC values (r=0.63, p=0.002). FA values had a higher sensitivity of 72.7% than ADC (27.3%) in cases with mild CSM (Table 5). The overall sensitivity (Table 6) in identifying DTI metrics abnormalities was more with FA (87.5%) and ADC (75.0%) than with T2 weighted images (25%).
Discussion
Cervical spondylosis is the most common disorder of the spine and is a normal part of aging that affects >2/3rd of the world population [4]. The condition can remain benign with episodic pain or may progress to debilitating spinal cord dysfunction called CSM. Degenerative cervical spondylosis contains a spectrum of changes to the spinal cord, including myelopathy. MRI is the modality of choice for the assessment of cervical spondylosis [1]; however, it plays a limited role in the evaluation of spinal cord involvement.
Before the advent of DTI, T2-weighted imaging was the only method for assessing the intrinsic cord abnormality. Now, with DTI, it is possible to evaluate the microstructure of the spinal cord in vivo with a better sensitivity. In normal situations, water molecules in the neural tracts travel mostly in a single direction (anisotropic diffusion), resulting in an FA value closer to its highest value, that is 1. However, in pathological conditions, such as CSM, where the tracts are distorted, water molecules tend to move in all directions, resulting in decreased anisotropic diffusion and hence lower FA value, with an increase in the ADC value [11]. FT provides integrated eigenvalue and eigenvector data of the diffusion matrix and has been used as a visualization tool for evaluating spinal cord lesions [12] and for assessing changes in the length and density of tracked nerve bundles in CSM [13].
In this prospective study on 52 patients, we evaluated the efficacy of DTI as a diagnostic tool to recognize the changes in the spinal cord. In 2003, Demir et al. [14] conducted one of the first studies to use DTI in CSM with 36 patients who had spondylosis and found that myelopathy areas showed an increase in the ADC value and decrease in anisotropy with a sensitivity of 78% and T2 weighted image with a sensitivity of 57%.
In our study, the sensitivity of FA (87.5%) and ADC (75.0%) for diagnosing CSM was significantly higher than that with T2 weighted images (25%). Our findings support the results of the above-mentioned study. The mean FA value of stenotic segments in our patients was (0.5009±87.4) and was lower than the FA value (0.655.7±104.1) in non-stenotic segments. The ADC value at the stenotic segment was increased, with a mean value of 1.196.5±0.311 as compared to 0.9370±0.284 for the non-stenotic segments. Comparison of the values with ANOVA suggested a high significance with a p-value <0.05 at certain levels. Similar results have been reported by Mamata et al. [15] in whose study, the mean FA value was significantly lower (0.46±0.12 versus 0.66±0.03, p<0.001) and the mean ADC value was significantly higher (1.28±0.33 μm2/msec versus 0.75±0.06 μm2/msec, p<0.001) than those for non-stenotic segments. The above findings are also supported by Budzik et al. [6], Dong et al. [16], Vedantam et al. [17], Toktas et al. [18], and Kara et al. [19].
mJOA is an internationally used score that is used to grade the severity of CSM and classified into mild, moderate, and severe grades, depending on the score that ranges from 1 to 18 [8]. This multidimensional tool assesses three key and distinct components (upper limb dysfunction, lower limb dysfunction, and bladder dysfunction) of CSM. This score strongly correlates with FA values in CSM patients [10,17,20]. Liu et al. [21] found no correlation between the FA and ADC values and the mJOA scores in patients without high signal intensity. This may be attributable to the relatively small sample size of patients without signal change (n=20) and observer variability. However, analysis of all patients showed that FA was a useful indicator of functional status in CSM patients in their study. We found a strong correlation between the CSM mJOA score and DTI parameters and a negative correlation between FA and ADC values (r=0.63, p=0.002).
Surgery is the mainstay of CSM management; however, the optimal timing of surgery can be challenging. Standardized management guidelines for degenerative cervical myelopathy recommend surgery for patients with a moderate or severe mJOA score [22]. It is critical to distinguish patients with mild versus moderate to severe functional impairment because the management and outcomes differ, and the relative efficacy of surgery in patients with mild myelopathy remains unknown [8]. Total 11 patients (21.1%) had mild symptoms of myelopathy that indicated early onset of myelopathy changes; of these, eight patients (72.7%) and three patients (27.3%) showed abnormality on FA and ADC, respectively, while 0% of the patients showed altered signal intensity on T2WI, proving that DTI can detect the early stage of myelopathy with a good sensitivity of FA value of about 72.7%. In the moderate mJOA score category, 25 patients were studied; of these, 18 (72%) showed positive results, while 7 (28%) showed negative findings in terms of the FA values. Fourteen patients (87.5%) in the severe mJOA score group showed positive findings on FA values, and 2 (12.5%) showed negative results for the test.
The optimum cut-off values for myelopathy onset have been proposed for FA and ADC in our study based on the co-ordinate on ROC curve obtained from the total FA and ADC values (Table 3) at different spinal levels. These were not analyzed separately for each sub-group, such as the mild, moderate, and severe mJOA score group because a large study group would be required to perform statistical tests and assess the significance of these values. The proposed cut-off for the FA value was lower (0.46), and the ADC value was higher (1.29) at C5–C6 level, the level that was affected the most (53.8%) in our study. Similar results were reported by Nukala et al. [23].
Our study showed overall better sensitivity of FA as compared to that of ADC. T2 hyperintensity appeared to be least sensitive; however, it exhibited the maximum specificity (88.9%). Even though 41 patients (79%) had moderate to severe cervical myelopathy, the lower sensitivity of T2 signal change (25%) may be attributable to the fact that the mJOA scores in moderate and severe categories were on the higher side, and the patients may have presented immediately after the worsening of clinical symptoms before the onset of signal change in the spinal cord.
Our findings support the fact that DTI maybe used as a guide for operative intervention to achieve favorable patient outcomes. This view is supported by Rajasekaran et al. [4] who performed a systematic literature review using PubMed for clinical studies using DTI in adult CSM patients who were undergoing operative management. They concluded that DTI is associated with preoperative severity and postoperative outcomes in CSM patients; similar results were reported by Jones et al. [10]. Rindler at al. [24] suggested that DTI may become useful for identifying those most likely to benefit from operative intervention (level 3 evidence). Based on their study on 46 patients, Shabani et al. [25] concluded that the FA value is a better biomarker for determining the long-term outcome after spine surgery in CSM.
Conclusions
In conclusion, DTI biomarkers are a valuable tool for the qualitative assessment of degenerative CSM in adjunct to routine cervical spine MRI. These assessment parameters (FA value is superior to ADC) can help detect myelopathy even in patients with a mild grade mJOA score before irreversible changes become apparent on routine T2 weighted imaging and help enhance the clinical success of decompression surgery. The proposed cut-off values can serve as a valuable assessment tool to indicate myelopathy onset in conjunction with clinical scores to assess the need for surgery. Lack of pathological correlation, follow-up of temporal change in the DTI values, and postoperative improvement in DTI parameters are the limitations of this study and need future research.