


Introduction
In recent years, the incidence of lumbar spinal stenosis (LSS) has been growing with an increase in the aging population. In a large-scale study of 938 patients with a mean age of 66 years, its prevalence was approximately 10%. LSS impairs patients’ quality of life and has now become a major social issue [1]. In some cases of LSS, the visualized site of maximum stenosis does not reveal the site of neurological impairment, which may lead to difficulties in determining surgical indications [2].
Schizas et al. [3] performed morphological evaluations based on changes in intraspinal cauda equina innervation in spinal canal stenosis. However, intraspinal lesions were primarily diagnosed based on morphology alone, and quantitative assessment methods have been unavailable.
Magnetic resonance imaging (MRI) allows acquisition of diffusion-weighted image (DWI) by enhancing water molecule movements (diffusion) with the application of motion probing gradient from one direction to proton diffusion movement [4-7]. DWIs are widely used to diagnose acute cerebral infarctions [8] or other central neurological deseases [9,10]. Nerve fibers are anisotropic tissue as they have axon cellular membrane and myelin sheaths, which interrupt the water molecule diffusion. The selective recording of this data is called diffusion tensor imaging (DTI), and the visualization of nerve fibers via DTI is known as tractography. The parameter representing anisotropy includes fractional anisotropy (FA) which ranges from 0 to 1. FA has a of 1 in anisotropic tissues and approaches the value of 0 in water. Some studies reported the usefulness of DTI in evaluating demyelinating diseases (such as multiple sclerosis) or chronic peripheral nerve compression lesions (such as carpal tunnel syndrome) [11,12]. In intact myelinated nerves, tissue myelin sheath restricts water molecule diffusion, thereby results in potent anisotropy. However, in demyelinated conditions such as nerve injury, there is a reduction in tissue anisotropy which causes a decrease in FA value [13,14]. In terms of the lumbar spinal region, there are studies reported on the use of DTI to evaluate the lumbar nerve root [15-20]. However, imaging of the spinal cord is challenging due to technical limitations such as the relatively small size of the spinal cord, susceptibility artifacts from tissue-bone interfaces and the motion artifacts arising from respiratory activity. We previously reported that in patients with lumbar foraminal stenosis, the tract was blocked at the stenotic site and apparent diffusion coefficient (ADC) values and FA values were correlated with clinical symptoms [15,16]. Therefore, DTI parameters can predict neurological severity and serves potential tools for functional diagnosis of LSS. Despite advances in DTI of lumbar nerve, intraspinal nerves are affected by the magnetic susceptibility anisotropy of cerebrospinal fluid (CSF), hence making DTI assessment difficult.
Kanamoto et al. [21] found that reduced field of view (rFOV) with localized excitation (focus) can be used to acquire a high resolution and high intraspinal signal-to-noise image, which overcome the limitations associated with conventional methods.
Our purpose was to investigate the correlation between clinical symptoms and morphological findings of spinal canals using the DTI parameters ADC and FA, and to determine their usefulness for quantitative assessment of LSS.
Materials and Methods
1. Participants
All procedures in this study were performed in accordance with the ethical standards of the institutional and/or national research committee and the 1964 Helsinki declaration and its later amendments or comparable ethical standards. Informed consent was obtained from all participants prior to participation in any study-related procedures. We performed 3.0 Tesla MRI in five healthy volunteers (four men, one woman; mean age, 27.2 years) and 27 patients with LSS (14 men, 13 women; mean age, 58.4 years). In the healthy volunteers, two discs between L4/5 and L5/S1 were imaged, resulted in a total of 10 intervertebral discs. On the other hand, MRI scan of one to three consecutive intervertebral spaces in LSS patients was taken depending on the stenotic site. A total of 52 intervertebral discs were examined: (1) one disc: L4/5 in one patient and L5/S1 in three patients; (2) two discs: L2/3 and L3/4 in one patient, L3/4, and L4/5 in five patients, L4/5 and L5/S1 in 15 patients; and (3) three discs L3/4, L4/5, L5/S in two patients.
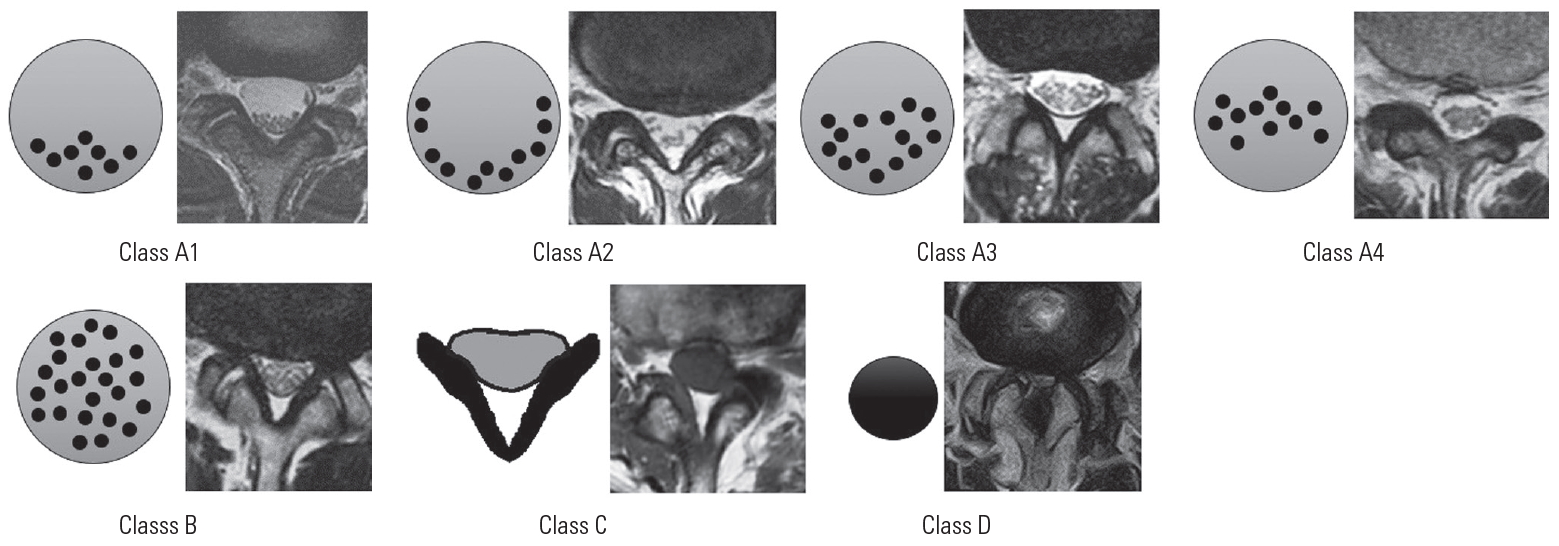
LSS was diagnosed based on spinal myelogram, MRI, and computed tomography findings after spinal myelogram by three spinal surgery specialists. Exclusion criteria included history of lumbar spine surgery, vertebral osteomyelitis, spinal tumors, or spinal trauma. Each intervertebral disc was classified based on a T2-weighted axial image according to the Schizas classification as A (A1–A4), B, C, or D (Fig. 1). No patients in our study had lesions in class D.
2. Conventional magnetic resonance imaging
All participants were imaged using a 3.0 Tesla MRI (Discovery MR 750; GE Healthcare, Waukesha, WI, USA), which provided sagittal T1-weighted (T1W) and T2-weighted (T2W) images and axial T2W images. For the sagittal imaging, the acquisition settings were: field of view (FOV), 260×260 mm; slice thickness, 3 mm; and echo time (TE)/time of repetition (TR), 8.4/530 ms (T1W) or 104/4,540 ms (T2W). For the axial imaging, the acquisition settings were: FOV, 160×160 mm; slice thickness, 4 mm; and TE/TR, 100/4,500 ms.
3. Diffusion tensor imaging protocol
The DTI protocol included DTI sequences in the axial plane with the rFOV [20]. The participants were scanned in a supine position using Sense XL Torso coil (Philips Healthcare, Best, The Netherlands). The rFOV scan was performed using a special sensitivity array encoding technique (factor: 2, spectral-spatial radio frequency pulse and water excitation method), a diffusion-weighted spinecho single-shot echo-planar imaging with free breathing technique, 11 different diffusion gradients, and a b-value of 800 sec/mm2. The rFOV was created using FOV optimized and constrained undistorted single-shot sequence sequence and two-dimensional spatially selective echoplanar radiofrequency excitation pulse (GE Healthcare). The 16 slices for rFOV (contiguous thickness, 3 mm) were acquired from L3 to S1 nerve roots. The parameters were as follows: TR, 6,000 ms; TE, 55.6 ms; 6 excitations, FOV, 100×60 mm; matrix, 68×34; voxel size, 1.47×1.76×3 mm; and total acquisition time, 7 minutes 18 seconds.
4. Image analysis
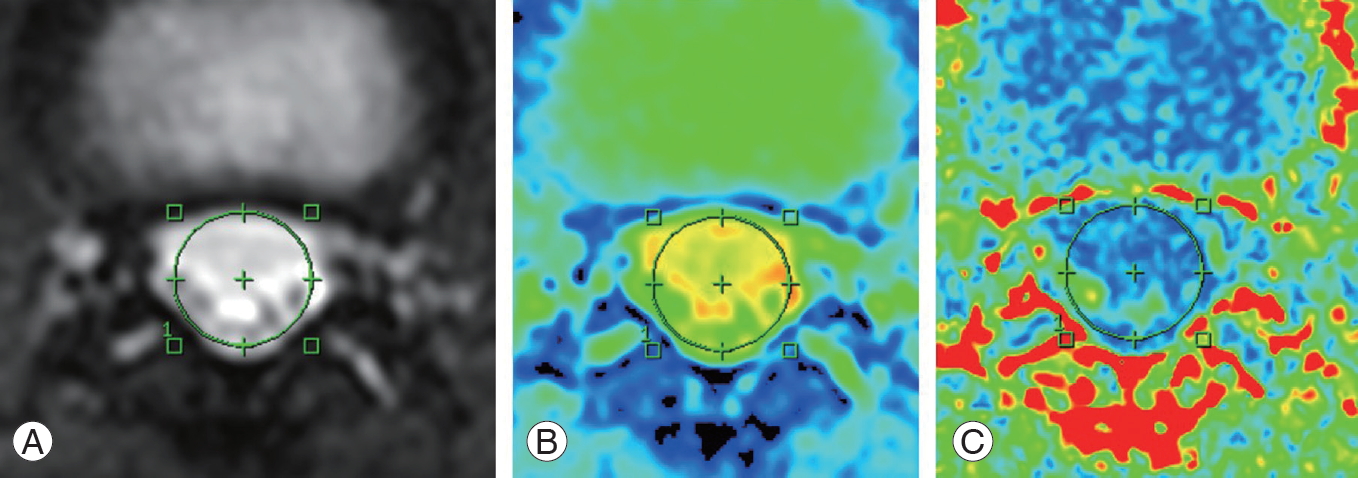
Axial images were obtained at each intervertebral level and an intraspinal region of interest was established. ADC, FA and intraspinal canal areas were each measured twice (Fig. 2). Two spinal surgery specialists (M.N. and T.S.) with 10 or more years of experience took these measurements. Intra-observer reliability (M.N.) and interobserver reliability (M.N. versus T.S.) were also calculated.
Clinical symptoms included low back pain (LBP). A visual analysis scale score of 5 or greater (0 [no pain] to 10 [greatest pain imaginable]) was defined positive for LBP. Intermittent claudication (IMC) was diagnosed if lower limb pain forced the patient to stop after walking for 500 m or less and hence defined as positive for IMC. The Japanese Orthopedic Association (JOA; 0–29 points) scoring system was used to assess bladder rectal disorder (bladder and bowel dysfunction [BBD]). The normal JOA score is 29 points, based on three subjective symptoms (9 points), three clinical signs including straight-leg raising (6 points), seven activities of daily living (14 points), and bladder disorder (−6 points). Bladder function scores for mild dysfunction: frequency, residual urine (−3 points), and severe dysfunction: urinary retention, incontinence (−6 points) were defined as positive for BBD.
ADC and FA values were assessed in LSS patients at the site of most severe stenosis as follows: (1) ADC and FA values, and intraspinal canal areas in healthy subjects were compared to LSS patients. (2) ADC and FA values were compared to Schizas classification and intraspinal canal areas in LSS patients. (3) ADC and FA values, and clinical symptoms (LBP, IMC, and BBD) were studied in LSS patients.
5. Statistical analysis
Statistical analyses were performed using StatView software ver. 5.0 (Stata Corp., College Station, TX, USA). For each parameter, differences between both groups or clinical severities were evaluated using unpaired t-test. Pearson correlation coefficients were calculated to determine the correlation between diameter of spinal canal and DTI parameters in the LSS group. All data were expressed as mean±standard deviation. A threshold probability value of p<0.05 was considered statistically significant.
Results
1. Comparison of ADC and FA values, and intraspinal canal areas in healthy subjects and LSS patients
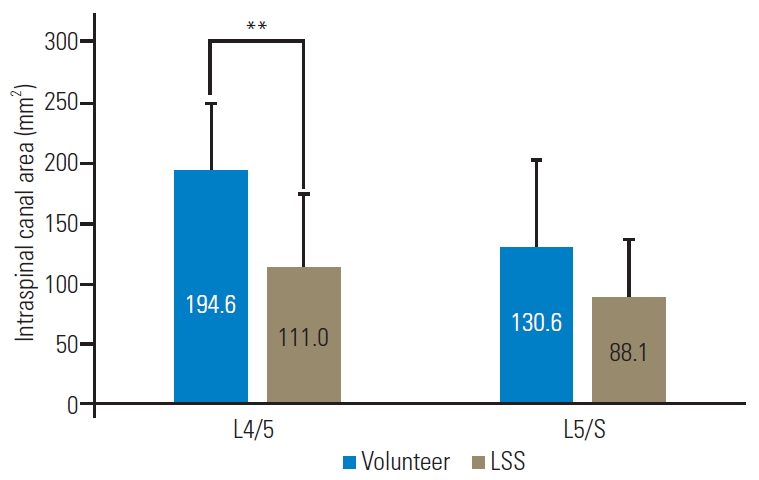
Intraspinal canal areas in healthy subjects were 194.6±55.6 mm2 at L4 and 130.6±71.9 mm2 at L5/S. In LSS patients, the intraspinal canal area was 111.0±64.4 mm2 at L4/5 and 88.1±48.7 mm2 at L5/S. Areas were significantly smaller at the L4/5 in the LLS patient group. No statistically significant differences were noted at L5/S (Fig. 3).
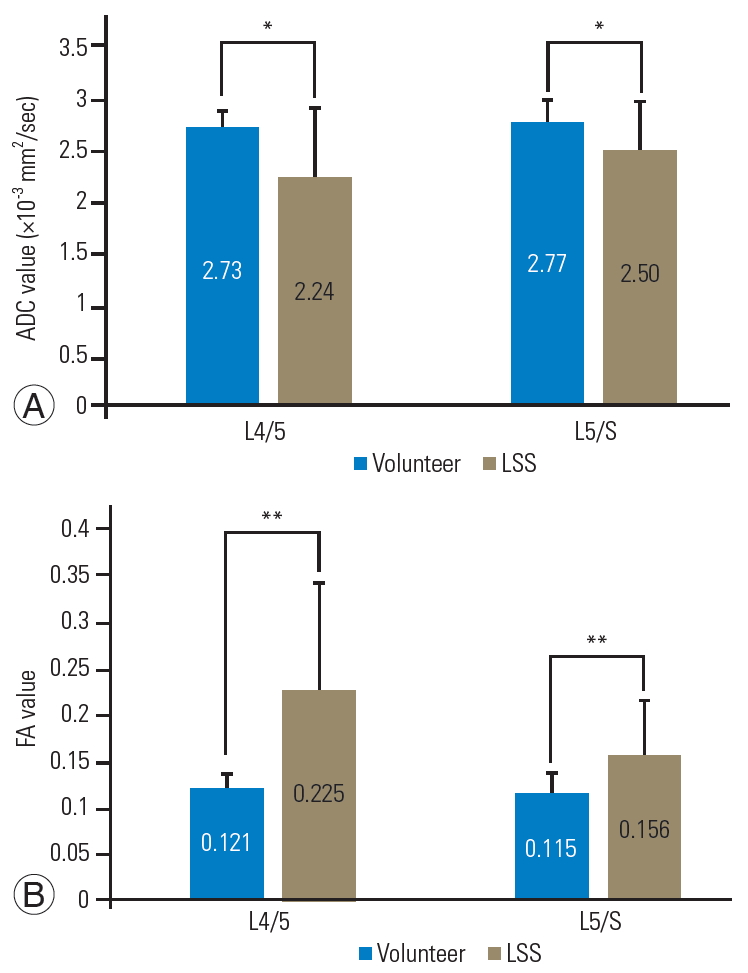
ADC values of normal healthy individuals at L4/5 were 2.72±0.18×10⁻³ mm2/sec and 2.77±0.18×10⁻³ mm2/sec at L5/S. The ADC values of LLS patient values were significantly lower at both L4/5 and L5/S, as evidenced by ADC values of 2.24±0.68×10⁻³ mm2/sec at L4/5 and 2.50±0.49×10⁻³ mm2/sec at L5/S (Fig. 4A).
In healthy subjects, FA values were 0.121±0.017 at L4/5 and 0.115±0.024 at L5/S. Meanwhile, FA values in LLS patients were 0.225±0.119 at L4/5 and 0.156±0.058 at L5/S, indicating that the FA values were significantly higher at both L4/5 and L5/S sites in the LSS patients (Fig. 4B).
2. ADC and FA values compared to Schizas classification and intraspinal canal area in LSS patients
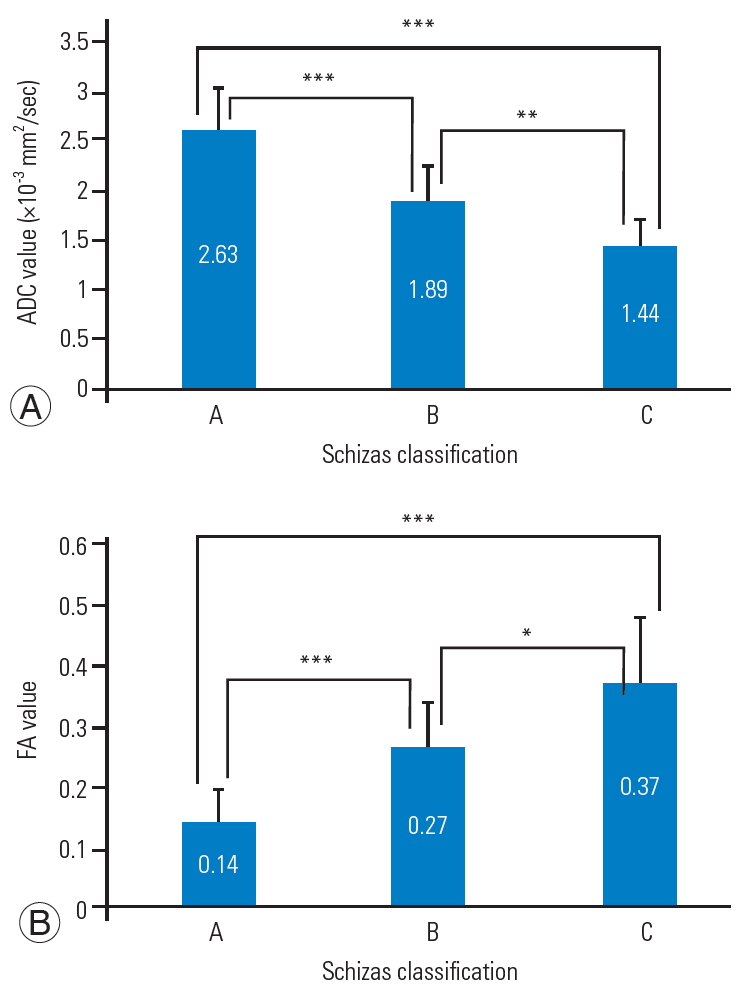
ADCs were 1.44±0.27×10⁻³ mm2/sec in Schizas class C, 1.89±0.35×10⁻³ mm2/sec in class B and 2.63±0.41×10⁻³ mm2/sec in class A, showing that ADC values decreased significantly from class A to B to C (Fig. 5A). Conversely, FA values significantly increased with disease aggravation where class C was 0.372±0.105, class B was 0.267±0.074 and class A was 0.144±0.055, class C had the highest FA value, followed by class B and A (Fig. 5B).
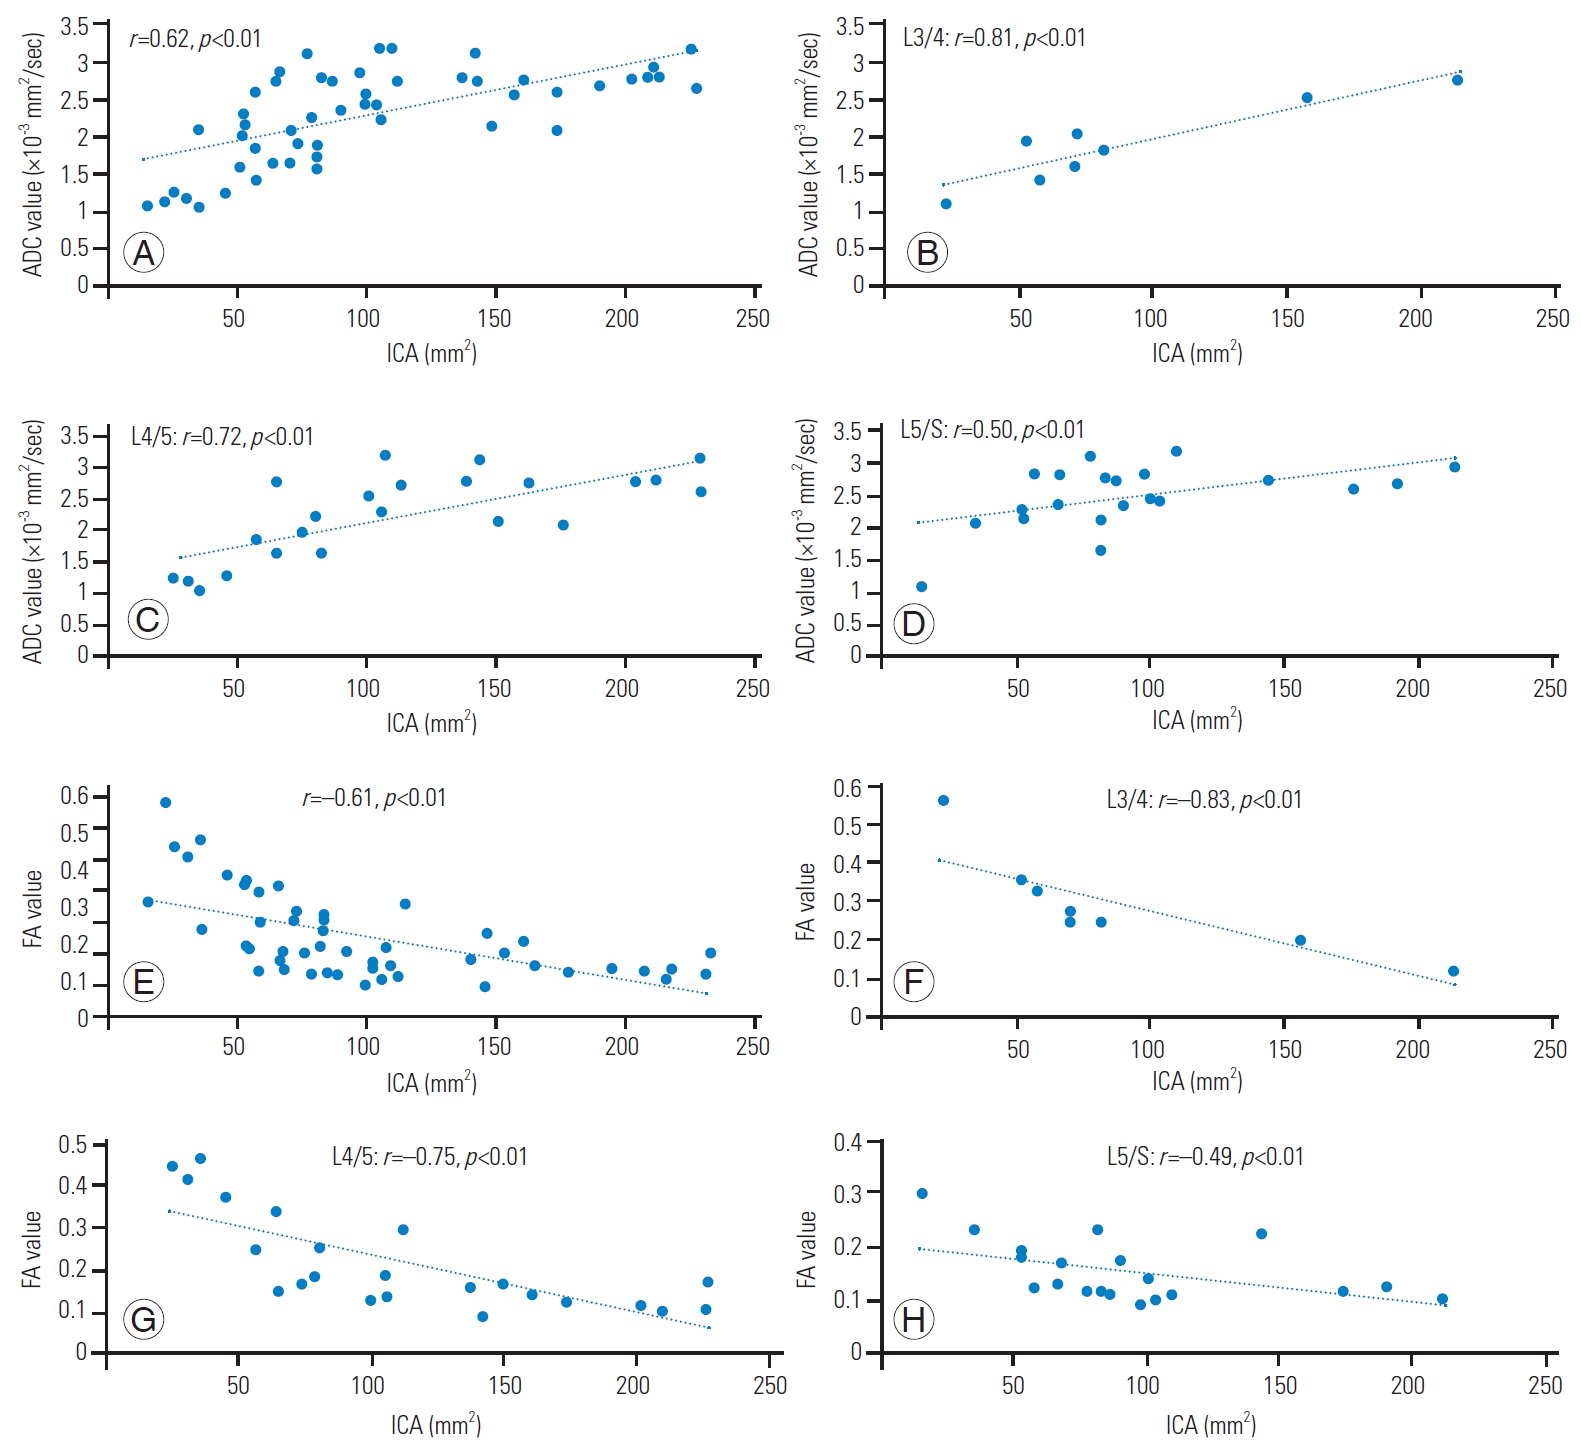
Comparisons between ADC and intraspinal canal area revealed a statistically significant positive correlation at all levels with an overall correlation coefficient of 0.62, where correlation coefficient was 0.81 at L3/4, 0.72 at L4/, and 0.50 at L5/S. The correlation at L5/S was relatively weaker at other levels (Fig. 6A).
The negative correlation between FA and intraspinal canal area was statistically significant at all levels with a correlation coefficient of -0.61. At L3/4, L4/5, and L5/S, its correlation coefficient was −0.83, −0.75, and −0.49, respectively. As for ADC, despite significant correlations at all levels, the association was slightly weaker at L5/S (Fig. 6B).
3. ADC and FA values, and clinical symptoms (LBP, IMC, and BBD) in LSS patients
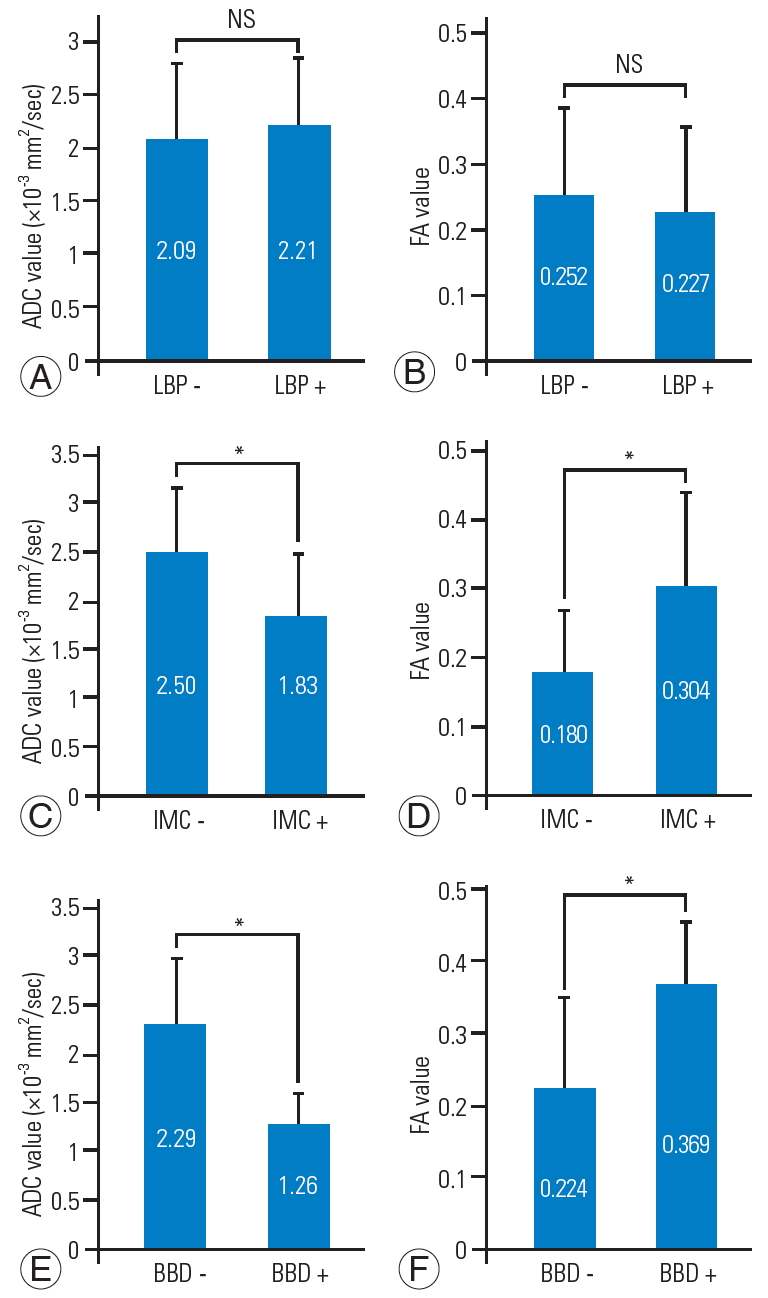
LLS patients with LBP had mean ADC value of 2.21±0.64×10⁻³ mm2/sec and FA value of 0.227±0.127. On the other side, LLS patients without LBP had mean ADC value of 2.09±0.73×10⁻³ mm2/sec and FA value of 0.252±0.133. However, there were no statistically significant differences in ADC or FA between LLS patients with or without LBP (Fig. 7A).
LLS patients with IMC had an ADC of 1.83±0.66×10⁻³ mm2/sec and FA of 0.304±0.137. Those patients without IMC had an ADC of 2.50±0.67×10⁻³ mm2/sec and FA of 0.180±0.088. Patients with IMC had a significantly lower ADC and significantly higher FA (Fig. 7B).
Patients with BBD had an ADC of 1.26±0.34×10⁻³ mm2/sec and FA of 0.369±0.085. Those without BBD had an ADC of 2.29±0.69×10⁻³ mm2/sec and FA of 0.223±0.125. LLS patients with BBD demonstrated significantly lower ADCs and significantly higher FA values (Fig. 7C).
Intra-individual reliability of observers for ADC values was r=0.98, and interindividual reliability was r=0.97. For the FA values, intra-individual reliability was r=0.98 while interindividual reliability was r=0.97.
Discussion
In this study, DTI parameters ADC and FA were investigated for the correlations of spinal canal morphology and clinical symptoms. Compared to healthy individuals, LSS patients have significantly lower ADC values and significantly higher FA values. According to the Schizas classification, A has the least stenosis, B has more, and C has the most stenosis. ADC decreased significantly from class A to B to C, while the FA value increased significantly in the same order. Intraspinal canal area showed a positive correlation with ADC values while it had a negative correlation with FA values. No correlation was noted to LBP, but patients with IMC and BBD had significantly lower ADC and significantly higher FA values. Intraspinal ADC and FA were correlated with the Schizas classification, intraspinal canal area, and clinical symptoms, indicating that intraspinal ADC and FA may be useful for the quantitative assessment of LSS.
Recent reports have shown that sedimentation signs are important prognosis indicators in spinal canal stenosis. In a large-scale prospective study called SPORT (Spine Patient Outcomes Research Trial), 66% of spinal canal stenosis cases showed a positive sedimentation sign wherein the positive sedimentation sign group was often resistant to conservative therapy and hence transitioning to surgery indication [22].
In conventional MRI, false positive findings may present in asymptomatic individuals, thus making it extremely difficult to predict postoperative prognosis or nerve damage. With regard to IMC, Hamanishi et al. [23] demonstrated that developmental narrowing of the spinal canal was found not only in the IMC group, but also in the radicular pain group. Regarding neuropathic bladder, Inui et al. [24] presented that there was no significant difference in the cross-sectional area of dural sac between the patients with positive and negative neuropathic bladder, and dural sac anteroposterior diameter might be an important predictive factor of neuropathic bladder. DTI is a noninvasive way to effectively trace the nerve fiber bundle and quantitatively evaluate the nerve injury. Recently, increasing attention has been directed to the application of DTI and tractography on the lumbar nerve root [15-20].
Generally, increased ADC may be caused by inflammation or edema, whereas decreased FA may reflect damaged tissue microstructure, demyelination, axonal loss, or increased isotropic water volume. This study showed that ADC values were significantly lower in LSS patients compared to healthy individuals, while FA values were significantly higher, these findings are in contrary to previous findings on peripheral nerve DTI parameters.
In normal physiological condition, CSF accounts for a large proportion of dura sacs. A high diffusion of water molecules causes higher ADC values, and since the water molecules show isotropic diffusion, FA is believed to decrease. In intervertebral discs with stenosis, CSF accounts for a smaller percentage, causing cauda equina density to increase while water molecules disperse along the nerve fibers. In other words, at the spinal canal stenotic sites, water molecule diffusion is restricted, thereby causing a decrease in ADC values with increased anisotropic dispersion, resulting in increased FA values. These results reflect the diffusion and anisotropy of CSF from the nerve per se. Although ADC and FA values did not correlate with LBP, these parameters correlate with severe disease such as IMC and BBD, and may serve to quantify the neurological symptoms associated with LSS. The average ADC value for patients presenting with BBD was 1.26×10⁻³ and the average FA value was 0.369. An ADC value of less than 1.26×10⁻³ mm2/sec and FA value of 0.369 or more at the responsible intervertebral level in LSS patients may be considered a standard for surgical indication.
Our study has several limitations. (1) Only a small number of subjects were investigated, hence confirmation of our findings requires a larger population. (2) No functional assessments of LBP such as Roland-Morris disability questionnaire or Oswestry disability index were performed. (3) The healthy individuals (mean age, 27 years) were significantly younger than the LSS patients (mean age, 58 years). (4) Patients were not evaluated postoperatively. (5) Regarding the clinical symptoms, there was a significant difference between FA and ADC values when divided by the presence or absence of IMC or BBD, but the correlation with the severity of clinical symptoms was not examined. Therefore, further investigations will be required.
Conclusions
Correlations between DTI parameters (ADC and FA values), morphological evaluation of the spinal column and clinical symptoms were determined in the LSS patients. Thus far, assessment of LSS has depended on morphology and there has been little literature on the quantitative evaluation methods. Our findings show that LSS patients have significantly lower ADC values and significantly higher FA values compared to healthy persons. When ADC and FA values were evaluated in association with Schizas class and the effects on intraspinal canal area were compared, ADC values showed a positive correlation, while FA values showed a negative correlation to the area. No correlation to clinical symptoms of LBP was apparent, while patients with IMC or BBD had significantly lower ADC and significantly higher FA values. Associations were identified between intraspinal ADC and FA values and Schizas classification, intraspinal canal area, and clinical symptoms, indicating that these ADC and FA may be useful to assess LSS quantitatively.