Is the Lipid Content of the Psoas Major Correlated with Chronic Low Back Pain and Spinopelvic Alignment? A Magnetic Resonance Spectroscopic Study
Article information
Abstract
Study Design
Cross-sectional observational study.
Purpose
This study aimed to analyze any potential associations of extramyocellular lipid (EMCL) and intramyocellular lipid (IMCL) contents with (1) the intensity of low back pain (LBP); (2) age, cross-sectional area (CSA), and fatty infiltration (FI) of the psoas major; and (3) spinopelvic parameters.
Overview of Literature
The psoas major has clinically relevant function; however, the association of this muscle with chronic LBP is controversial. Magnetic resonance spectroscopy enables a detailed analysis of the composition of muscular fat tissues such as its EMCL and IMCL contents.
Methods
The study population comprised 40 patients (19 males, 21 females; mean age, 61.7±2.4 years). Possible correlations of LBP Visual Analog Scale (VAS) scores, age, CSA, FI, and spinopelvic parameters with EMCL and IMCL contents of the psoas major were assessed.
Results
No association was identified between the EMCL and IMCL contents and LBP VAS scores (r=0.05, p=0.79 and r=0.06, p=0.75, respectively). The EMCL content correlated with age (r=0.47, p<0.01), body mass index (BMI) (r=0.44, p<0.01), CSA (r=−0.59, p<0.01), and FI (r=0.49, p<0.01). EMCL content showed a significant negative correlation with sacral slope (SS) (r=−0.43, p<0.05) and positive correlation with pelvic tilt (PT) (r=0.56, p<0.01).
Conclusions
EMCL content correlated with age, BMI, CSA, and FI of the psoas major, while IMCL content had no correlation. This study found correlations between SS and PT and EMCL content of the psoas major, but no correlations were found between spinopelvic parameters and IMCL content of the psoas major.
Introduction
Aging is associated with an increased risk of problems related to the locomotor system. Skeletal muscle mass and function reduce with aging, and the influence of paraspinal muscle degeneration on chronic low back pain (CLBP) and altered sagittal alignment has garnered attention in recent studies investigating the pathophysiology of CLBP [1,2]. Among the paraspinal muscles, the psoas major has been described to have clinically relevant function; however, its association with CLBP remains controversial [3-8].
Muscle degeneration associated with aging is characterized by muscle atrophy and fatty infiltration (FI), and these are evaluated using ultrasonography [9], computed tomography [3], and magnetic resonance imaging (MRI) [10]. MRI is an important modality for assessing muscle fat degeneration. Recently, MRI with the multipoint Dixon technique and magnetic resonance spectroscopy (MRS) have been used for muscle evaluation in addition to morphological assessments [1,11]. MRS analysis of muscle physiology has enabled detailed analyses of muscular fat masses through the identification of intramyocellular lipids (IMCLs) and extramyocellular lipids (EMCLs); this method has enabled a detailed assessment of fatty degeneration [12,13]. EMCLs exist as subcutaneous and extracellular fat in cells between the muscle fibers [12,14,15]. In contrast, IMCLs are undetectable with conventional MRI because they appear as lipid droplets in skeletal muscle cells in close contact with skeletal mitochondria [13,16]. IMCLs are reportedly associated with aerobic metabolism [12,17].
This study aimed to analyze any potential associations of EMCL and IMCL contents with (1) the intensity of low back pain (LBP); (2) age, cross-sectional area (CSA), and FI of the psoas major; and (3) spinopelvic parameters.
Materials and Methods
The institutional review board of the Sapporo Medical University approved this study (IRB approval no., 262-1074). All the subjects were presented with written and verbal explanations of the study, and they provided their consent before participation. All participants received written and verbal explanations of the study, and they provided written informed consent before study initiation.
1. Participants
For this study, we recruited patients aged 41–79 years with nonspecific CLBP who presented with symptoms persisting for more than 3 months despite conservative treatment such as medication or therapeutic exercise. CLBP was defined as pain, stiffness, and discomfort in the lower back from the 12th rib down toward the lumbar or lumbosacral area, with unclear source of pain. The exclusion criteria were the presence of (1) a systemic inflammatory disease; (2) lower extremity symptoms; (3) prior spinal surgery; (4) neoplasm, infection, or acute trauma; (5) history of spinal fracture; (6) spinal deformities such as spondylolisthesis with or without obvious instability (defined as sagittal translation of >3 mm, segmental motion of >20°, or a posterior opening of >5° on flexion/extension radiographs) or scoliosis (>10°); (6) advanced disc degeneration (Pfirrmann grade V) [18]; and (8) diabetes, hypertriglyceridemia, or other metabolic/endocrine disorders. The Visual Analog Scale (VAS, 0–100) was used to measure the intensity of LBP. Patients with VAS scores >30 mm were selected. Body mass index (BMI) was calculated using self-reported body weight (kg) divided by the square of height (m2) as an indicator of obesity, which is associated with the total body fat.
2. Radiographic evaluation
We assessed full-length spine and pelvis radiographs taken with participants in a standing position as recommended in a previous report [19]. The following sagittal spinal radiological parameters (Fig. 1) were recorded in the sagittal plane of the spine radiographs: lumbar lordosis (LL), measured from the superior endplate of L1 to the superior endplate of S1; thoracic kyphosis (TK), measured from the superior endplate of T4 to the inferior endplate of T12; and sagittal vertical axis (SVA), measured as the horizontal offset from the posterior-superior corner of S1 to the center of the corpus of C7. Moreover, the following sagittal pelvic parameters were recorded in the sagittal plane of pelvic radiographs: sacral slope (SS), the angle between a horizontal reference line and the upper sacral endplate; pelvic tilt (PT), the angle between a vertical reference and a line passing through the midpoint of the sacral plate to the femoral head axis; and pelvic incidence (PI), the angle between a line perpendicular to the upper S1 endplate at its midpoint and a line connecting this point to the femoral head axis. Intra- and interobserver reliability values for the measurement of spinopelvic parameters were assessed using the measurements of the two investigators (I.O. and H.T.). Intra- and interobserver reliability values for the measurement of spinopelvic parameters were also assessed, yielding similar results (Pearson’s correlation coefficient: 0.84–0.89, 0.87–0.92).

Measurement of the sagittal spinal radiologic and pelvic parameters. (A) Lumbar lordosis was measured from the superior endplate of L1 to the superior endplate of S1, and thoracic kyphosis was measured from the superior endplate of T4 to the inferior endplate of T12. (B) Sagittal vertical axis was evaluated as the horizontal offset from the posterosuperior corner of S1 to the center of the corpus of C7. (C) Sacral slope was measured as the angle between a horizontal reference line and the upper sacral endplate. (D) Pelvic tilt was calculated as the angle between a vertical reference and a line through the midpoint of the sacral plate to the femoral head axis. (E) Pelvic incidence was the angle made between a line perpendicular to the upper S1 endplate at its midpoint and the line connecting this point to the femoral head axis.
3. Magnetic resonance imaging protocol
This study followed a previously described MRI protocol [20-24]. Briefly, T2-weighted sagittal and transverse magnetic resonance (MR) images were obtained using the Signa HDx 1.5 T MRI system (GE Healthcare, Milwaukee, WI, USA) with a spine coil. Using these images, the proton MRS volume of interest (VOI) was placed at the center of the right psoas major at the L4/5 level (Fig. 2). A single-voxel point-resolved spectroscopy pulse sequence was acquired with the following parameters: repetition time, 2,000 ms; echo time, 35 ms; average number of signals, 64; VOI size, 15×15×15 mm (3.4 mL); and acquisition time 164 seconds.
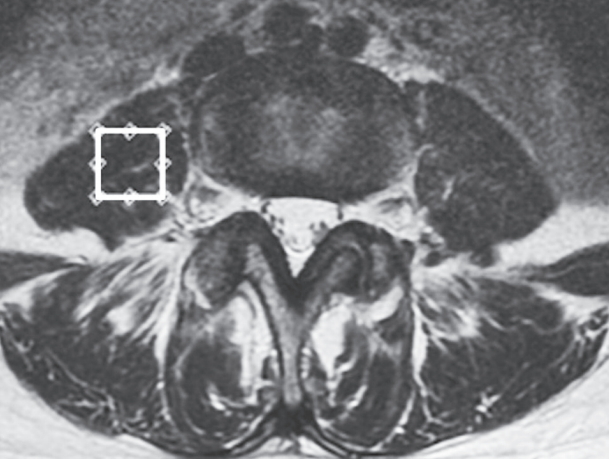
Diagram illustrating the positioning of the volume of interest on magnetic resonance images. The volume of interest was positioned at the center of the right psoas major at the L4/5 level.
4. Measurement of cross-sectional area and fatty infiltration
CSA and FI of the right psoas major were measured using axial T2-weighted MR images at L4/5 (the same level and side as for MRS). CSA was determined by manually tracing the fascial boarder of the muscle (Fig. 3A) as previously described [15]. The regions of interest were analyzed based on areas and histograms of signal intensity using a digital image processing software (ImageJ; National Institutes of Health, Bethesda, MD, USA). The FI percentage was measured using a pseudo-coloring method, in which bright pixels presenting fat tissue were colored red using software tools. Subsequently, the percentage of red pixels in the muscle compartment was calculated (Fig. 3B). Then, the relative CSA (mm2/m2) was calculated as the absolute CSA (mm2) divided by the square of the patient’s height (m2) to eliminate any influences of body constitution and gender on these measured anatomical variables. Intra- and inter-reliability values for the measurement of CSA and FI were 0.93 and 0.91, respectively.

Representative axial T2-weighted magnetic resonance images illustrating the measurement of cross-sectional area and fat infiltration of the right psoas major at the L4/5 level. (A) The cross-sectional area of the psoas major was measured using transverse T2-weighted images. (B) The fatty infiltration of the psoas major was measured using transverse T2-weighted images using digital image processing software.
5. Analysis of magnetic resonance spectroscopy data
MRS data were analyzed according to a previously described method [20-24]. Spectral data were used to measure EMCL and IMCL contents using the LCModel software (Stephen Provencher Inc., Oakville, ON, Canada). Data were transferred from the scanners to a Linux workstation, and metabolites were quantified using eddy current correction and water scaling. Data for EMCL (1.5 ppm) and IMCL (1.3 ppm) methylene protons were used for statistical analyses. Assessments of EMCL and IMCL contents were scaled to an unsuppressed water peak (4.7 ppm) using the automatic function of the software and were expressed in institutional units. These data are displayed graphically, with the chemical shift on the x-axis and peak intensity on the y-axis, to enable metabolic identification (Fig. 4). Participants with psoas major EMCL or IMCL content >15% above the standard deviation were excluded from the LCModel analysis.
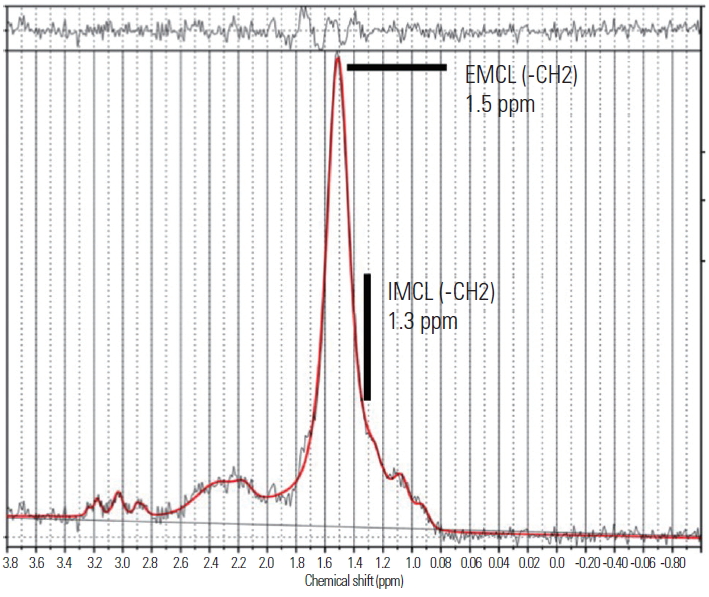
Analysis of proton magnetic resonance spectra of the psoas major using LCModel software (Stephen Provencher Inc., Oakville, ON, Canada). The following metabolites were identified: extramyocellular lipid (–CH2) methylene protons at 1.5 ppm and intramyocellular lipid (–CH2) methylene protons at 1.3 ppm. EMCL, extramyocellular lipid; IMCL, intramyocellular lipids.
6. Statistical analysis
We assessed the possible correlations of LBP VAS scores, age, CSA, and FI with the EMCL and IMCL contents of the psoas major using Pearson’s correlation coefficient test according to gender. Mann-Whitney U-test was used to analyze gender differences. The associations of EMCL and IMCL contents with spinopelvic parameters were also analyzed using Pearson’s correlation coefficient test according to gender. Significance was set at p<0.05. All numerical data are expressed as means±standard error of the mean.
Results
A total of 40 patients (19 males, 21 females; mean age, 61.7±2.4 years; range, 41–79 years) met the diagnostic criteria. The mean BMI was 23.8±0.7 kg/m2, and the mean VAS score was 63.1±2.9 mm. In the analysis according to gender, male patients had a significantly larger CSA than female patients (males, 449.8±32.5 mm2/m2; females, 349.2±27.7 mm2/m2; p<0.01), and male patients had a significantly lower FI than female patients (males, 8.4%±0.6%; females, 10.2%±0.8%; p<0.01).
The mean EMCL content of the psoas major was 2.29±0.36 (×103) mmol/L, and the mean IMCL content was 2.54±0.59 (×102) mmol/L. As shown Table 1, EMCL content was found to correlate with age (males, r=0.51, p<0.01; females, r=0.46, p<0.01), BMI (males, r=0.42, p<0.01; females, r=0.48, p<0.01), CSA (males, r=−0.62, p<0.01; females, r=−0.56, p<0.01), and FI (males, r=0.51, p<0.01; females, r=0.49, p<0.01), whereas the EMCL content was not correlated with VAS score (males, r=0.08, p=0.71; females, r=−0.04, p=0.81). IMCL content was not correlated with age (males, r=−0.13, p=0.59; females, r=0.20, p=0.41), BMI (males, r=0.11, p=0.71; females, r=0.22, p=0.38), VAS score (males, r=0.02, p=0.97; females, r=0.06, p=0.75), CSA (males, r=0.12, p=0.69; females, r=0.02, p=0.94), and FI (males, r=0.13, p=0.66; females, r=0.17, p=0.59).

Pearson’s correlation coefficient of age, BMI, VAS, CSA, and FI with EMCL and IMCL content of the psoas major in males and females
The following results were obtained for the spinopelvic parameters: LL, 37.1°±3.2°; TK, 28.3°±1.7°; SVA, 40.1±5.5 mm; SS, 30.6°±1.5°; PT, 17.1°±1.3°; and PI, 47.7°±1.6° in male patients, and LL, 36.0°±2.9°; TK, 29.6°±2.0°; SVA, 42.2±6.4 mm; SS, 27.9°±1.0°; PT, 23.2°±1.6°; and PI, 51.1°±1.8° in female patients (Table 2). LL, TK, and SVA showed no significant gender difference. SS was significantly higher in male patients than in female patients, and PT and PI were significantly higher in female patients than in male patients.
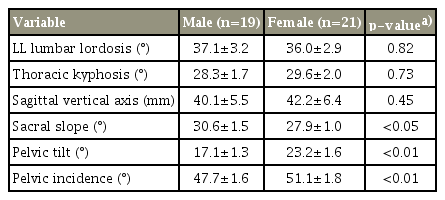
Comparisons of spino-pelvic parameters in males and females
EMCL content showed a significant negative correlation with SS (males, r=−0.45, p<0.05; females, r=−0.49, p<0.01) and a positive correlation with PT (males, r=0.57, p<0.01; females, r=0.61, p<0.01) (Table 3). No significant correlations were found between the EMCL content and LL (males: r=−0.06, p=0.71; females: r=0.08, p=0.67), TK (males: r=0.13, p=0.50; females: r=−0.11, p=0.57), SVA (males, r=0.05, p=0.88; females, r=−0.08, p=0.69), or PI (males, r=0.11, p=0.56; females, r=0.09, p=0.64). IMCL content showed no significant correlations with LL (males, r=−0.12, p=0.53; females, r=−0.14, p=0.48), TK (males, r=−0.14, p=0.49; females, r=0.17, p=0.39), SVA (males, r=−0.13, p=0.45; females, r=−0.16, p=0.41), SS (males, r=0.17, p=0.33; females, r=0.22, p=0.31), PT (males, r=0.19, p=0.35; females, r=0.15, p=0.44), and PI (males, r=0.04, p=0.81; females, r=0.03, p=0.87).

Pearson’s correlation coefficient of spinopelvic parameters with EMCL and IMCL content of the psoas major in males and females
Intra- and inter-reliability values for the measurement of spinopelvic parameters indicated similar results (Pearson’s correlation coefficient: 0.84–0.89 and 0.87–0.92, respectively). The intra- and inter-reliability values for the measurement of CSA and FI were 0.93 and 0.91, respectively.
Discussion
Several studies have reported on the MRI evaluation of the effects of aging on paraspinal muscle degeneration [25-27]. To the best of our knowledge, this is the first investigation to present MRS analysis of the psoas major and provide a detailed analysis of muscular fat mass by recording the presence and proportional content of EMCL and IMCL [12]. However, we could not identify a correlation between EMCL and IMCL contents of the psoas major and the intensity of CLBP. This suggests that the degeneration of the psoas major is not associated with CLBP. Future longitudinal studies using MRS and including more participants are warranted to analyze the relationship of psoas major parameters and CLBP.
Some studies have examined age-related changes with respect to the degeneration of the psoas major and reported various findings [8,26-28]. Lee et al. [28] reported that FI in the psoas major was smaller than that in other paraspinal muscles such as the multifidus muscle and erector spinae, suggesting that the psoas major is not affected by age-dependent degeneration. In contrast, Hiyama et al. [27] reported that the CSA of the psoas major at the L4/5 level is weakly correlated with age. In the present study, we showed that EMCL content may be a useful parameter for evaluating the age-dependent degeneration of the psoas major. The EMCL content could therefore represent a quantitative index for age-dependent degeneration of the psoas major.
Our analysis of the spinopelvic parameters and the EMCL and IMCL contents of the psoas major in patients with CLBP aimed to address the present lack of knowledge regarding the relationship between sagittal alignment and degeneration of the psoas major. We found that SS and PT correlated with the EMCL content of the psoas major but found no correlations between the spinopelvic parameters and the IMCL content of this muscle. This suggests that the degeneration of the psoas major might be influenced by anterior and posterior PT, which prompts us to question whether the increased EMCL content of the psoas major is the cause or the result of posterior PT. EMCLs are thought to be metabolically inactive lipid deposits related to reduced functionality such as a sedentary lifestyle and lack of exercise [12,14,15]; in other words, EMCLs are formed in inactive contractile muscles, which resulted from contractile muscles. From these observations, we speculated that the EMCL content increases with increased posterior PT, but a longitudinal analysis is needed to clarify the casual relationship.
This study has several limitations that should be acknowledged. First, we positioned the VOI to measure the EMCL and IMCL content at the L4/5 level only. Second, this was a cross-sectional study, although a longitudinal study design would have been a better choice.
Conclusions
In this cross-sectional study, we evaluated the EMCL and IMCL content of the psoas major using MRS in patients with CLBP and analyzed the potential associations of the EMCL and IMCL contents with the intensity of LBP, age, CSA, FI, and spinopelvic parameters. We found that the EMCL content correlated with age, BMI, and CSA and FI of the psoas major, whereas the IMCL content exhibits no such correlation. Furthermore, we identified correlations of the EMCL content with SS and PT of the psoas major, whereas no correlations were identified between the spinopelvic parameters and the IMCL content of this muscle.
Notes
No potential conflict of interest relevant to this article was reported.
Author Contributions
Izaya Ogon wrote and prepared the manuscript, and all of the authors participated in the study design. All authors have read, reviewed, and approved the article.
Acknowledgements
The project was funded by the Grant of Japan Orthopaedics and Traumatology Research Foundation, Inc. (No. 404).