Standardized Uptake Value from Semiquantitative Bone Single-Photon Emission Computed Tomography/Computed Tomography in Normal Thoracic and Lumbar Vertebrae of Breast Cancer Patients
Article information

Abstract
Study Design
Retrospective study.
Purpose
This study aims to semiquantitatively evaluate the standardized uptake value (SUV) of 99mTc-methylene diphosphonate (MDP) radionuclide tracer in the normal vertebrae of breast cancer patients using an integrated single-photon emission computed tomography (SPECT)/computed tomography (CT) scanner.
Overview of Literature
Molecular imaging techniques using gamma cameras and stand-alone SPECT have traditionally been utilized to evaluate metastatic bone diseases. However, these methods lack quantitative analysis capabilities, impeding accurate uptake characterization.
Methods
A total of 30 randomly selected female breast cancer patients were enrolled in this study. The SUV mean (SUVmean) and SUV maximum (SUVmax) values for 286 normal vertebrae at the thoracic and lumbar levels were calculated based on the patients’ body weight (BW), body surface area (BSA), and lean body mass (LBM). Additionally, 106 degenerative joint disease (DJD) lesions of the spine were also characterized, and both their BW SUVmean and SUVmax values were obtained. A receiver operating characteristic (ROC) curve analysis was then performed to determine the cutoff value of SUV for differentiating DJD from normal vertebrae.
Results
The mean±standard deviations for the SUVmean and SUVmax in the normal vertebrae displayed a relatively wide variability: 3.92±0.27 and 6.51±0.72 for BW, 1.05±0.07 and 1.75±0.17 for BSA, and 2.70±0.19 and 4.50±0.44 for LBM, respectively. Generally, the SUVmean had a lower coefficient of variation than the SUVmax. For DJD, the mean±standard deviation for the BW SUVmean and SUVmax was 5.26±3.24 and 7.50±4.34, respectively. Based on the ROC curve, no optimal cutoff value was found to differentiate DJD from normal vertebrae.
Conclusions
In this study, the SUV of 99mTc-MDP was successfully determined using SPECT/CT. This research provides an approach that could potentially aid in the clinical quantification of radionuclide uptake in normal vertebrae for the management of breast cancer patients.
Introduction
The skeleton has been identified as the most frequent site for tumors to metastasize to after the treatment of primary breast cancer [1,2]. A previous study has stated that 13.6% of patients diagnosed with stages I–III breast cancer will have skeletal or bone metastases at 15-year follow-up [3]. The ribs, spine, pelvis, and upper bones of the arms and legs are among the most common sites for secondary bone metastases from primary breast cancer.
In addition to initial investigation methods such as blood cell count tests, bone scans (i.e., bone scintigraphy) can also be conducted for accurate early detection of bone metastases. A bone scan is a type of nuclear medicine-based imaging that provides an entire skeletal visualization based on the activity of a radionuclide tracer within a short amount of time. Two of the most widely used bone scan instruments are gamma cameras and single-photon emission computed tomography (SPECT), both of which are used with 99mTc-methylene diphosphonate (MDP) tracer [4]. Conventionally, the interpretation of bone scan images has been based on a qualitative approach alone, whereby the images produced are evaluated using relative intensity values rather than absolute tracer concentration values [5]. However, the development of advanced imaging modalities, specifically the integrated SPECT/computed tomography (SPECT/CT) method, has been reported to help users obtain more information on skeletal tracer distribution due to the complementary anatomical mapping provided by the additional CT unit [6]. Moreover, the improved computing power of the SPECT/CT method has allowed for the implementation of more sophisticated image reconstruction algorithms (i.e., attenuation and scatter correction), thus enabling quantitative analysis via standardized uptake values (SUVs) to be performed [5,7].
In recent years, the introduction of SUVs into the SPECT/CT method has offered a more accessible tool for diagnostic purposes in comparison with the expensive and less available positron emission tomography (PET) method. In general, an SUV is a semiquantitative biomarker that assesses the tissue concentration of a radionuclide tracer measured by the scanner and divides it by the activity injected divided by body size [8,9]. Due to the development of the quantitative SPECT/CT technique, clinicians are now expected to be able to better differentiate metastasis and degenerative changes from the expected physiology and incidental uptake [10,11]. This could also prevent patient mismanagement [12,13]. However, regardless of the protocol published on quantitative SPECT/CT (with the earliest protocol validated on humans having been released almost 10 years ago [14]), its clinical application until now has been slow and not widely implemented [11].
Furthermore, few researchers have studied the measurement of SUV in SPECT/CT bone scans with 99mTc tracers thus far [4-6,8,13]. Therefore, the chief purpose of this study is to report the SUV measured for the normal vertebrae of breast cancer patients undergoing 99mTc-MDP bone scans via a SPECT/CT machine. Additionally, we also investigate the possible cutoff SUV that could be utilized to differentiate degenerative joint disease (DJD) of the spine, which constitutes benign changes, from normal vertebrae.
Materials and Methods
1. Patient selection
Patient data from a single center were retrospectively analyzed. Ethical approval, including a written informed consent waiver, was given by the institution’s Human Research Ethics Committee (USM/JEPeM/18110694) following the standards of the Declaration of Helsinki. A total of 30 female patients (mean age, 52.6±9.7 years; age range, 30–70 years) positively diagnosed with breast cancer who had undergone a 99mTc-MDP bone scan via SPECT/CT from January 2018 to December 2018 were randomly selected based on the following inclusion criteria: (1) a SPECT/CT procedure for the thoracic spine (T1–T12) and lumbar spine levels (L1–L5) was conducted 3 hours after intravenous 99mTc-MDP administration; (2) data available on the patient’s weight and height; (3) and data available on the injection activity and times of measurement and injection.
2. 99mTc-MDP bone scans with SPECT/CT
The bone scans were performed using a SPECT/CT system (Discovery NM/CT 670 Pro; GE Healthcare, Chicago, IL, USA) equipped with a low-energy high-resolution (LEHR) collimator 3 hours after an intravenous injection of 736.3±22.2 MBq (19.9±0.6 mCi) 99mTc-MDP, corresponding to 12.21±1.85 MBq (0.33±0.05 mCi/kg). A planar scan over the anterior and posterior regions of the whole body was first performed using the LEHR collimator at 256×256 pixels (Fig. 1). Next, a quantitative SPECT scan with the LEHR collimator was performed at a matrix of 128×128 pixels, a step-and-shoot mode for 15 seconds per frame, and 360 rotations for every 6° view angle for the two detectors. Low-dose CT scan images were then acquired using adaptive dose modulation with 5-mm slice thickness at 120 kVp and 20 mAs.
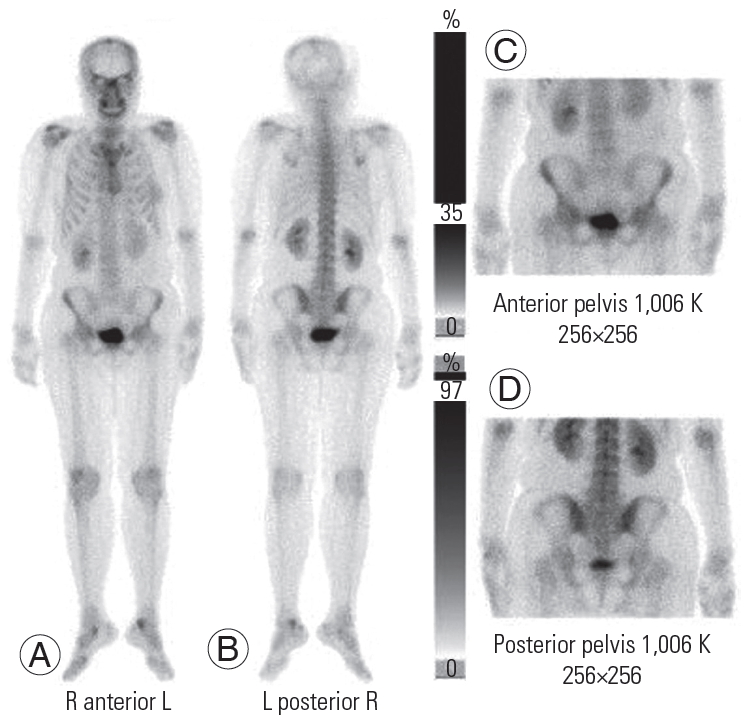
(A–D) Normal bone planar scintigraphy. R, right; L, left.
3. Semiquantitative assessment of normal vertebrae using the standardized uptake value
The following set of exclusion criteria was first outlined to determine the normal vertebrae (i.e., healthy bone): compression fractures, diffuse bone metastasis, ankylosing spondylitis, and metabolic bone disease. In addition, DJD of the spine was also characterized by correlating the tracer uptake with its CT morphology, which encompassed osteophytes, end plates, facet joints, and the area around the joints [15]. Both the normal vertebrae and DJD of the spine were independently classified by two nuclear medicine physicians. A consensus in a joint reading resolved any discordant interpretations. The delineation of the volume of interest (VOI) was made manually using the Q.Metrix software package (GE Healthcare). Any VOIs that covered the complete vertebrae were hand-drawn from the regions of interest of three two-dimensional slices (coronal, sagittal, trans-axial), as shown in Fig. 2. SPECT images were then reconstructed using an ordered subset expectation maximization (OSEM) with depth-dependent three-dimensional (axial and transaxial) resolution recovery, scatter correction using scatter window subtraction (triple-energy approach), and attenuation correction based on attenuation maps derived from the CT data filtered by hybrid quality control. The OSEM SPECT reconstruction used 10 subsets and two iterations without post-smoothing.
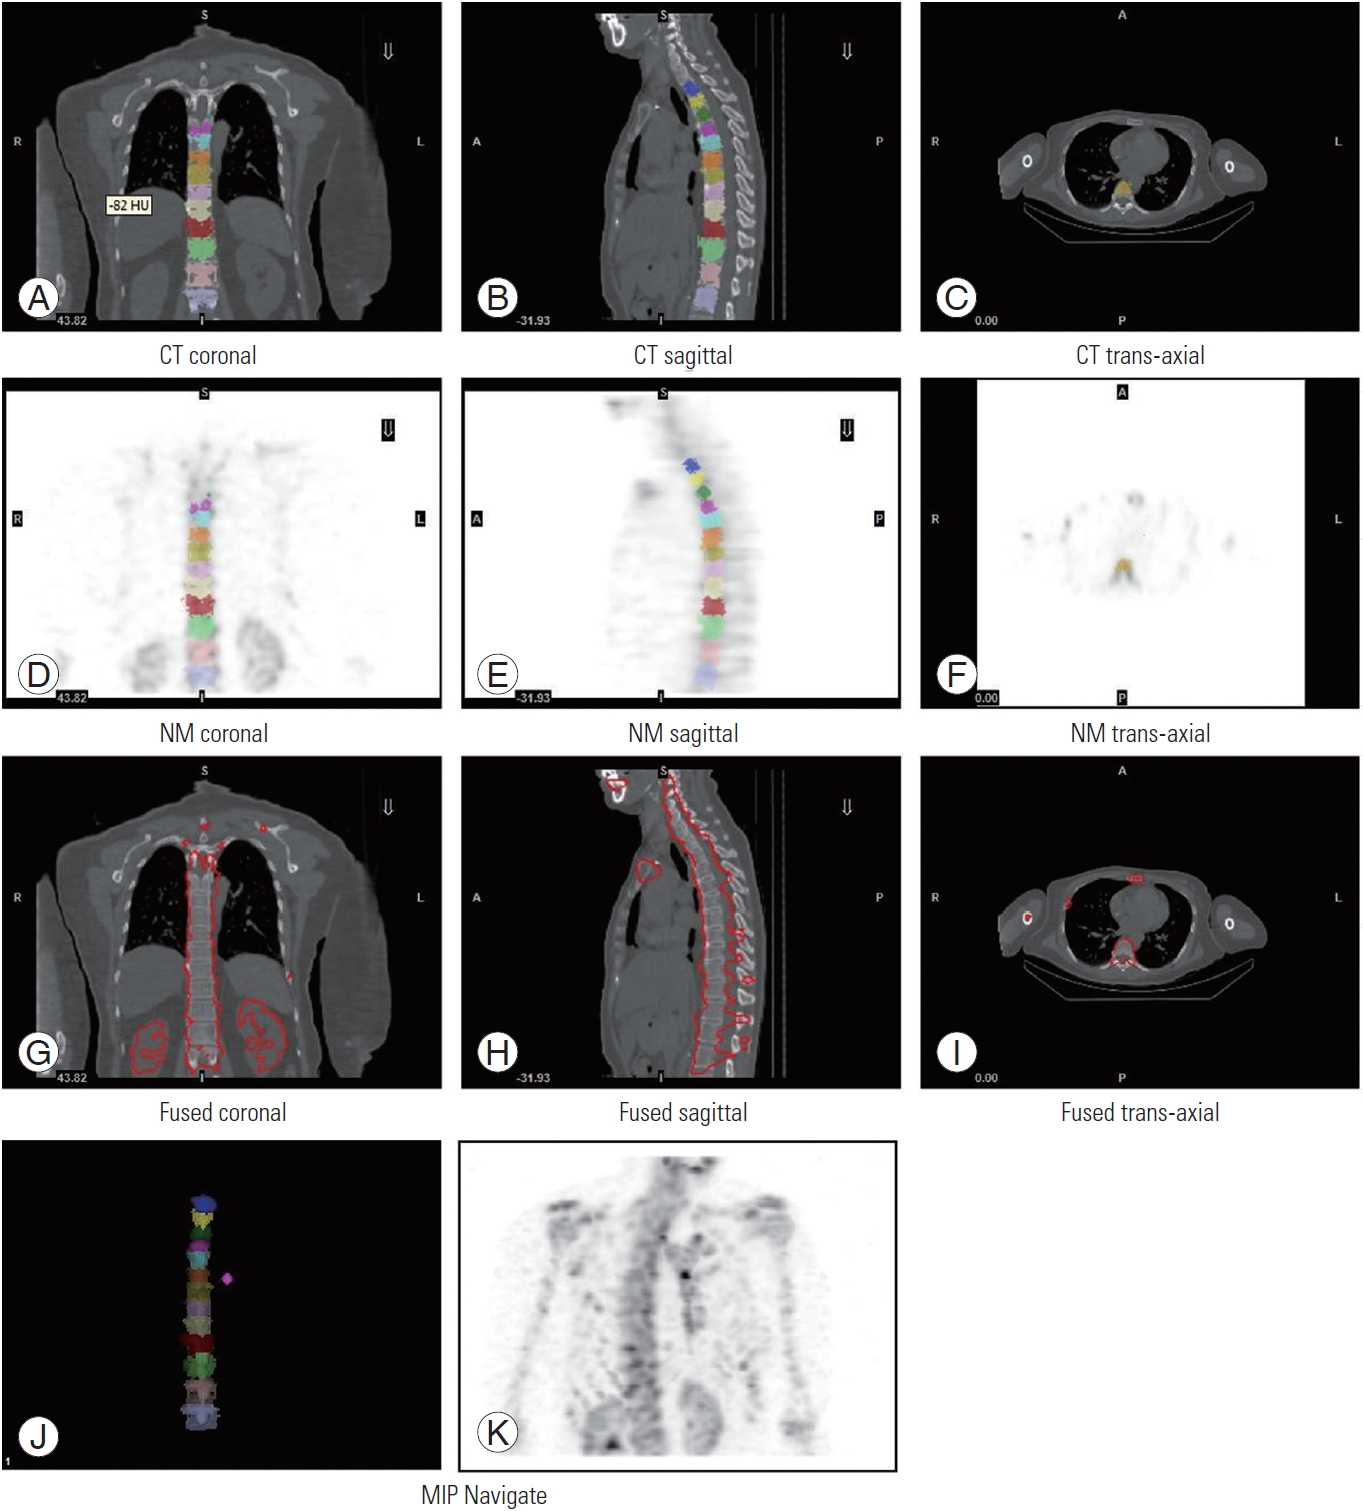
(A–K) Coronal, sagittal, and trans-axial images of patients’ single-photon emission CT/CT-fused datasets. The different colors depict the different selected volumes of interest. CT, computed tomography; R, right; L, left; A, anterior; P, posterior.
Information regarding camera sensitivity, patient data, activity injected, administration, and scan time was acquired and loaded into the Q.Metrix software before the SUV assessment. The calculated camera sensitivity was determined as 176.18 counts per minute per microcurie (cnt/min/μCi). The SUVs were expressed as the SUV mean (SUVmean) and SUV maximum (SUVmax). The SUVmean was the average multiple pixels within the VOI sampled, while the SUVmax was defined as the highest pixel value within the VOI with the highest activity concentration:
Note that the SUVs listed above accounted for body size or body weight (BW) measurements only. To reduce the dependence of the SUV on BW, the values for lean body mass (LBM) and body surface area (BSA) were also examined and calculated by replacing the BW parameter in both the SUVmax and SUVmean [9]. Both the LBM and BSA values were automatically generated by the corresponding vendor-provided software in conjunction with the aforementioned required information.
4. Statistical analyses
All statistical analyses were performed using the IBM SPSS ver. 24.0 software (IBM Corp., Armonk, NY, USA). The degrees of dispersion of the SUVmean and SUVmax for the non-rejected vertebrae (or the noise signal amount [16]) were evaluated using the coefficient of variation (CoV). The data were presented as the mean±standard deviation (SD) and analyzed using a normal distribution test. The relationship between the calculated SUVs with the patients’ age, weight, and height was evaluated using Spearman’s correlation analysis, whereby p-values of less than 0.05 indicated a significant difference. The OriginPro 2018 platform (OriginLab Corp., Northampton, MA, USA) was used to graph box and whisker plots (range as a function of vertebral levels). The bottom and top of the boxes represented the first (25%) and third (75%) quartiles, respectively; the minimum and maximum values of the data were at the ends of the whiskers. The median value was marked as a line in each box, while the mean was indicated by a black circle marker inside each box. The BW SUVmean and SUVmax in the treatment and notreatment groups were also compared using an independent t-test. For DJD, the BW SUVmean and SUVmax were obtained. Subsequently, the area under the curve (AUC) for both SUVs was determined from the receiver operating characteristic (ROC) curve.
Results
1. SUVmean and SUVmax based on BW, BSA, and LBM
Of the 30 patients included in this study, 18 (treatment group; 60%) were identified to have undergone either a single cancer treatment or combination of treatments (chemotherapy, radiotherapy, and hormonal therapy), while the remaining 12 (no-treatment group; 40%) had not received any cancer treatment prior to their bone scan procedure. From the SPECT/CT scans, 286 normal vertebrae from T1 to T12 and L1 to L5 were obtained. No vertebral levels were excluded in the statistical analyses, as the sampling number was deemed adequate (n≥10). This criterion was accomplished in the same manner as the statistical considerations by Kaneta et al. [8]. The mean±SD of the BW SUVmean and SUVmax was 3.92±0.72 and 6.51±0.72, respectively. Meanwhile, the BSA SUVmean and SUVmax values were 1.05±0.07, and 1.75±0.17, respectively, and the LBM SUVmean and SUVmax values were 2.70±0.19 and 4.50±0.44, rspectively. From these results, the calculated mean values for the BW SUVmean and SUVmax were found to be higher compared with those of the BSA and LBM.
The box and whisker plots of the SUVmean and SUVmax for BW, BSA, and LBM at each vertebral level are shown in Figs. 3–5. The CoV values of the SUVmean and SUVmax were 0.400 and 0.430 for BW, 0.390 and 0.414 for BSA, and 0.389 and 0.416 for LBM, respectively. The CoV values for each vertebral level are tabulated in Table 1. The highest CoV values of the SUVmean and SUVmax among all of the vertebral levels were observed at the T5 thoracic level with 0.595 and 0.599 for BW, 0.571 and 0.583 for BSA, and 0.571 and 0.591 for LBM, respectively. Meanwhile, the lowest CoV values of the SUVmean and SUVmax among all of the vertebral levels were found at the L4 lumbar level for BW (0.247, 0.339), L5 for BSA (0.221, 0.203), and L5 for LBM (0.221, 0.205).
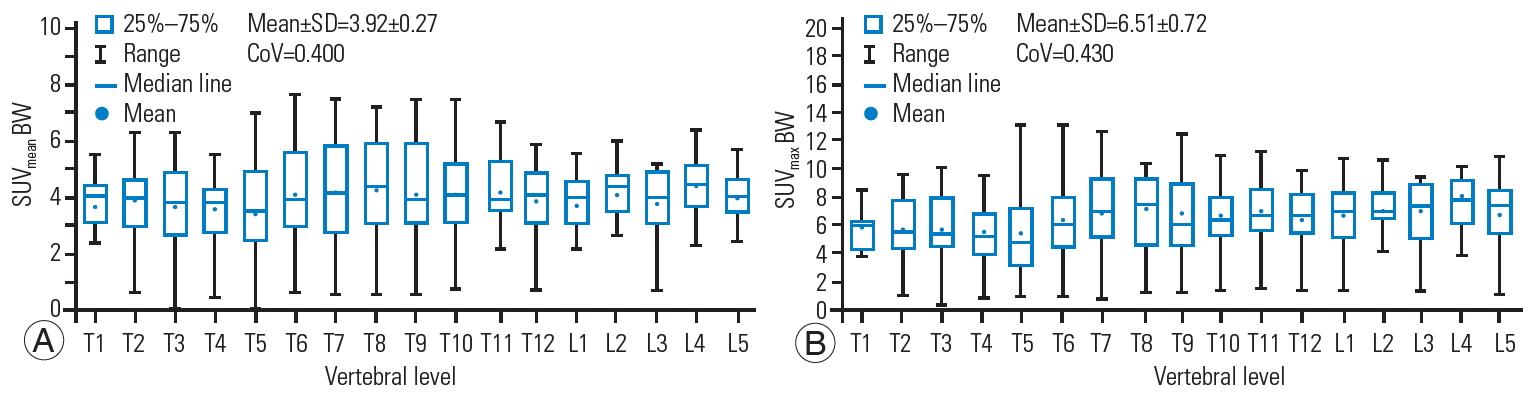
Box and whisker plot of the SUVmean (A) and SUVmax (B) for BW showing a quantitative distribution of standard statistics. SUV, standardized uptake value; BW, body weight; SD, standard deviatio; CoV, coefficient of variation.
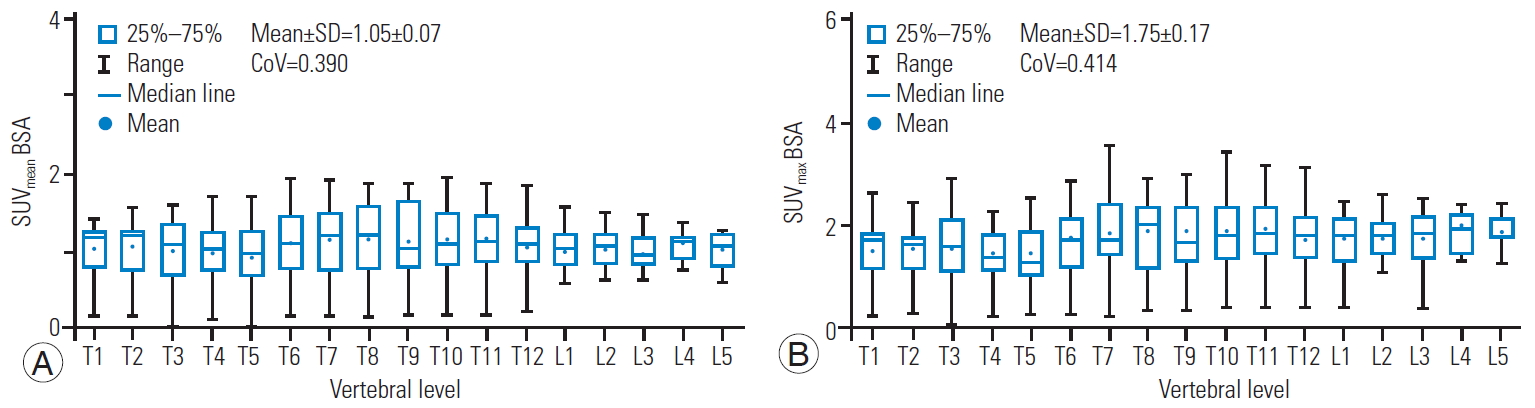
Box and whisker plot of SUVmean (A) and SUVmax (B) for BSA showing a quantitative distribution of standard statistics. SUV, standardized uptake value; BSA, body surface area; SD, standard deviation; CoV, coefficient of variation.
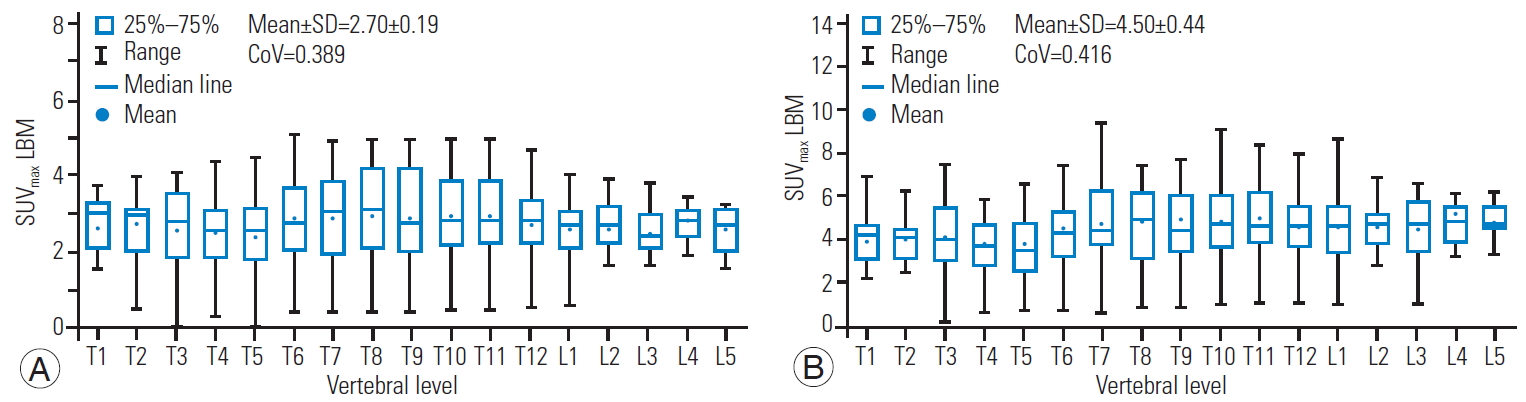
Box and whisker plot of the SUVmean (A) and SUVmax (B) for LBM showing a quantitative distribution of standard statistics. SUV, standardized uptake value; LBM, lean body mass; SD, standard deviatio; CoV, coefficient of variation.

CoV for normal vertebrae in breast cancer patients
The mean±SD of the BW SUVmean and SUVmax in the no-treatment group (120 vertebrae) was 3.23±1.61 and 5.37±2.81, respectively. Comparatively, an independent t-test showed a significantly higher mean±SD (p<0.05) in the treatment group (166 vertebrae) with values of 4.43±1.36 and 7.36±2.49 for the SUVmean and SUVmax, respectively.
2. Correlation coefficients between the SUVs and age, weight, and height
Table 2 displays the correlation coefficients between the SUVs and age, weight, and height. All SUVs were found to show a weak and no significant correlation with age. Meanwhile, there was a significant, moderate, and positive correlation between the BW SUVmax with weight and a negative correlation between the BW SUVmean with height. The other SUVs indicated a weak and no significant correlation between weight and height.
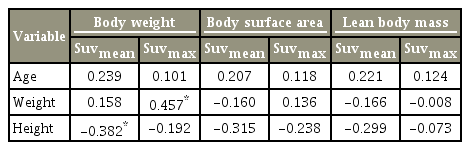
Correlation coefficients between SUVs and age, weight, height
3. Cutoff values of the SUVmean and SUVmax in differentiating DJD of the spine and normal vertebrae
A total of 106 DJD lesions of the spine were identified. The mean±SD of the BW SUVmean and SUVmax was 5.26±3.24 and 7.50±4.34, respectively. An ROC curve analysis was performed to determine the diagnostic accuracy of both SUVs in discerning DJD from normal vertebrae (Fig. 6). The AUC obtained was 0.569 (95% confidence interval [CI], 0.500–0.638) for the SUVmean and 0.511 (95% CI, 0.443–0.579) for the SUVmax. As the values were close to 0.5, neither SUV held a discriminatory capacity to differentiate DJD from normal vertebrae, resulting in no attainable optimal cutoff value.

Receiver operating characteristic curves to differentiate between degenerative joint disease and normal vertebrae using the SUVmean (black line) and SUVmax (red line). SUV, standardized uptake value; AUC, area under the curve; CI, confidence interval.
Discussion
Metastases of the bone are known to not show any discernible uptake patterns during scanning [17]. The same can be said for normal bone, as the SUVmean and SUVmax for each vertebral level are different and possess a considerably wide variability. A low CoV indicates a small value dispersion, while a high CoV suggests a large value dispersion. Based on the results obtained in this study, the SUVmean produced a lower CoV compared with the SUVmax in all three SUV variations (BW, BSA, LBM), although the differences were rather modest. The SUVmax is known as the standard SUV assessment method in quantitative molecular imaging (especially PET) because of its simplicity, reproducibility, resistance to partial-volume issues in tumors, and immunity to interobserver variability [9,13,18]. The SUVmax is commonly reported in the literature, which has led to the assumption that it is the best quantitative biomarker parameter. However, it has a high dependence on the statistical quality of the images produced and, hence, is susceptible to noise [19,20]. Since CoV values illustrate the noise level in acquired data, it could be asserted that SUVs with a lower CoV (in this case, the SUVmean) can be utilized as an optimal reference for normal bone. Recent paper of Arvola et al. [5] supports this observation, as they found higher variability in the SUVmax values compared with those of the SUVmean in both 99mTc-hydroxyethylene diphosphonate SPECT/CT and 18F sodium fluoride PET/CT scans. Therefore, despite contradicting earlier reports on the best SUV for normal bone SPECT/CT imaging [8], the SUVmean could also serve as an alternative in quantifying tracer uptake.
Most SUVs are measured based on BW, since this is the most popular method. In this study, the BW skeletal SUVmean and SUVmax were relatively low at 3.92±0.27 and 6.51±0.72, respectively. These values were regarded as commensurable to previously reported BW SUVs for normal vertebrae, e.g., 4.4±0.5, 4.6±1.7, and 5.9±1.5 for SUVmean, and 7.1±0.4 and 7.6±2.4 for SUVmax [8,10,21]. The SUVmean and SUVmax for BSA and LBM also showed considerably low SUVs, decreasing in the order of BW, LBM, and BSA. However, none of the corrected SUVs showed a lower or higher mean CoV than those of the BW (as indicated in Table 1). Since all three SUVs yielded an almost similar result, users should select the most appropriate SUV in bone SPECT/CT imaging. If the BW SUV is used to monitor the response of 99mTc in SPECT/CT scans, the BW should be measured with the same weighing scale at the facility rather than based on self-reported weight or patient charts [9]. The scale should also be routinely calibrated to ensure its accuracy and precision in determining patients’ BW and SUV.
In this study, based on the Spearman correlation test, it was demonstrated that all SUVs showed a weak and no significant correlation with age (p>0.05), similar to the results of Kaneta et al. [8]. However, Cachovan et al. [21] reported a significant negative correlation with age for all SUVs (BW and LBM) in healthy lumbar spines after 99mTc-diphosphonate-propanedicarboxylic acid SPECT/CT imaging (p<0.001). These variations in SUV correlation with age across many published results might be due to differences in the ages of the study populations, attenuation correction method, sample size, type of radionuclide tracer, and SPECT/CT reconstruction method. The results in this study demonstrated a significant, moderate, and positive correlation between the BW SUVmax with weight (p<0.05), somewhat similar to the results of Sugawara et al. [22], which found a positive correlation between BWbased blood SUV with weight upon using 2-[fluorine 18]fluoro-2-deoxy-D-glucose PET scans (p<0.001). This finding was likely due to the fat contribution to the BW SUV measurements [23]. Therefore, it has been suggested to use the LBM SUV to quantify the uptake of tracer in heavier or obese patients as a correction method [22].
A significant negative correlation between the BW SUVmean with height was also found in this study. Bone density composition, in general, is higher in taller subjects compared with smaller subjects. This increase of bone density has been suggested to be a result of the rise in physical burden due to the high center of gravity [8]. In a study by Axelsen et al. [24], it was concluded that chemotherapy in breast cancer patients results in a significant bone mineral densitometry (BMD) loss due to an increase in bone turnover, leading to osteoporosis. Furthermore, Huang et al. [25] also found that both the SUVmean and SUVmax in osteoporotic patients are significantly lower compared with those in non-osteoporotic patients. Nonetheless, due to the retrospective design of the study, no correlations between the SUVs measured via the BMD assessment were able to be drawn. A reduction in the SUV from osteoporotic subjects might be recorded and, thus, not be representative of normal vertebrae. As such, future prospective studies incorporating BMD measurements are recommended.
Breast cancer therapy can affect normal bone homeostasis by altering the osteoclast and osteoblast functions [26]. The mechanism of action of each treatment and its effect on bone may vary, which gives rise to variation of the SUVs. In this study, the BW SUVmean and SUVmax were significantly higher in the treatment group as compared with the no-treatment group. To the best of our knowledge, no study has assessed the SUVs of normal bone preand post-therapy; thus, further research is highly needed.
Degenerative changes of the spine, especially in the elderly, are common and often mistaken for bone metastases during bone scans. Therefore, SUV acquisition could potentially be a useful parameter to differentiate bone lesions and normal vertebrae. In a recently published paper by Mohd Rohani et al. [27] involving 34 prostate cancer patients utilizing SPECT/CT, a cutoff SUVmax value of 20 was suggested to distinguish between DJD and bone metastases of the spine. However, no cutoff SUV was proposed by the authors to discriminate DJD from normal vertebrae. The results from the current study suggested that no optimal cutoff point could be identified to differentiate DJD from normal vertebrae in both the SUVmean and SUVmax. This finding is consistent with an earlier finding by He et al. [28] stating that there are no statistical differences between degenerative changes and normal bone in the cervical and thoracic vertebral regions.
The implementation of quantitative SPECT/CT is deemed to be more challenging compared with PET imaging due to the former’s many technical limitations. Regarding bone SPECT/CT scans, quantitative uncertainties may appear because of tracer-drug interactions (e.g., with iron supplements), metal-induced artifacts from prostheses affecting the computed SUV, variations in hormone levels such as estrogen, and unknown rates of uptake and clearance from the blood [11]. Other variables such as different radionuclide tracers with different photon energies, different collimators, and the use of different energy windows should also be considered when comparing results. The primary limitations of the current study are the small number of enrolled patients and the retrospective design, which hampered the sensitivity and specificity of the data. Moreover, SUV estimations from a completely healthy population without breast cancer were not included. Therefore, future prospective validation studies in a larger cohort are warranted to better define the SUVs of normal vertebrae.
Conclusions
In sum, SUVs can be used as a parameter to quantify tracer uptake in normal vertebrae SPECT/CT studies in breast cancer patients. In this research, the SUVmean and SUVmax values calculated based on the patients’ BW, BSA, and LBM for normal vertebrae showed a wide variability, though they were comparable to other published results. More effort needs to be put into the clinical interpretation of SUVs to understand the quantitative nature of tracer uptake before it can be used routinely in the clinical setting.
Notes
No potential conflict of interest relevant to this article was reported.
Author Contributions
Conception and design: NMN, MFMR; data acquisition: YBU, SNBMY, MFMR, NT; analysis of data and drafting of manuscript: MFMR, SNBMY, NT; revision: NMN, WMNMZ; and supervision: NMN, WMNWZ
Acknowledgements
This study was funded by the short-term research grant of Universiti Sains Malaysia (304/PPSP/6315121). The study was approved by the Human Research Ethics Committee USM (HREC), Universiti Sains Malaysia (reference: USM/JEPeM/18110694).