Evaluating Spinal Canal Lesions Using Apparent Diffusion Coefficient Maps with Diffusion-Weighted Imaging
Article information
Abstract
Study Design
Observational study.
Purpose
To evaluate healthy volunteers and patients with spinal canal lesions using apparent diffusion coefficient (ADC) maps with diffusion-weighted imaging.
Overview of Literature
Decompression surgery for lumbar spinal stenosis (LSS) is selected on the basis of subjective assessment and cross-sectional magnetic resonance imaging (MRI). However, there is no objective standard for this procedure.
Methods
We performed 3T MRI in 10 healthy volunteers and 13 patients with LSS. The ADC values in the spinal canal were evaluated at 46 vertebrae (L4/5 and L5/S1 for each participant), and the reduced and conventional fields of view were compared.
Results
The ADC values were 2.72±0.12 at L4/5 in healthy volunteers, 2.76±0.19 at L5/S1 in healthy volunteers, 1.77±0.58 at L4/5 in patients with LSS, and 2.35±0.29 at L5/S1 in patients with LSS. The ADC value at L4/5 in patients with LSS was significantly lower than that at L5/S1 in patients with LSS and that at L4/5 and L5/S1 in healthy volunteers (p <0.05). With an ADC cutoff value of 2.46 to identify LSS, this approach provided an area under the curve of 0.81, sensitivity of 0.92, and specificity of 0.76 (p <0.05).
Conclusions
Preoperative examination using ADC maps permits visualization and quantification of spinal canal lesions, thus proving the utility of ADC maps in the selection of decompression surgery for LSS.
Introduction
Diffusion-weighted imaging (DWI) uses magnetic resonance imaging (MRI) data to provide information regarding tissue microstructures by monitoring the random movement of water molecules and applying a motion probing gradient in some directions [1-4]. DWI is essential for the diagnosis of acute phase cerebrovascular infarction [5] and is widely used in clinical practice [6,7]. DWI considerably affects the directionality of water molecule dispersion. In this context, axonal cell membranes and myelinated sheaths in nerve fibers prevent dispersion in the direction aligned with the fiber bundle, resulting in the loss of water molecule isotropy. This effect is referred to as anisotropy. Furthermore, diffusion tensor imaging (DTI) and tractography are examples of selective recording of these data. Fractional anisotropy, which is expressed in values from 0 to 1, is a parameter of anisotropic strength. Values close to 1 indicate relatively strong anisotropy, whereas a value of 0 indicates complete isotropy. Apparent diffusion coefficient (ADC) values are used to indicate the magnitude of diffusion.
A new reduced field of view (rFOV) single-shot diffusion-weighted echoplanar imaging method uses a twodimensional, spatially selective echoplanar radiofrequency excitation pulse and a 180° refocusing pulse, reducing the field of view (FOV) in the phase-encode direction while simultaneously suppressing the fat signal. The rFOV method reduces the required readout duration and facilitates the acquisition of high-resolution diffusion-weighted images, which enable its practical use for spinal imaging [8]. However, no studies have evaluated spinal canal lesions in the peripheral nerve area, especially in cases of lumbar spinal stenosis (LSS). It is difficult to identify the affected vertebrae in LSS, and a definitive diagnostic technique is required. This study aimed to visualize and quantify spinal canal lesions using ADC maps with DWI. Additionally, we present the ADC maps of a patient with LSS to provide evidence for the clinical advantages of using ADC maps.
Materials and Methods
1. Participants
This study included 10 healthy volunteers (average age, 37.4 years; three women) and 13 patients with LSS (average age, 65.1 years; six women). We defined LSS as a condition in which the lumbar spinal canal was narrowed because of anatomical changes, irrespective of imaging findings. Symptoms resulting from the compression of the cauda equina and nerve roots included bilateral root pain in the lower limbs, sensory impairment, muscle weakness, and intermittent claudication. The clinical symptoms and imaging findings of the 13 enrolled patients with LSS were consistent. Informed consent was obtained from all participants included in the study before enrollment. All procedures in this study were performed in accordance with the ethical standards of the institutional and/or national research committee and the 1964 Helsinki declaration and its later amendments or comparable ethical standards. Participants underwent MRI for the evaluation of 46 vertebrae (L4/5 and L5/S1 for each participant), which were examined using a conventional FOV, and the spinal canal ADC values were measured in the rFOV. The spinal canal, nerve root, and cauda equina were clearly visualized on the ADC maps using the rFOV (Fig. 1). The rFOV technique is based on our previous study, and compared with traditional methods, this technique improves visualization and the accuracy of quantification [9].
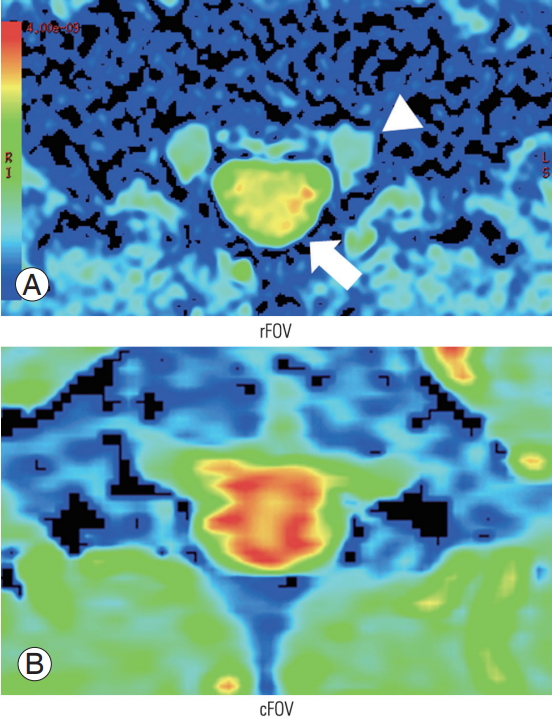
ADC map at L4/5 in a healthy volunteer based on (A) rFOV and (B) cFOV. Red indicates high intensity and blue indicates low intensity. The ADC map resolution is higher with the rFOV, which facilitates clearer imaging of the nerve root (white arrow head), spinal canal (white arrow), and cauda equina. ADC, apparent diffusion coefficient; rFOV, reduced field of view; cFOV, conventional field of view.
Fig. 2 shows the study flow chart. The patients were classified according to the Schizas classification (grade A versus grade B–D) based on the axial view of T2WI-MRI [10]. Based on these results, the participants were divided into the following groups: normal L4/5 vertebrae in healthy volunteers (n=10), normal L5/S1 vertebrae in healthy volunteers (n=10), affected L4/5 vertebrae in patients with LSS (n=13), and affected L5/S1 vertebrae in patients with LSS (n=13).
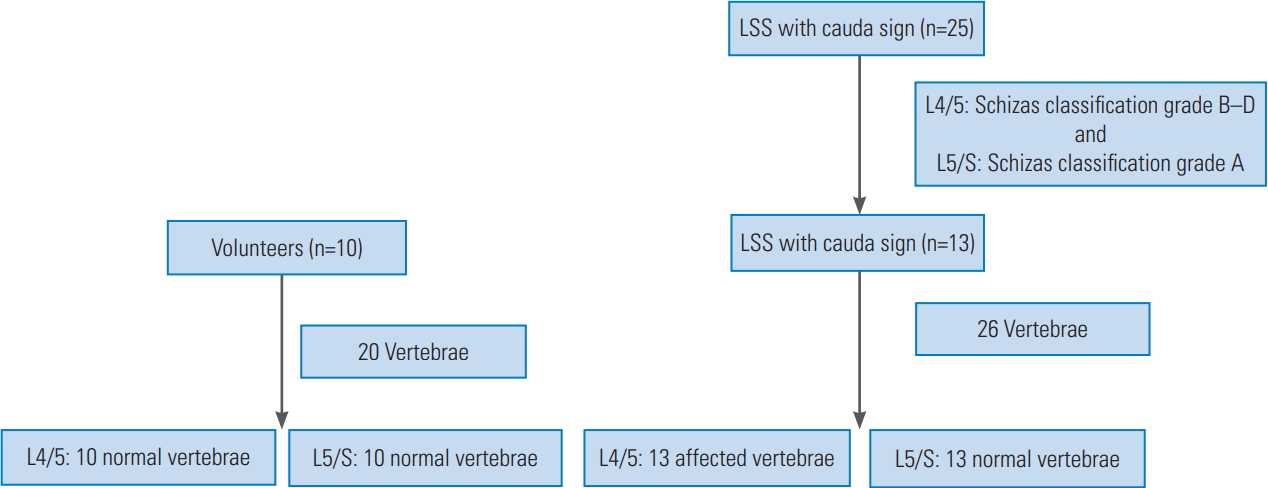
Study flow chart. Among the 25 patients with LSS and cauda symptoms, stenosis at L4/5 is categorized as Schizas grade B–D (based on T2- weighted magnetic resonance imaging), and stenosis at all other single vertebrae was categorized as Schizas grade A. The 46 vertebrae are divided into four groups: normal L4/5 vertebrae in healthy volunteers, normal L5/S1 vertebrae in healthy volunteers, affected L4/5 vertebrae in patients with LSS, and affected L5/S1 vertebrae in patients with LSS. LSS, lumbar spinal stenosis.
2. Technique
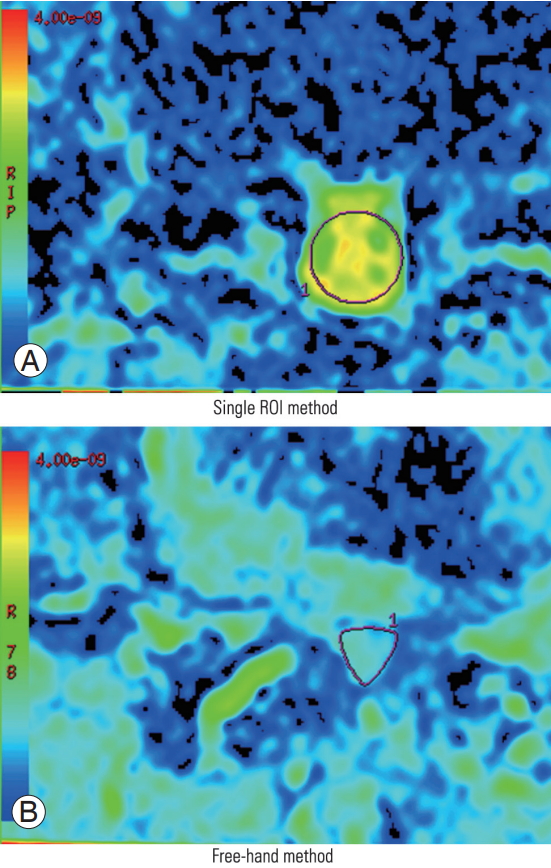
The region of interest (ROI) was placed on the spinal canal on the ADC map, and the corresponding ADC values were measured twice. The measurements were performed using the same methods by two orthopedic spine surgeons (H.K. and N.M.) with adequate experience with DTI. In case of difficulty in placing a single ROI on the spinal canal, such as in cases involving Schizas grade D LSS, a free-hand method was used. Free-hand ROIs were drawn by tracing the border of the spinal canal. No significant differences in the ADC values between these two methods were observed (Fig. 3). Furthermore, intraobserver reliability (H.K.) and interobserver reliability (H.K. versus N.M.) were investigated.
3. Image analysis
Based on these results, a receiver operating characteristic curve was generated to identify the optimal ADC cutoff value for determining the affected vertebrae. Functool software (GE Healthcare UK Ltd., Little Chalfont, UK) was used to perform the DTI analysis with the rFOV. Student t-test was used to analyze differences between the four participant groups, and Spearman correlation coefficient was used with the rank test to analyze the intraobserver and interobserver reliabilities. Differences were considered statistically significant at a p-value of <0.05.
4. Conventional magnetic resonance imaging
All participants underwent MRI using a 3.0-T system (Discovery MR 750; GE Healthcare, Waukesha, WI, USA), which provided sagittal T1WIs and T2WIs and axial T2WIs. For sagittal imaging, the acquisition settings were as follows: FOV, 260×260 mm; slice thickness, 3 mm; and echo time (TE)/repetition time (TR), 8.4/530 ms (T1WI) or 104/4,540 ms (T2WI). For axial imaging, the acquisition settings were as follows: FOV, 160×160 mm; slice thickness, 4 mm; and TE/TR, 100/4,500 ms.
5. Diffusion tensor imaging protocol
The DTI protocol included DTI sequences in the axial plane with and without the rFOV. The participants were scanned in the supine position using a Sense XL Torso coil (Philips Healthcare, Best, The Netherlands). Conventional FOV and rFOV scans were performed using a special sensitivity array encoding technique (factor: 2, spectral–spatial radio frequency pulse, and water excitation method), a diffusion-weighted spin-echo single-shot echoplanar imaging with free-breathing technique, 11 different diffusion gradients, and a b-value of 800 sec/mm2. The rFOV was generated using the FOV Optimized and Constrained Undistorted Single-shot sequence (GE Healthcare) and a two-dimensional spatially selective echoplanar RF excitation pulse. In total, 52 slices for the conventional FOV and 16 slices for the rFOV (contiguous thickness: 3 mm) were acquired from the L5 to S1 nerve roots. For the conventional FOV, the parameters were as follows: TR, 6,000 ms; TE, 74.5 ms; 4 excitations; FOV, 320×256 mm; matrix, 96×192; voxel size, 3.33×1.33×3 mm; and total acquisition time, 4 minutes 54 seconds. For the rFOV, the parameters were as follows: TR, 6,000 ms; TE, 55.6 ms; 6 excitations; FOV, 100×60 mm; matrix, 68×34; voxel size, 1.47×1.76×3 mm; and total acquisition time, 7 minutes 18 seconds.
Results
Among the 46 vertebrae, we observed clear LSS (Schizas grade B–D) in 13 vertebrae at L4/5 and no clear findings (Schizas grade A) for the other 13 affected vertebrae. High-intensity contrast was observed in the spinal canal without stenosis, whereas low-intensity contrast was associated with severe stenosis on the ADC map (Fig. 4).
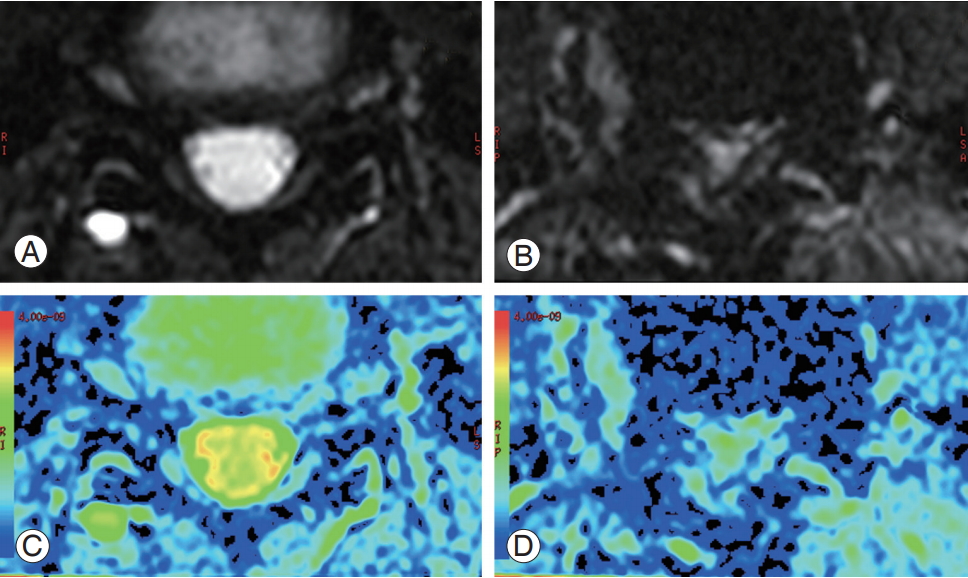
Diffusion-weighted images and apparent diffusion coefficient maps of a healthy volunteer (A, C) and a patient with lumbar spinal stenosis (B, D). High-intensity contrast was observed in the spinal canal without stenosis (C), whereas lower-intensity contrast was observed in the spinal canal with stenosis (D).
The ADC values were 2.72±0.12 at L4/5 in the healthy volunteers, 2.76±0.19 at L5/S1 in the healthy volunteers, 1.77±0.58 at L4/5 in the patients with LSS, and 2.35±0.29 at L5/S1 in the patients with LSS. The ADC values at L4/5 in the patients with LSS were significantly lower than those at L4/5 in the healthy volunteers and L5/S1 in the patients with LSS (p<0.05) (Fig. 5). No other significant differences were observed. Moreover, based on an ADC cutoff value of 2.46 for detecting LSS, this technique provided an area under the curve of 0.81, sensitivity of 0.92, and specificity of 0.76 (p<0.05). The ADC values had good intraobserver reliability (r=0.972, p=0.527) and good interobserver reliability (r=0.902, p=0.455).
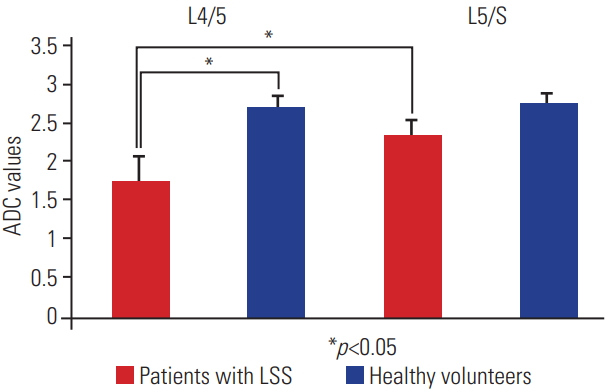
ADC values from healthy volunteers and patients with LSS. On the left, the values at L4/5 in patients with LSS and healthy volunteers are shown; on the right, the values at L5/S1 in patients with LSS and healthy volunteers are shown. Red indicates patients with LSS and blue indicates healthy volunteers. Left side: the ADC values were 1.77±0.58 at L4/5 in patients with LSS and 2.72±0.12 at L4/5 in healthy volunteers. The ADC values at L4/5 in patients with LSS were significantly lower than those at L4/5 in healthy volunteers (p<0.05). Right side: the ADC values were 2.35±0.29 at L5/S1 in patients with LSS and 2.76±0.19 at L5/S1 in healthy volunteers, and no significant difference was observed between these two ADC values. Moreover, the ADC values at L4/5 in patients with LSS were significantly lower than those at L5/S1 in patients with LSS (p<0.05). ADC, apparent diffusion coefficient; LSS, lumbar spinal stenosis.
1. Apparent diffusion coefficient maps of a patient with lumbar spinal stenosis
A 49-year-old woman with a 3-month history of lower back pain and bilateral lower limb pain, which intermittently appeared after walking for 5 minutes, visited Chiba University Hospital. She exhibited sensory disturbance in both lower limbs but no muscle weakness and bladder or rectal disturbance. Her Japanese Orthopedic Association score was 12 (range, 0–29; lower scores indicate poorer conditions). DWI (b=0) revealed spinal canal stenosis at L3/4, L4/5, and L5/S1 (Fig. 6). The ADC values were 2.272 at L3/4, 1.962 at L4/5, and 2.092 at L5/S1. Based on the diagnosis of LSS, we performed laminectomies at L3/4, L4/5, and L5/S1.
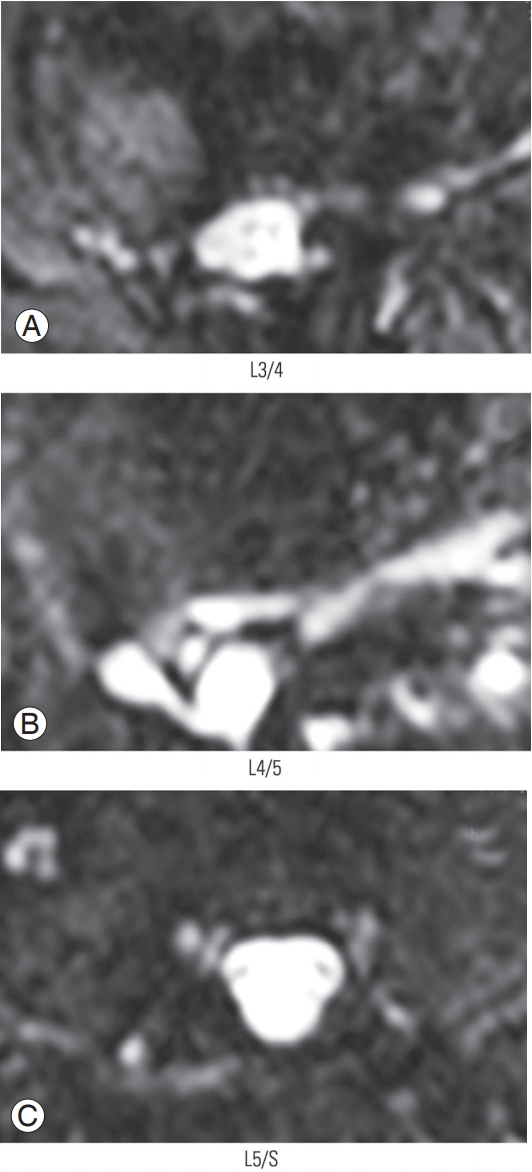
Diffusion-weighted images of patients with spinal canal stenosis at (A) L3/4, (B) L4/5, and (C) L5/S1.
At 3 months postoperatively, the patient’s lumbar and left lower limb pain improved, and her Japanese Orthopedic Association score was 24 (12 points higher than the score obtained during preoperative assessment). Furthermore, the ADC values improved to 2.583 at L3/4, 2.843 at L4/5, and 2.833 at L5/S1. Although contrast in the spinal canal in the preoperative ADC maps was limited, highintensity contrast and improvement were detected in the follow-up ADC maps (Fig. 7).

ADC maps before surgery at (A) L3/4, (B) L4/5, and (C) L5/S1 and after surgery at (D) L3/4, (E) L4/5, and (F) L5/S1. The spinal canal showed low-intensity contrast on the ADC map (white arrow) before surgery, but high-intensity contrast and improvement were observed after surgery. ADC, apparent diffusion coefficient.
Discussion
Our study results demonstrated that the ADC value at L4/5 in the patients with LSS was significantly lower than that at L5/S1 in the patients with LSS and that at L4/5 and L5/S1 in the healthy volunteers. DWI can be used to examine the Brownian motion of water molecules, and ADC maps provide a quantified measure of this motion. Thus, a high DWI signal indicates relatively free water movement, which corresponds to a high ADC value. In contrast, a low DWI signal indicates relatively impaired water movement, which corresponds to a low ADC value.
Based on this theory, the spinal canal revealed lowintensity DWI, and the ADC value was low in patients with LSS in our study. These findings are because of the decrease in the diffusion of water molecules due to spinal canal stenosis. Based on the small difference between L4/5 and L5/S1 in the patients with LSS, the affected vertebrae appear to have a limited effect on adjacent vertebrae. However, additional studies are required to determine whether other conditions, such as multiple intervertebral stenosis, affect adjacent vertebrae.
When the ADC cutoff value was 2.46, the sensitivity was 0.92 and the specificity was 0.76. Although the number of cases was small, this tendency was preserved. However, further studies with a large number of cases are required to obtain more comprehensive results. In this study, two spinal surgeons analyzed the images; however, both the intraobserver reliability and interobserver reliability appeared adequate.
ADC maps have been widely used to examine neoplastic lesions, cerebrovascular diseases, and the central nervous system [11-16]. In this context, unlike DWI, ADC provides a quantifiable value, which is not influenced by T2W sequences. In addition, the b-value at the time of measurement must be accurate because this parameter generates no theoretical difference owing to the difference in the magnetic field intensity and imaging method. Thus, when discussing diffusion, it is necessary to consider it based on ADC instead of DWI.
In the cervical region, the fractional anisotropy value is significantly different at the vertebral body level, although there is reportedly no significant difference in the ADC values [17,18]. However, it is difficult to obtain high-resolution images in the spinal region relative to the central nervous region [19], although it is possible to obtain highresolution spinal images by reducing the FOV [20-22]. Thus, diffusion tensor tractography and ADC maps are expected to provide high-resolution data for the lumbar region; this can improve the accuracy of the diagnosis of stenosis [9].
In the case that we described, the patient exhibited a postoperative increase in the ADC values, with improvement from a low-intensity signal to a high-intensity signal on the ADC maps. These changes were confirmed on the basis of improvement in the Japanese Orthopedic Association score.
Numerous reports have described lateral lesions of the spinal canal using DWI in the lumbar region [23,24]; however, no reports have described lesions in the spinal canal. Therefore, the use of an ADC map to visualize and quantify lesions in the spinal canal may improve diagnostic accuracy and facilitate effective treatment; however, further cases should be evaluated.
This study has several limitations. First, the sample size was small, and additional studies with large number of cases are needed to validate our findings. Second, because the 13 affected vertebrae were all located in L4/5 vertebrae, examination of different cases is important. Third, it would be useful to determine the effects of surgical and internal medicine treatment for these types of cases as well as any effects on the ADC values and changes over time.
Conclusions
Using ADC maps with DWI to visualize and quantify lesions in the spinal canal, we found that the affected vertebrae exhibited significantly decreased ADC values. An ADC cutoff value of 2.46 provided a sensitivity of 0.92 and specificity of 0.76 for identifying LSS.
Notes
No potential conflict of interest relevant to this article was reported.
Author Contributions
HK1 conceived and designed the study protocol, collected the data, performed the analysis, and wrote the manuscript. MN, YE, YO, SO1, KI, KA, MI, HK2, TU, KM, YM, TF, MK, YA, AW, KT, and SO2 contributed to the study design, analysis, and critical revision of the manuscript. All authors agree to be accountable for all aspects of the work in ensuring that questions related to the accuracy or integrity of any part of the work are appropriately investigated and resolved. All authors have read and approved the final manuscript.

