


Introduction
A randomized controlled trial by Weinstein et al. [1] showed that brace treatment for adolescent idiopathic scoliosis (AIS) is effective and avoids the need for surgery. It is known that the progress of AIS is related to body growth, that is, the greatest curvature of the scoliotic spine occurs at peak-height velocity (PHV) [2]. Therefore, bracing must be started before PHV to prevent curvature progression optimally. The growth stage is currently assessed using one or more of the following parameters: increase in height and arm span [3], menarche [4], triradiate cartilage closure [2], and RisserŌĆÖs sign [5]. However, each method has limitations. Assessing the increase in height and arm span requires continuous measurement, and it is possible to miss the appropriate time of treatment initiation. Menarche, triradiate cartilage closure, and RisserŌĆÖs signs are noticed only when they appear; Sanders et al. [2] reported that they usually appear after PHV has already passed. There are few methods that can evaluate growth before PHV using only one measurement.
Recently, new evaluation methods using radiographic measurements of hand/wrist bones, such as the Tanner-Whitehouse III method (TW3) [6-8] and the distal radius and ulna classification (DRU) [3], have been developed and validated. The TW3 score is clinically complicated, as it requires access to the Tanner-Whitehouse III atlas for individual bone scores. Sanders et al. [9] described a simplified TW3 system (sTW3) with high inter-observer and intra-observer reliability for the classification of skeletal maturity in patients with idiopathic scoliosis. Their study evaluated the reliability of sTW3-based assessment of skeletal maturity in 22 patients with AIS. A high reliability was observed even when the assessment was performed by a resident; however, prior training was required. Because the 22 patients with AIS were classified into eight stages, the number of patients in each stage was small. Furthermore, the study did not consider which stages corresponded to growth spurts (GS) and growth cessation (GC).
DRU was first described by Luk et al. [3], employing it to evaluate bone maturity using hand radiography in 150 patients with AIS. In this classification, the radius and ulna are independently evaluated and divided into 11 (R, 1ŌĆō11) and nine stages (U, 1ŌĆō9), respectively. Because the report included 48 girls before menarche and 97 after menarche, a relatively large number of cases were recorded at each stage, and they were categorized as R5ŌĆō11 stages for the radius examination and U2ŌĆō9 stages for the ulna examination. It was reported that GS corresponded to R7 U5 and GC corresponded to R11 U9, and the reliability was high. Preliminary training was not required for DRU; however, the reliability of the evaluation by a resident physician was unknown, and the intraclass correlation coefficients (ICCs) of DRU indicated very high reliability [10,11].
RisserŌĆÖs sign and menarche can easily be used as indicators in outpatient settings, but their reliability is low due to the large deviation in their appearance [4,12-14]. Although the abovementioned data might indicate that sTW3 and DRU can be used relatively easily and reliably in outpatient settings, there are currently no reports evaluating which of these two methods is easier to use and more reliable. Thus, we sought to determine which of these two methods is the most reliable via a retrospective study in a population of girls with AIS.
Materials and Methods
We retrospectively evaluated 54 hands of 40 girls with AIS who visited Nara Medical University Hospital from 2000 to 2015, using their previously collected radiographs. Hand radiographs of 14 girls were captured twice because they had first visited the hospital at a very young age. The ethics committee of Nara Medical University approved this study (approval no., 1951). Informed consent was obtained from all individual patients and parents included in the study. Radiographs obtained via a SONIALVISION (Shimadzu, Kyoto, Japan) system were accessed using a picture archiving and communication system, and the left hands of all patients were assessed. Two orthopedic surgeons (a spine surgeon and a pediatric orthopedic surgeon, each with over 10 years of experience) assessed the images while blinded to the patientsŌĆÖ data using each method (sTW3 and DRU), as previously described [3,9]. The spine surgeon subsequently performed intra-observer assessments 2 weeks after the image evaluations. If a difference occurred between the two physicians involved in the inter-observer assessments or within the intra-assessment, we considered the findings in detail according to previous studies and determined the appropriate stage by consensus.
The DRU classification evaluates bone maturity in the epiphyseal line of the distal radius and distal ulna using a left-hand radiograph only [3]. The radius and ulna are independently evaluated and divided into 11 stages (R, 1ŌĆō11) and nine stages (U, 1ŌĆō9), respectively (Table 1).
The sTW3 system evaluates 21 epiphyseal lines, including all phalanges, metacarpal bones, and both the distal radius and distal ulna [9]. Bone maturity in the sTW3 system is divided into eight stages (Table 2).
Data analyses were conducted using the IBM SPSS software ver. 24.0 (IBM Corp., Armonk, NY, USA). The nonparametric kappa coefficient was derived in order to assess reliability, and a probability value (p) <0.05 was considered to denote statistical significance. The kappa coefficient was derived in accordance with the report by Landis et al., with the categories delineated as follows: slight, 0ŌĆō0.2; fair, 0.2ŌĆō0.4; moderate, 0.4ŌĆō0.6; substantial, 0.6ŌĆō0.8; and almost perfect, 0.8ŌĆō1.0 [15]. Age was reported as mean (standard deviation), and errors were reported as both absolute numbers and percentages.
Results
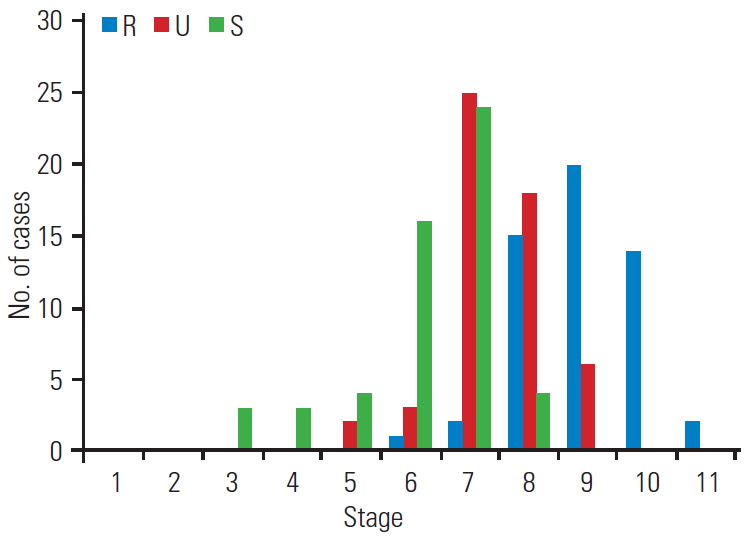
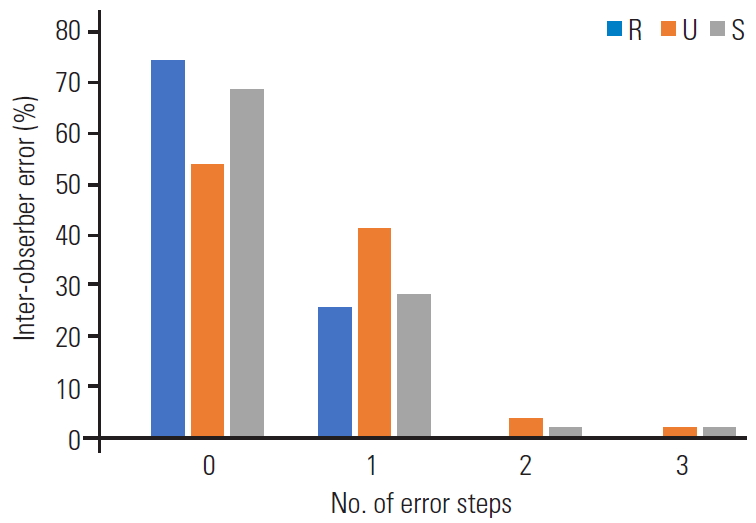
The average age of the patients at the time of radiography was 13.9┬▒1.7 years. The range of each classification stage was radius (R), 6ŌĆō11; ulna (U), 5ŌĆō9; and sTW3, 3ŌĆō8 (Fig. 1). In terms of the inter-observer/intra-observer kappa coefficients of DRU(R), DRU(U), and sTW3, both of the DRU(R) values were highest at 0.64/0.62 (Table 3). In terms of inter-observer errors, DRU(R) showed a high rate of no-step errors without any two- or three-step errors. Although sTW3 also demonstrated a high rate of no-step error, some two- and three-step errors were present (Fig. 2). In terms of intra-observer error, both classifications showed high rates of no-step error and low rates of two- and three-step errors. The sTW3 classification exhibited a relatively low rate of no-step error and a high rate of onestep error (Fig. 3). The kappa values of DRU(R) for both intra- and inter-observer reliability were highest; both were over 0.6, a reliability that would be considered ŌĆ£substantialŌĆØ according to the definition of Landis and Koch [15].
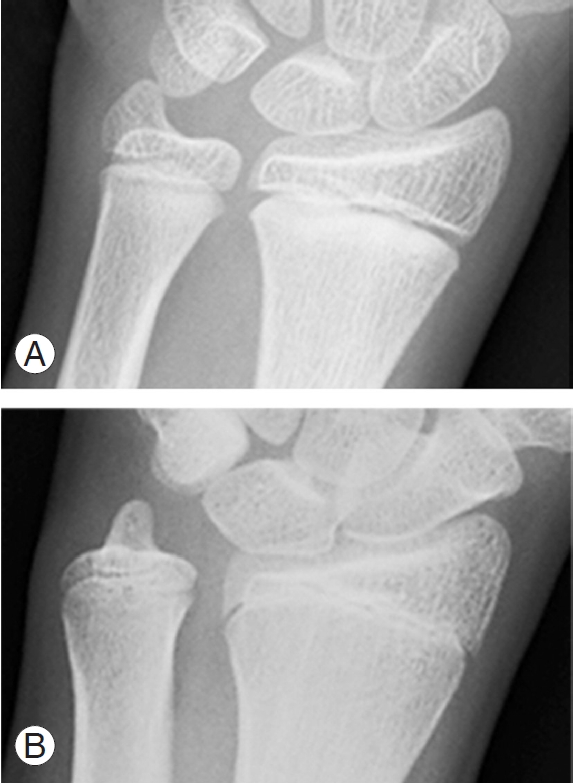
In DRU(U), there were 10 cases (18.5%) in which the position of the ulnar styloid process was changed as a result of wrist pronation (Fig. 4). There were 7 (70%) and 4 (40%) inter-observer and intra-observer errors, respectively; among these 10 cases, significantly higher rates were observed than in the cases with intermediate positioning of the ulnar styloid process.
Discussion
In this study, DRU(R) showed the highest reliability in terms of inter- and intra-observer reliability among sTW3, DRU(R), and DRU(U). However, the reliability of DRU(R) was lower than that reported previously [3,10], which may be explained by differences in the statistical methods used. For example, we used kappa coefficients, while previous reports used ICCs. Our data also showed that DRU(R) demonstrated the highest ICC scores among the same groups (data not shown). DRU is evaluated on an ordinal scale; hence, we used kappa coefficients.
Sanders et al. [9] reported that the kappa coefficients using the sTW3 system for inter-observer and intra-observer reliability were 0.84 and 0.96, respectively. Additionally, the sTW3 system evaluates 21 epiphyseal lines, including all phalanges, metacarpal bones, and both the distal radius and distal ulna. Therefore, considerable time and effort are required on the examinerŌĆÖs part, and the risk of overlooking a line or making an erroneous measurement may be high. In fact, preclinical training in sTW3 is required to reduce the above risks and to increase the accuracy of the results. Sanders et al. [9] noted that a high reliability could be obtained only after the investigator had completed sTW3 training while describing the learning curve as ŌĆ£modestŌĆØ. In the present study, two independent investigators performed assessments using both the DRU and sTW3 methods without previous training, after only reading the original publications describing these methods. It is very likely that these two investigators overlooked the key evaluation lines because of their lack of experience and may not have necessarily evaluated the same lines. The net result was a reduction in the differences between the inter-observer and intra-observer kappa coefficients. Thus, the kappa coefficients obtained in our study using the sTW3 technique might have underestimated its overall reliability.
RisserŌĆÖs sign and menarche are used as indicators of skeletal maturity; however, they are not suitable for accurate prediction of GS as they may overlook its occurrence [2]. They are also inadequate indicators of GC as 75.2% of AIS patients may have persistent growth after capping of the iliac apophysis [16]. Furthermore, RisserŌĆÖs sign is not an accurate predictor of additional growth due to the large deviation of its apophyseal fusion timing [4,12,13]. Meanwhile, menarche often appears late and is a less reliable indicator of peak growth termination [14]. Vira et al. [17] reported a direct comparison of the inter- and intra-observer reliability of RisserŌĆÖs sign and sTW3. They demonstrated an average inter-/intra-observer reliability (kappa coefficient) for all examiners (junior and senior orthopedic residents, orthopedic spine residents, orthopedic spine fellows, spine attendings, and a radiologist) using sTW3 of 0.54/0.62 compared to 0.46/0.49 using RisserŌĆÖs sign, indicating that RisserŌĆÖs sign was less reliable [17]. Thus, both approaches would be inadequate as accurate indicators of skeletal maturity.
Moreover, the study by Vira et al. [17] showed that the inter-/intra-observer reliabilities between spine attendings were the highest (0.72/0.77) for sTW3, which included both GS and GC stages [14]. This indicates that, in addition to DRU, it is an adequate indicator of skeletal maturity due to its high reliability [10]. With regard to surgical decision-making, brace weaning at stage 7 of sTW3 and R9U7 of DRU shows a high risk of curve progression [18], and a Cobb angle of >40┬░ at stage 7 is associated with a significantly high risk of curve progression to >50┬░ at skeletal maturity or the need for surgical treatment [19]. It is also possible to predict the possible Cobb angle at skeletal maturity using DRU staging and the Cobb angle at the first outpatient clinic visit; thus, both would be useful for surgical decision-making [20].
The difference in the two methods is the brace weaning period. According to Cheung et al. [18], the precise period is stage 8 of the sTW3, which is the ultimate stage, and stage R10 of the DRU, which is the penultimate stage. Since stage 8 is the final stage, it is difficult to determine the timing of brace weaning accurately using sTW3. However, since the weaning period is the penultimate stage of DRU, appropriate brace weaning timing and prevention of a period of redundant brace wearing are possible [18]. Furthermore, DRU is simpler to use than sTW3 [14], and peak skeletal growth (R6U4) does not match the peak curve progression, which occurs at R7U5 [21]. Hence, both these issues would be an advantage.
Thus, although sTW3 and DRU could be regarded as valuable tools for both initializing brace wearing and finalizing treatment in AIS patients, based on the results of the current study, utilizing the more reliable DRU(R), rather than DRU(U) and sTW3, can help physicians avoid missing the appropriate treatment time point in AIS patients.
It shall be noted, however, that this study has some limitations. Only a small number of cases are available. Furthermore, many of the participants had reached menarche, and few were in the pre-PHV stage. In addition, all participants in this study were Japanese. Since Japan is an island nation with historically little influx of other ethnic groups, the Japanese may be considered to have unique cultural and ethnic characteristics. Thus, the results of this study may not be readily generalizable, and we believe that conducting similar studies is necessary for other ethnic groups. Besides, this study did not directly compare sTW3 and DRU to RisserŌĆÖs sign and menarche; therefore, their validity as indicators of skeletal maturity cannot be discounted.
DRU(U) was not evaluated correctly because the position of the ulna styloid process in 10 patients was changed under the influence of wrist pronation; thus, the position of the hand at the time of radiography needs to be defined. The position of the ulnar styloid process changes in relation to forelimb positioning and can be considered either pronated or intermediate. In the original publication that describes the DRU classification, the intermediate position was used, and the ulna evaluation in the pronated position was not explained in detail and only described at U8. In the current study, there were 10 radiographs with wrist pronation (18.5%), ranging between U5 and U8; both inter-observer and intra-observer errors in these cases were very high (inter-observer, 70%; intra-observer, 40%), and two- and three-step errors were also present. Therefore, this positional dependence could reduce the reliability of DRU(U). In contrast, DRU(R) was hardly affected by wrist pronation. DRU(U) may show high kappa coefficients when the positions of the wrist at the time of radiography are strictly defined and executed. Moreover, it is unknown whether DRU(R) shows a high kappa coefficient when performed by less-experienced resident physicians.
Further studies are necessary to reevaluate the testŌĆÖs reliability in a larger study population, in which most would have not reached menarche. If the reliability assessment at each stage shows that it is significantly low at a particular stage, a more accurate assessment of bone maturation would be achieved by using a combination of methods to compensate for the low accuracy.
Conclusions
By directly comparing DRU and sTW3, we found that the DRU(R) assessment approach is the most reliable hand radiography method for evaluating skeletal maturity in patients with AIS, owing to the lack of vulnerability to differing wrist positions on radiographs and the lower likelihood of errors caused by limited training/experience and the need for numerous measurements. Our study findings may help prevent missing the appropriate time of initiating brace treatment in patients with AIS, without excessively prolonging the outpatient time.