The Prevalence of Lumbar Paraspinal Muscle Fatty Degeneration in Patients with Modic Type I and I/II End Plate Changes
Article information
Abstract
Study Design
Retrospective case control.
Purpose
The authors of this study assessed whether the prevalence of paraspinal fatty degeneration correlates with the presence of Modic type I and I/II change in patients with low back pain (LBP).
Overview of Literature
Modic changes are bone marrow and end plate changes visible on magnetic resonance imaging.
Methods
A consecutive series of 141 patients who attended the neurosurgery outpatient clinic between April 2017 and September 2017 for nonspecific LBP were evaluated. Sixty-one patients with single-level Modic type I or I/II change constituted the patient group. Eighty age-, gender-, and body mass index (BMI)-matched patients without any Modic changes were recruited as the control group. A retrospective review was performed in 61 patients with Modic changes and 80 controls without Modic changes. The percentage of fatty muscle degeneration was graded by two reviewers using T2-weighted axial images at the L4–L5 level. The system was graded as follows: grade 0, normal; grade I, minimal focal or linear fat deposition; grade II, up to 25%; grade III, 25%–50%; and grade IV, more than 50%.
Results
Sixty-one patients with nonspecific LBP and Modic type I or I/II change and 80 patients without Modic changes were evaluated. There was no difference between these groups in terms of age, gender, and BMI distribution. The mean muscle cross-sectional area in the patient and control groups were 1,507.37±410.63 and 1,681.64±379.69. Regarding fatty degeneration, a chi-square test of homogeneity was run, and the two multinomial probability distributions were not equal within the population analyzed.
Conclusions
The novel finding of this investigation is that patients with Modic type I and I/II changes have greater amounts of fatty degeneration in their lumbar paraspinal musculature.
Introduction
Low back pain (LBP) is a common health problem and can be endemic, especially for the working-age population [1]. The majority of patients (approximately 80%) with LBP cannot with certainty be diagnosed based on a pathoanatomical entity, namely, nonspecific LBP, and this diagnosis is not satisfactory for the LBP patient or the clinician [2]. Therefore, the identification and diagnosis of patients with nonspecific LBP are critically needed. Rapid growth in medical imaging, particularly magnetic resonance imaging (MRI), has given rise to the increasing use of imaging in LBP due to its ability to provide noninvasive and reproducible information on the dynamic components of the lumbar spine and vertebral bodies, intervertebral discs, spinal ligaments, facet joints, and paraspinal muscles.
Modic changes have been described as strongly associated with LBP throughout the established literature [3-5]. The visible changes on MRI according to Modic et al. [6] are as follows: (1) type I, hypointense signal on T1- weighted imaging (T1WI) and hyperintense signal on T2- weighted imaging (T2WI), corresponding to vertebral body edema and hypervascularity; (2) type II, hyperintense signal in T1WI and hyperintense signal in T2WI, reflecting fatty replacements of the red bone marrow; and (3) type III, hypointense signal in T1WI and hypointense signal on T2WI, consisting of subchondral bone sclerosis. Mixed-type I/II and II/III Modic changes have also been reported, suggesting that these changes can convert from one type to another and that they all present different stages of the same pathologic process.
Muscles play an important role in lumbar spine stability, and studies have demonstrated an association between paraspinal muscular insufficiencies and both the development and persistence of LBP [1,7]. Moreover, MRI has allowed the investigation of lumbar extensor muscle atrophy and fatty infiltration [8,9]. Considering the potential utility of MIR use, the purpose of this study was to analyze whether the prevalence of paraspinal fatty degeneration correlates with the presence of Modic type I and I/II change on lumbar MRI scans.
Materials and Methods
1. Patient population
All procedures performed in studies involving human participants were in accordance with the ethical standards of the institutional and/or national research committee and with the 1964 Helsinki Declaration and its later amendments or comparable ethical standards. Due to the retrospective nature of the study, no consent was required.
In this retrospective study, a consecutive series of 141 patients who attended the neurosurgery outpatient clinic between April 2017 and September 2017 for nonspecific LBP were evaluated. Sixty-one patients with single-level Modic type I or I/II change constituted the patient group, and 80 age-, gender-, and body mass index (BMI)-matched patients without any Modic changes were recruited as the control group. Subjects with the following conditions were included: (1) any gender, (2) age between 18 and 45 years, (3) no evidence of other spinal diseases (congenital, pathologic, inflammatory, or infective), (4) no history of previous lumbar spine surgery, (5) no history of significant spinal injury, (6) pain localized between the costal margin and the inferior gluteal folds, with or without lower extremity pain in the past one month, (7) BMI between 18.5 and 24.9 kg/m2 , and (8) having a lumbar MRI scan. Patients with Modic type II, II/III, and III were excluded, as they are thought to manifest a more stable and chronic degenerative process.
2. Radiologic evaluation
All individuals were evaluated by MRI, including T1- and T2-weighted axial and sagittal sections of the lumbar spine (T12–S1) and a screening MRI T2-weighted sagittal imaging of the whole spine (1.5 Tesla MRI; Siemens, Munich, Germany). All MRIs were performed according to the standard clinical imaging protocol of each site. All MRI images were viewed using the Advantage Workstation ver. 4.3 (GE Healthcare, Milwaukee, WI, USA), and quantitative measurements were obtained using the digital measuring tools included in the software. Four independent evaluators (I.B.A., H.Y., M.Y.S., and A.G.A.) made quantitative measurements of MRI images using a standardized protocol, and a consensus was negotiated in case of disagreements (Y.K.). Before conducting the measurements, all evaluators underwent training to ensure similar measurement technique. Following training, each evaluator was tested on the same set of five MRI studies to determine interrater reliability (κ=0.82).
1) Modic changes
The scanning protocol was as follows: sagittal T1 turbo spin-echo sequence with recovery time of 400–750 milliseconds, echo time of 10–13 milliseconds, slice thickness of 4 mm, and field of view of 360×360 mm and sagittal T2 turbo spin-echo sequence with recovery time of 2,800–3,400 milliseconds, echo time of 50–100 milliseconds, slice thickness of 4 mm, and field of view of 360×360 mm. The classification of Modic changes was made based on one midsagittal and four parasagittal planes. Both the upper and lower end plates at each disc level (L4–L5 or L5–S1) were evaluated only for type I and mixed-type I/ II change, as all lesions containing type I change are assumed to indicate a more active process. Signal intensity changes associated with Schmorl’s nodes, or tiny spots of signal intensity change in the bone marrow adjacent to the vertebral corners, were not recorded. Only L4–L5 or L5– S1 levels were used for analysis, as most Modic changes occur at these levels [6,10,11].
2) Fatty degeneration
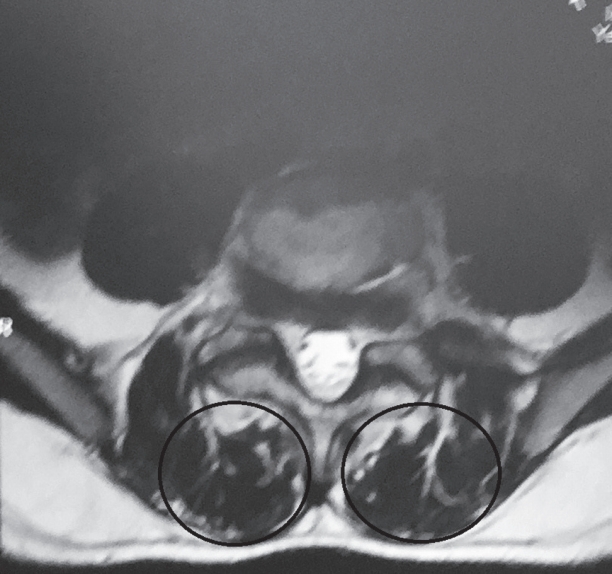
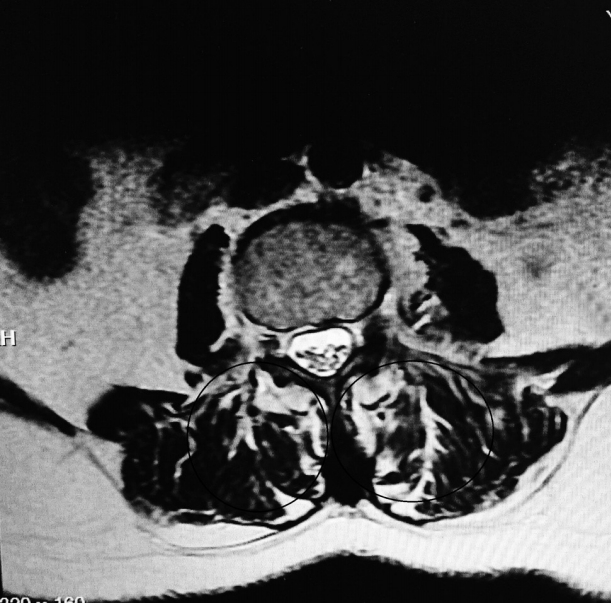
Total muscle cross-sectional area (MCSA) and fatty degeneration were assessed using axial T2-weighted fast spin-echo sequence with recovery time of 4,600 milliseconds, echo time of 90 milliseconds, slice thickness of 4 mm, and field of view of 200×200 mm. Erector spinae (including the longissimus thoracis, iliocostalis lumborum, and multifidus) are the major muscles in the low back region, and they constitute the main focus of the present study. Contours of the right and left muscle groups were manually traced on a high-resolution computer screen. The region of interest for erector spinae muscles was segmented bilaterally using the facet joint as a landmark between the multifidus and erector spinae. The axial slice used for measurement of MCSA corresponded to the L3– L4 disc level. Although the erector spinae is a segmental muscle and could theoretically be measured at any lumbar vertebral level, prior studies have shown that the MCSA is largest at this level [9,12]. Fatty degeneration in the paravertebral muscles was divided into five grades for classification: grade 0 was defined as normal, grade I as minimal focal or linear fat deposition within the muscle, grade II as fat deposition up to 25%, grade III as fat deposition of 25%–50%, and grade IV as fat deposition of more than 50% (Figs. 1–6) [13].
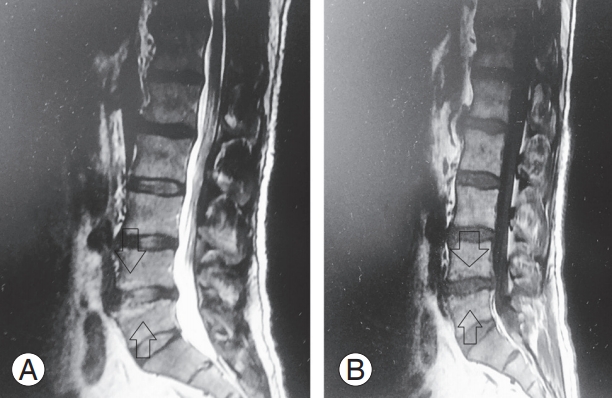
(A, B) Modic type I change at L4–L5 level on sagittal T1- and T2-weighted images (arrows).
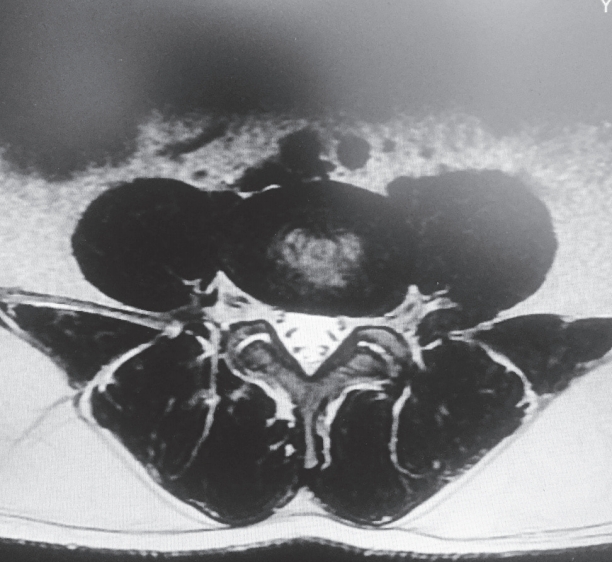
Grade 0 fatty degeneration at L4–L5 level on axial T2-weighted image.
Grade I fatty degeneration at L4–L5 level on axial T2-weighted image.
Grade II fatty degeneration at L4–L5 level on axial T2-weighted image.
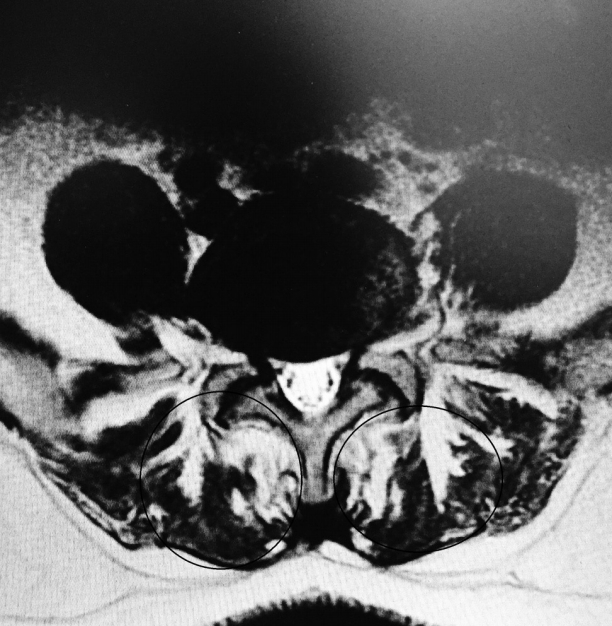
Grade III fatty degeneration at L4–L5 level on axial T2-weighted image.
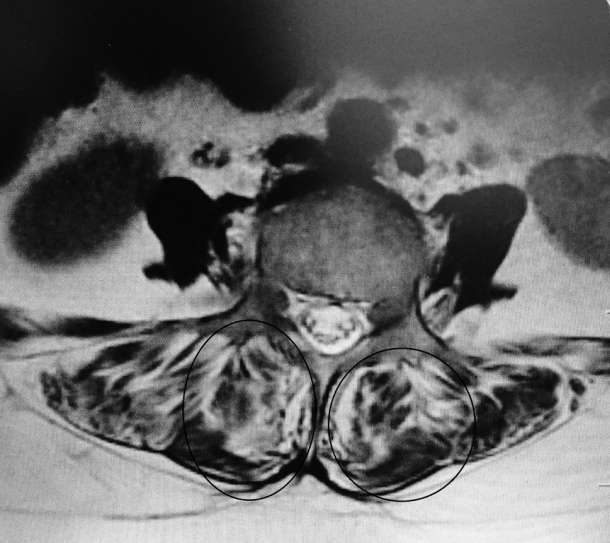
Grade IV fatty degeneration at L4–L5 level on axial T2-weighted image.
3. Statistical analysis
All statistical analyses were performed using the IBM SPSS ver. 22.0 (IBM Corp., Armonk, NY, USA). Kolmogorov-Smirnov test was used as a test of normality for all continuous variables. Continuous variables were expressed as mean±standard deviation in all tables. Categorical variables were compared via chi-square test between groups. When the expected values in any of the cells of a contingency table were below five, one-tailed Fisher’s exact test was used. Paired and unpaired Student t-tests were used to determine if there were differences within subjects and between subjects. A linear model was fitted to the data using gender, age, duration of LBP, and BMI as covariates. A p-value of 0.05 was used to determine significance.
Results
Sixty-one patients (29.7±5.06 years) with Modic type I and I/II change and 80 patients without Modic changes (30.0±5.10 years) were evaluated. The patient group consisted of 39 males and 22 females, and the control group consisted of 47 males and 33 females. There was no difference between the groups in terms of age, gender, and BMI distribution (p=0.703, p=0.602, and p=0.978, respectively).
Of 61 patients studied, 37 (60.7%) were found to have Modic changes at the L4–L5 level, and 24 (39.3%) had Modic changes at L5–S1 level. The mean total MCSA in the patient and control groups were 1,507.37±410.63 and 1,681.64±379.69, respectively (p=0.029). There was no change in cross-sectional area (CSA) with age in either sex (p=0.65), but females had lower CSAs than males (p<0.001). Regarding fatty degeneration, a chi-square test of homogeneity was run, and the two multinomial probability distributions were not equal in the population, χ2(4)=42.426, p<0.0001. None of the covariates were associated with fatty degeneration, except for age (β=0.0040, p<0.0001). Observed frequencies and percentages of fatty degeneration grades for each group are presented in Table 1.

Intramuscular fatty degeneration in study groups
Discussion
The principal novel finding of this investigation is that patients with LBP demonstrate that fatty degeneration is more likely to be associated with Modic type I and I/II changes. To the authors’ knowledge, this is the first study assessing the association of Modic changes and paraspinal fatty degeneration.
Modic changes are bone marrow and end plate changes visible on MRI. Bone marrow signal changes in the vertebral bodies were first reported by de Roos et al. [14]. Later, Modic et al. [6] described three different Modic types (I, II, and III). Since then, mixed Modic lesions (I/II and II/ III) have also been identified, suggesting that all Modic changes can progress from one type to another [6,14,15]. The prevalence of Modic changes varies from 18% to 62% in patients with LBP [1,16,17]. According to the results of previous studies, types I and II are the most common patterns in the lumbar spine, and the distribution at L4–L5 or L5–S1 levels are most common [6,11].
Furthermore, Modic changes are associated with increasing age, weight, and male gender [16,18]. Consistent with the literature, the majority (63.9%) of our patient group consisted of male patients. Although the significance of Modic changes remains poorly understood, a series of prospective studies indicating a strong association between Modic changes (especially type I) and nonspecific LBP have been conducted [11,18-21].
Several studies have demonstrated an association between LBP and paraspinal muscle degeneration [22,23]. This degeneration is characterized by a decrease in size and an increase of fat and interstitial connective tissue. Several investigators have assessed such morphologic changes of the paraspinal muscles in patients with chronic LBP with the use of imaging techniques. As in our study, the CSA and fat content of the muscles have been evaluated by using MRI [24-27]. Most studies report an increase of fat within the paraspinal muscles or a decreased CSA of the paraspinal muscles [24-30]. In the present investigation, patients with LBP with Modic type I and I/II changes had a significantly larger percentage fat content (80.3%) when compared with that of the patients without Modic changes (27.5%). Because a correlation of fatty muscle degeneration with age and sex is known, the authors eliminated these factors by matching the groups for age, sex, and BMI. However, whether Modic changes precede fatty degeneration or are rather consequences of back pain is still debatable.
One of the main limitations of this investigation is that it only includes patients between the ages of 18 and 45 years. While degeneration can begin at quite a young age, it is more common above 45 years of age (both spinal degeneration and paraspinal muscle degeneration). However, this age group was selected because the sole aim of this study was to investigate Modic changes and paraspinal muscle fatty degeneration. The age-related degenerations were out of the scope of this article, so it was used as an exclusion criterion. Another limitation was the measurement of paraspinal CSA at a single level. As stated by Urrutia et al. [31], no single-level CSA is representative of the whole lumbar spine. In this study, L3–L4 was chosen, as the MCSA is largest at this level. However, a standardized multilevel evaluation of the paraspinal musculature should be performed in future investigations.
Conclusions
This retrospective study examined the prevalence of lumbar paraspinal muscle fatty degeneration in a cohort of patients with Modic type I and I/II end plate changes and healthy controls. The results indicate that individuals with Modic changes have smaller CSAs but fattier infiltrate, compared to healthy controls. Although CSA is greater in males than females, it does not decline with age, whereas fatty infiltrate increases with age in both groups. Although Modic changes are usually overlooked during MRI interpretations, together with our findings, the authors believe that more attention should be given for possible paravertebral muscle degeneration in these patients, as paravertebral muscles have a very important role in lumbar spine stability. However, further longitudinal research is required to elucidate the underlying mechanisms of Modic changes versus changes in muscle quality and their functional implications.
1. What is already known about this topic?
1) Modic changes are bone marrow and end plate changes visible on MRI.
2) Modic changes have been described as being strongly associated with LBP.
2. What does this study add?
1) Patients with Modic type I and I/II changes have greater amounts of fatty degeneration.
2) The amount of paraspinal fatty degeneration correlates with Modic changes in their lumbar paraspinal musculature.
3) These changes should be kept in mind for possible paravertebral muscle degeneration.
Notes
No potential conflict of interest relevant to this article was reported.
Author Contributions
IBA, HY, MYS, AGA, and YK conceived of the presented idea. IBA, HY, MYS, AGA, and YK developed the theory and performed the computations. IBA, HY, and MYS verified the analytical methods. IBA, HY, MYS, AGA, and YK investigated and supervised the findings of this work. All authors discussed the results and contributed to the final manuscript.