Posterior Dural Shifts Following Spinous Process-Splitting Multi-Level Intervertebral Lumbar Laminectomies
Article information
Abstract
Study Design
Retrospective cohort study.
Purpose
The aim of our study is to evaluate the extent of posterior spinal dural shift following spinous process splitting multi-level intervertebral lumbar laminectomies, and determine the relationship between posterior spinal dural shift and preoperative parameters.
Overview of Literature
There are no existing studies on the posterior spinal dural shift after spinous process-splitting multi-leveled lumbar laminectomies.
Methods
We examined 37 patients who underwent spinous process-splitting laminectomies in at least two intervertebral levels, including at the L5/S level. We defined the distance between the vertebral bodies and the anterior edge of the dural sac in the magnetic resonance images at the L5 vertebral level as the anterior dural space (ADS) and detected the difference (d-ADS) between preoperative ADS (pre-ADS) and postoperative ADS (post-ADS). We assessed the relationship between ADS or d-ADS, and preoperative parameters, including age, sex, lumbar lordosis, focal lordosis (FL), and number of decompression levels.
Results
Post-ADS was significantly greater than pre-ADS (p<0.001). Pre-ADS was significantly correlated with FL (p=0.44, p<0.01) and also with post-ADS (p=0.43, p<0.01). d-ADS was negatively correlated with pre-ADS (p=−0.37, p<0.05). A single regression analysis revealed that the relationship between d-ADS and pre-ADS was described as d-ADS=3.67−0.46×pre-ADS. In one of three patients whose d-ADS was above the range of two standard errors, reoperation was performed because of impingement of the nerve root caused by the excessive posterior dural shift.
Conclusions
Posterior dural shifts occur after spinous process-splitting multi-level lumbar laminectomies, including at the L5/S level. FL and pre-ADS are good predictive factors for posterior dural shift. Excessive posterior dural shift may lead to stretching and impingement of nerve roots and thus require attention.
Introduction
Lumbar spinal stenosis (LSS) is characterized by degenerative changes in the disks, ligamentum flavum, and facet joints, resulting in the narrowing of spinal canals. Clinical manifestations include leg pain, back pain, and intermittent claudication [1]. The Framingham population study demonstrated that 19% of Americans between ages 60 and 69 had anatomical spinal stenosis, and in 2001 [2], approximately 240,000 underwent surgery for LSS [3]. In Japan, the prevalence of LSS is estimated to be 5.7%–9.3% [4,5].
Although lumbar fusion surgeries with instrumentations increased 15-fold between 2002 and 2007 in the United States [6], lumbar decompression surgery without instrumentations for LSS yields good surgical outcomes [1,7] and is thus a viable a surgical option. Decompression surgery includes removing the lamina and ligamentum flavum from the posterior sides to regain an appropriate spinal canal diameter. Some complications include foraminal stenosis, reported in approximately 60% of patients with failed back surgery syndrome [8]; also lumbar instability was reported in 9% of patients within 5 years postoperatively [9].
After decompression surgery, spinal dura mater shifts posteriorly because there are only loose connections— namely, Hofmann’s ligaments—between the posterior longitudinal ligaments (PLLs) and anterior dural sacs [10-12]. Many reports have been published on the extent of decompression levels and posterior spinal cord shift in patients undergoing cervical laminectomy or laminoplasty. Excessive posterior spinal cord shift is theorized to be a cause of motor paralysis involving C5 nerve roots in 2%–8% of patients [13-22]. However, to our knowledge, no reports have been published on the extent of posterior spinal dural shift in the lumbar spines of patients after undergoing spinous process-splitting lumbar laminectomies. Therefore, we aim to evaluate the mechanism and the extent of posterior dural shift following lumbar laminectomies at multiple intervertebral levels.
Materials and Methods
1. Patient demographics
We conducted a retrospective review of 477 patients (269 men and 208 women) who were diagnosed with LSS or Meyerding grade I lumbar spondylolisthesis based on clinical symptoms and magnetic resonance imaging (MRI, 1.5T). All of these patients underwent lumbar decompression surgery at our institution or related hospitals between August 2006 and April 2012. Of these patients, we selected 37 (18 men and 19 women) who underwent decompressive laminectomies in at least two contiguous intervertebral levels, including L5/S level (Table 1).

Patients’ demographics and parameters
Exclusion criteria included: severe spondylolisthesis (Meyerding grade >II), spinal tumors, pyogenic spondylitis, vertebral fractures, or history of lumbar surgeries. Institutional Review Board approval (E1718) was obtained, which included a waiver of informed consent for this retrospective cohort study.
2. Surgical technique
The surgical procedure included splitting the spinous process while maintaining the origin of the multifidus muscle at the spinous process, performing standard laminectomies with medial facetectomies until nerve roots were located at the pedicles, and removing the flava [23]. The spinous processes of the most proximal vertebra of laminectomies and those of the sacrum were partially preserved.
3. Measurements of the spinal dural shift with magnetic resonance imaging
We measured the distance between the posterior borderline of the vertebral bodies and the anterior edge of the dural sac and also the anterior dural space (ADS) before (pre-ADS) and after (post-ADS) laminectomies using midsagittal T2-weighted MRI at the middle levels of L5 vertebral bodies. In addition, we calculated the difference between pre-ADS and post-ADS (d-ADS). We also measured the angle between the inferior edge of the Th12 vertebra and the superior edge of the S1 vertebra (preoperative lumbar lordosis [LL]) and also the angle between the superior edge of the L5 vertebra and the superior edge of the sacrum (preoperative focal lordosis [FL]) (Figs. 1, 2). All magnetic resonance (MR) images were scanned and analyzed with ImageJ (U. S. National Institutes of Health, Bethesda, MD, USA) by two independent orthopedic surgeons.

Schematic of measurements on magnetic resonance images. (A) Preoperative image. (B) Postoperative image. LL, lumbar lordosis; FL, focal lordosis; ADS, anterior dural space.
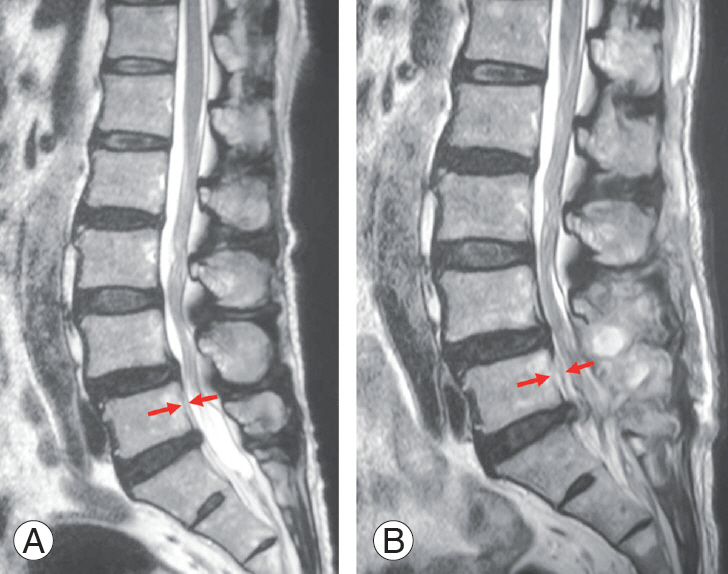
Examples of sagittal T2 weighted MR images of preoperation (A) and postoperation (B). The distance between the two red arrows is the ADS. (A) Preoperative MR image (pre-ADS=2.6 mm, LL=35.7°, FL=14.9°). (B) Postoperative MR image (post-ADS=4.9 mm, d-ADS=2.3 mm). MR, magnetic resonance; ADS, anterior dural space; LL, lumbar lordosis; FL, focal lordosis; d-ADS, difference between post-ADS and pre-ADS.
4. Clinical evaluation
Clinical outcomes were compared using preoperative and 3-month postoperative Japanese Orthopedic Association (JOA) scores (full score=29 points) (Table 2) [24]. We collected JOA scores from 32 out of 35 total patients.

JOA score classification for low back pain
5. Statistical analysis
All statistical analyses were performed with JMP Pro ver. 11.0 software (SAS Institute Inc., Cary, NC, USA). A p-value of <0.05 was determined to be statistically significant, except for intra-observer and inter-observer class analyses paired t-tests were performed to compare pre- and postoperative parameters, as well as JOA scores. A Dunnett test was used to compare JOA score improvements between groups. Non-parametric Spearman’s rank correlation tests were used to detect correlations among ADS, d-ADS, and preoperative parameters. Single regression analysis was performed to determine the relationship between d-ADS and pre-ADS. Intra- and inter-observer class analyses were done with Bell Curve (Social Survey Research Information Co. Ltd., Tokyo, Japan). Inter-observer and intra-observer class correlations were beyond 0.70 at all factors.
Results
At the time of surgery, mean age was 69.5 years (range, 28–84 years). Mean preoperative LL was 36.5°, and FL was 18.9°. The average number of decompressions was 3 (range, 2–6) (Table 1).
ADS was significantly increased postoperatively (preADS: mean±standard deviation [SD], 3.2±2.2 mm; postADSL: mean±SD, 5.4±2.7 mm; p<0.001). The mean dADS was 2.2 mm (Table 1).
Pre-ADS was significantly correlated with FL (ρ=0.44, p<0.01) and post-ADS (ρ=0.43, p<0.01). Interestingly, dADS was negatively correlated with pre-ADS (ρ=−0.37, p<0.05) (Table 3). A single regression analysis determined that the relationship between d-ADS and pre-ADS was described as d-ADS=3.67−0.46×pre-ADS (Fig. 3). JOA scores were significantly improved after surgery (p<0.001) (Table 4).

Correlations among ADSs and preoperative parameters

The relationship between d-ADS and pre-ADS. d-ADS=3.67−0.46 ×pre-ADS. Pre-ADS, preoperative anterior dural space; d-ADS, differences between post-ADS and pre-ADS.

Comparison of the JOA scores before and after surgeries (N=32)
With regard to d-ADS, there were three outliers outside of the regression formula we described (d-ADS >3.67−0.46 pre-ADS+2 root-mean-square error). These were interpreted to mean excessive posterior dural shifts. With regard to JOA improvement between the normal posterior dural shift group (d-ADS <3.67−0.46 preADS+2 root mean-square-error) and the excessive posterior dural shift group, there was a trend suggesting that the excessive posterior dural shift group had less improvement in JOA score compared with the normal posterior dural shift group (Table 5). Only one out of 35 patients in this case series had a new radiculopathy following lumbar laminectomies. This patient was a 75-year-old female with pain in the right back and lower extremities due to L3/4 to L5/S LSS. She underwent laminectomy at three intervertebral levels and although her symptoms disappeared postoperatively, she began feeling stiffness in both lower extremities and reported pain in the left thigh and right leg 4 months postoperatively. Her pre-, post-, and d-ADS were 5.9 mm, 14.0 mm, and 8.1 mm, respectively (Fig. 4), and classified as excessive posterior dural shift. Sixteen months after her initial surgery, we performed revision surgery to locate posteriorly shifted L5 nerve roots and remove the impingement at the facets. Bilateral facetectomy at each level was performed, and the nerve roots were exposed bilaterally. We observed that the left L4 and right L5 root were stretched and showed impingements at the foramens. Then, interbody fusions with posterior instrumentations were performed (Fig. 5). The second surgery appears to have resolved the tightness in her thighs and the pain in her left thigh and in her right leg. Her JOA score was 17 points before the initial surgery, which improved to 19 points 3 months after the initial surgery and to a final score of 20 points following the second surgery.

Comparison of the improvement of JOA scores between the normal posterior dural shift group and the excessive porsterior dural shift group
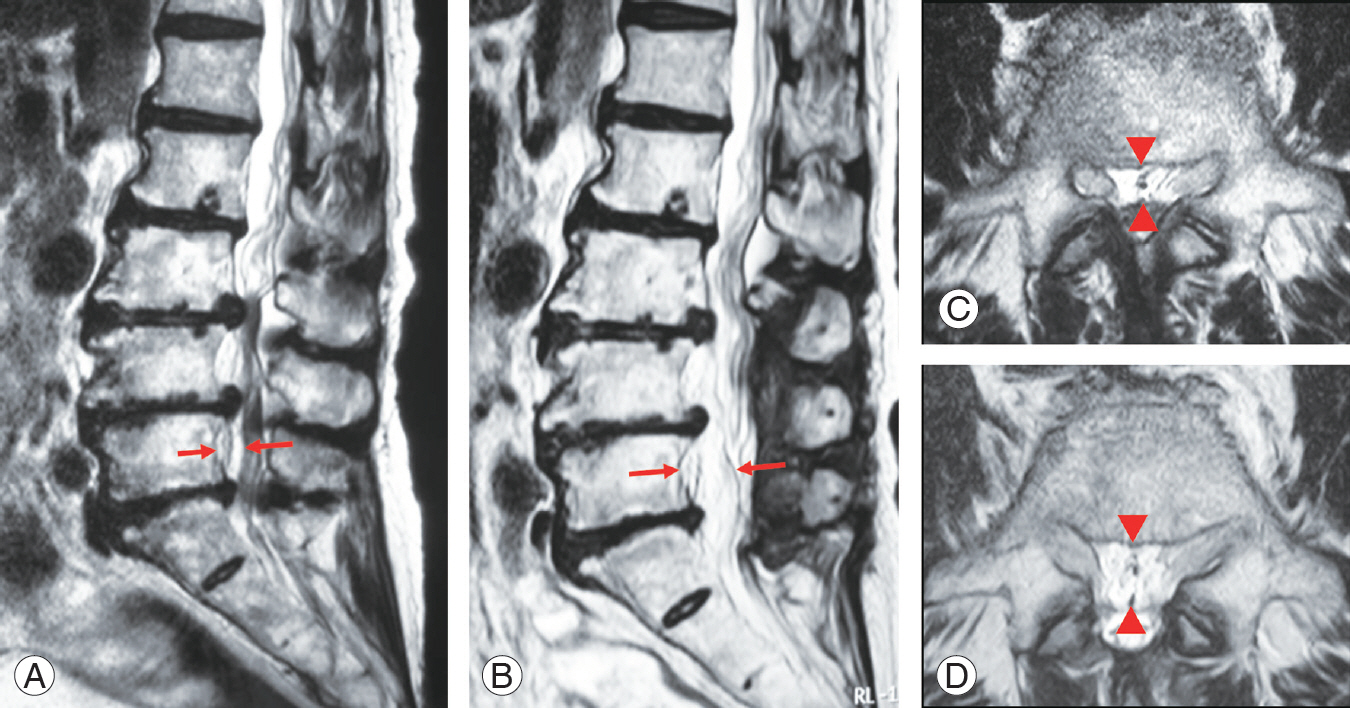
MR images of the one patient who required reoperation. The distances between the two red arrows (A, B) or the two red arrowheads (C, D) are ADSs. (A) Preoperative MR image (pre-ADS=5.9 mm, LL=27.7°, FL=16.3°). (B) MR image after the initial operation (post-ADS=14.0 mm, d-ADS=8.1 mm). (C) Preoperative axial MR image at the L5 level. (D) Postoperative axial MR image at L5 level. The dura was shifted posteriorly, and the distance between the dura and nerve roots increased postoperatively. MR, magnetic resonance; ADS, anterior dural space; LL, lumbar lordosis; FL, focal lordosis; d-ADS, difference between post-ADS and pre-ADS.
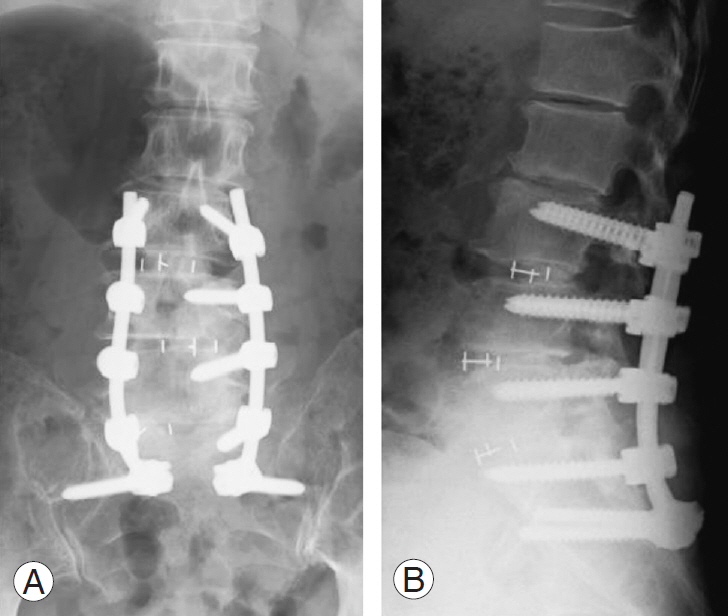
X-ray films of the patient after the reoperation. (A) Anteroposterior image. (B) Lateral image. Three levels of interbody fusions (L3/4, L4/5, L5/S) with posterior instrumentations were performed.
Discussion
Our research demonstrated that ADS was significantly increased after laminectomies, including the L5/S levels. Preoperative FL was correlated with pre-ADS. The preADS was positively correlated with post-ADS and negatively correlated with d-ADS.
The ADS contains areolar connective tissues, loose fats, lymphatics, blood vessels including Batson’s venous plexus, and Hofmann’s ligaments, which lie between the PLL and dural sac [10]. Hofmann’s ligament consists of the midline ligaments from the anterior dura to the PLL and lateral ligaments from the anterolateral dura to the lateral extent of the PLL [12]. Wadhwani et al. [11] reported that Hofmann’s ligaments also include the proximal root sleeve ligaments from the dural extension of the nerve sleeve to the PLL and periosteum of the inferior pedicle. Also, they indicated that Hofmann’s ligaments are present between the C5 and L5 levels, and that their length ranged from 0.5 to 28.8 mm. No significant difference between the length of the ligaments and vertebral levels has been reported [11]. Patients diagnosed with LSS often have lumbar disk degeneration, and disc protrusions push the PLL and dural sacs posteriorly at the level of the disks. Since the PLL is tightly attached to vertebral bodies at vertebral body levels, there was more room for the PLL and a posteriorly shifted dural sac enhanced by FL when compared with the connections between PLL and dural sacs through Hofmann’s ligaments.
With regard to cervical spines, Yusof et al. [22] reported that the mean space anterior cord (SAC) increased from 5.1 to 10 mm after cervical laminoplasty and cervical lordosis was not correlated with preoperative SAC [23]. Similarly, Sodeyama et al. [20] and Hatta et al. [15] reported that cervical alignment was not correlated with posterior shift after laminoplasty. This suggests a correlation between FL and pre-ADS. However, in the current study, we found no significant correlation between LL and ADS.
Kong et al. [17] discussed the relationship between the anterior subarachnoid space and the number of decompression levels, revealing that the average value of the anterior subarachnoid apace following laminoplasties from the C1 to C7 level was higher than the C2 or C3 to the C7 level. However, we did not find significant correlations between the number of decompression levels and pre- or post-ADSs in our study. Lee et al. [18] suggested that the space available for the spinal cord at the level cephalad to the laminectomized segments was highly correlated with the postoperative cord shift.
Postoperative motor palsy including the C5 level sometimes occurs, presumably because of the dorsal shift of the spinal cord following cervical laminoplasties [16,21]. Excessive post-ADS and d-ADS may influence the dural sacs and nerve roots. We propose two reasons for this: first is that L5 nerve roots are anatomically susceptible to impingement at the foramens as compared with the rest of the lumbar nerve roots [25], and thus it is probable that excessive post-ADS damaged the L5 nerve roots postoperatively; second is that dural sacs have been curved by the residual spinous process of the sacrum. Facetectomies and fusion surgeries with posterior instrumentations could expose nerve roots at the facets and remove bony impingements. Thus, this method may tighten the PLL and Hofmann’s ligaments, subsequently leading the occurrence of to ligamentotaxis and decrease of ADS.
In our case, we selected interbody fusions with posterior instrumentations. Then, we partially left the spinous process and the lamina of L5 to prevent excessive postADS and d-ADS when we performed multi-level laminectomies, including L5/S intervertebral level.
Our study has three limitations which warrant discussion. First, we studied only a small sample of cases involving lumbar laminectomies, including L5/S levels performed at a single institution. Further studies on the remaining lumbar levels are needed. Second, we measured all the distances and angles in mid-sagittal MR images, but did not discuss the cross-sectional area of the dural sacs, stenosis of the lateral recesses in MR axial images, or the foraminal stenosis in sagittal MRI. It is possible that ADSs could be longer in the supine position than in the standing position due to the effect of gravity; our MRI measurement angles of LL and FL may not be as exact as those of X-rays in the standing position. An MRI with straightened/extended lower extremities would reproduce the exact LL [26]. Third, the periods from the initial surgery to postoperative MRI ranged from 0.5 to 36 months (average, 4 months). Shiozaki et al. [19] reported that the spinal cord shifts more posteriorly at 24 hours than at 2 weeks after cervical laminectomies. It is probable that the ADS would change depending on the periods from the initial surgery to the postoperative MRI.
Conclusions
In conclusion, a posterior dural shift occurred after multilevel lumbar laminectomies. FL and pre-ADS are good predictive factors for posterior dural shift. As excessive posterior dural shift may lead to stretching and impingement of the nerve roots, clinicians should consider FL and pre-ADS levels.
Notes
No potential conflict of interest relevant to this article was reported.
Author Contributions
Original concept and design: TS, SF; data collection and first draft: TS, YS; and manuscript editing: TS, SF, YS, BO, ST, SM.